3 Big Changes Since The S&P 500 Was Trading This High
Higher interest rates and more expensive stock valuations combined with the cheapest implied volatility prices in years sets up ideally for a couple option strategies in SPY.
The last time the S&P 500 (SPY) was at such lofty levels was in August of last year. Back then the S&P 500 closed at $4305.20 on August 16 before plummeting to a low of just under $3500 in less than two months.
The S&P 500 has now regained virtually all the lost ground, finishing at $4282.37 on Friday.
But while things may seem very little changed from a price perspective, several other things have changed dramatically since the most recent highs in price last August. Let’s take a look at three of the biggest.
Interest Rates
Last August, interest rates were decidedly much lower than they are currently. The Fed Funds rate was at 2.25% back then versus the current Fed Funds rate of roughly 5%. This is more than double now than just less than nine months ago.
The widely followed 10-year interest rate has moved higher by just under 1% from 2.8% in August 2022 to the current yield of 3.7%. That may not seem like much, but it equates to more than a 30% increase.
Plus, recent Fed speak is pointing at even more potential rate increases in 2023. The CME Fed Watch tool is pointing at two additional ones.
Normally, higher interest rates tend to be a headwind for stock prices. Or at least traditional valuation multiples such as Price/Earnings (P/E) ratios. Yet, the past year has seen an expansion, not contraction, in the P/E ratio for the S&P 500.
Valuation
As we noted, the P/E multiple on the S&P 500 has actually expanded since last August even in the face of sharply higher interest rates. S&P 500 Price/Earnings was at 22.55 on August 16, 2022. The current P/E now stands at 24.79-or roughly a 10% expansion.
A look at the two biggest components of the S&P 500 (Apple and Microsoft) shows just how much their individual P/E ratios went up since the last time the S&P 500 was at this level. Apple P/E and MSFT P/E are both at by far the richest multiples over the past year-and far above last August.
Investors are placing a lot of faith in companies to improve their earnings over the coming quarters given the increased P/E and higher interest rate environment. We shall see if it is justified.
Implied Volatility (IV)
The VIX is a measure of 30-day implied volatility in the S&P 500. It tends to rise when stocks fall and fall when stocks. VIX is sometimes referred to as the “Fear Gauge” for this reason.
While the S&P 500 is on the verge of making new highs that exceed last August, the VIX just made a new multi-year low last seen in February 2020. Although the S&P 500 was a little bit higher last August 16 at $4305.20, VIX back then closed at 19.69. Compare that to Friday’s S&P 500 close of $4282.37 but with a corresponding VIX close of 14.60.
This huge drop in VIX from 19.69 back then to 14.60 now means option prices are currently way cheaper now than last time the S&P 500 was at a similar price last August.
How much cheaper? Let’s take a look!
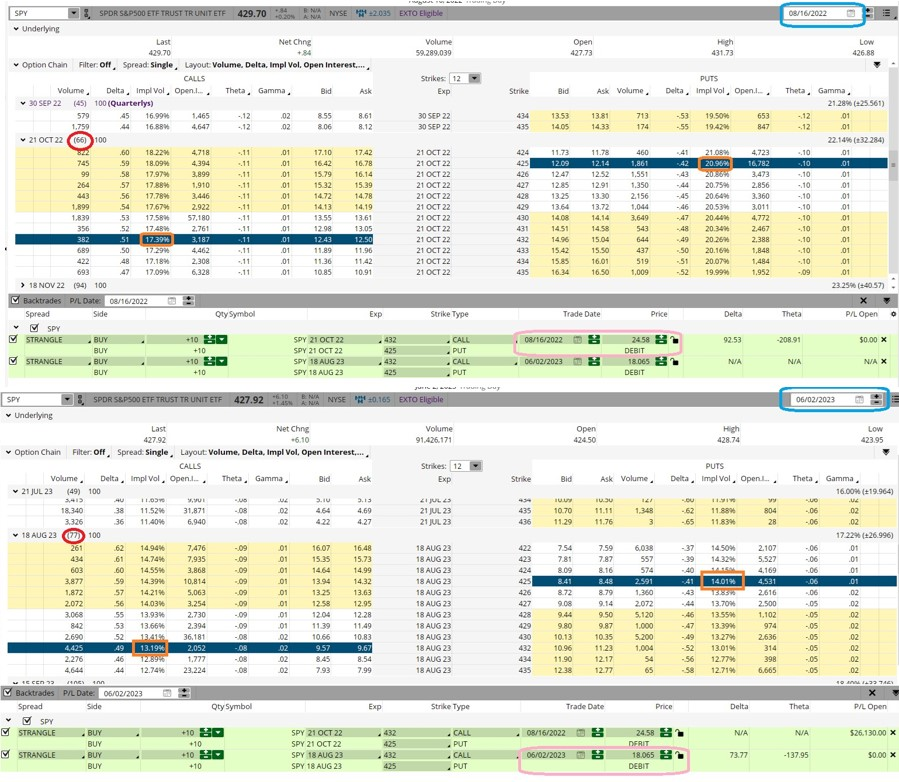
Below are two option montages showing option prices from August 16, 2022 and this past Friday- 6/2/2023.

The top montage shows the prices from 8/16/2022, the lower montage the prices from last Friday June 2, 2023. We used SPY instead of SPX for simplicity’s sake since more retail traders use SPY as the preferred way to trade the S&P 500.
As you can see, the SPY was slightly higher on 8/16/2022 by $1.78. We also looked at options that were expiring in just over two months-October 2022 expiration options (66 days to expiration or DTE) and August 2023 options (77 DTE). So, the August 2023 options back then had 11 more DTE.
A couple things jump out.
Buying the 66 DTE $432 call and $425 put (called a strangle) cost just over $24.50 back in August. This equates to roughly 5.7% of the $429.70 price of the SPY. We chose the two strikes since sPY is roughly in the middle of $432 and $425.
Compare that to buying the same $432 call/$425 put strangle but with 77 DTE now. It closed at just over $18 on Friday-or only 4.2% the $427.92 closing price of the SPY.
Usually, longer DTE makes option prices more, not less, expensive. So why is it so much cheaper now? Implied volatility.
The VIX back then was 19.69. Now it is at multi-year lows of 14.60.
That is reflected in the strangle IV of 19.17 from August 2022 (average the IV of $432 call and $425 put) versus only 13.60 average IV now.
Just looking at the put prices can help illuminate further.
Back in August, the $425 put was priced at roughly $12.10. This equates to 2.8% the price of the SPY at $429.70. DTE was 66.
Now the $425 put is trading at $8.45-or $3.65 cheaper. This now equates to under 2% the $427.92 closing price of SPY. Plus, there are 11 more days until expiration now on the August $425 puts. SPY is lower now than back then as well.
More DTE and a lower underlying price should cause put prices to go up, not down sharply. But thanks to the huge drop in IV, the puts are a heckuva lot cheaper now.
Investors and traders alike may want to consider playing option strangles as a defined risk way to play for a bona-fide breakout or breakdown. More bearish traders or investors looking to protect gains but leave the upside open should look at buying puts for a pullback or downside protection.
This is especially true given that rates have risen sharply and valuations have gone up as well. Plus, the drop in IV means it hasn’t been this cheap in years.
POWR Options
What To Do Next?
If you’re looking for the best options trades for today’s market, you should check out our latest presentation How to Trade Options with the POWR Ratings. Here we show you how to consistently find the top options trades, while minimizing risk.
If that appeals to you, and you want to learn more about this powerful new options strategy, then click below to get access to this timely investment presentation now:
How to Trade Options with the POWR Ratings
All the Best!

Tim Biggam
Editor, POWR Options Newsletter
SPY shares rose $0.16 (+0.04%) in premarket trading Monday. Year-to-date, SPY has gained 12.32%, versus a % rise in the benchmark S&P 500 index during the same period.
About the Author: Tim Biggam

Tim spent 13 years as Chief Options Strategist at Man Securities in Chicago, 4 years as Lead Options Strategist at ThinkorSwim and 3 years as a Market Maker for First Options in Chicago. He makes regular appearances on Bloomberg TV and is a weekly contributor to the TD Ameritrade Network “Morning Trade Live”. His overriding passion is to make the complex world of options more understandable and therefore more useful to the everyday trader. Tim is the editor of the POWR Options newsletter. Learn more about Tim’s background, along with links to his most recent articles.
The post 3 Big Changes Since The S&P 500 Was Trading This High appeared first on StockNews.com
https://www.entrepreneur.com/finance/3-big-changes-since-the-sampp-500-was-trading-this-high/453495