Google Announces A New Era For Voice Search via @sejournal, @martinibuster

Google announced an update to its voice search, which changes how voice search queries are processed and then ranked. The new AI model uses speech as input for the search and ranking process, completely bypassing the stage where voice is converted to text.

The old system was called Cascade ASR, where a voice query is converted into text and then put through the normal ranking process. The problem with that method is that it’s prone to mistakes. The audio-to-text conversion process can lose some of the contextual cues, which can then introduce an error.

The new system is called Speech-to-Retrieval (S2R). It’s a neural network-based machine-learning model trained on large datasets of paired audio queries and documents. This training enables it to process spoken search queries (without converting them into text) and match them directly to relevant documents.

Dual-Encoder Model: Two Neural Networks

The system uses two neural networks:

  1. One of the neural networks, called the audio encoder, converts spoken queries into a vector-space representation of their meaning.
  2. The second network, the document encoder, represents written information in the same kind of vector format.

The two encoders learn to map spoken queries and text documents into a shared semantic space so that related audio and text documents end up close together according to their semantic similarity.

Audio Encoder

Speech-to-Retrieval (S2R) takes the audio of someone’s voice query and transforms it into a vector (numbers) that represents the semantic meaning of what the person is asking for.

The announcement uses the example of the famous painting The Scream by Edvard Munch. In this example, the spoken phrase “the scream painting” becomes a point in the vector space near information about Edvard Munch’s The Scream (such as the museum it’s at, etc.).

Document Encoder

The document encoder does a similar thing with text documents like web pages, turning them into their own vectors that represent what those documents are about.

During model training, both encoders learn together so that vectors for matching audio queries and documents end up near each other, while unrelated ones are far apart in the vector space.

Rich Vector Representation

Google’s announcement says that the encoders transform the audio and text into “rich vector representations.” A rich vector representation is an embedding that encodes meaning and context from the audio and the text. It’s called “rich” because it contains the intent and context.

For S2R, this means the system doesn’t rely on keyword matching; it “understands” conceptually what the user is asking for. So even if someone says “show me Munch’s screaming face painting,” the vector representation of that query will still end up near documents about The Scream.

According to Google’s announcement:

“The key to this model is how it is trained. Using a large dataset of paired audio queries and relevant documents, the system learns to adjust the parameters of both encoders simultaneously.

The training objective ensures that the vector for an audio query is geometrically close to the vectors of its corresponding documents in the representation space. This architecture allows the model to learn something closer to the essential intent required for retrieval directly from the audio, bypassing the fragile intermediate step of transcribing every word, which is the principal weakness of the cascade design.”

Ranking Layer

S2R has a ranking process, just like regular text-based search. When someone speaks a query, the audio is first processed by the pre-trained audio encoder, which converts it into a numerical form (vector) that captures what the person means. That vector is then compared to Google’s index to find pages whose meanings are most similar to the spoken request.

For example, if someone says “the scream painting,” the model turns that phrase into a vector that represents its meaning. The system then looks through its document index and finds pages that have vectors with a close match, such as information about Edvard Munch’s The Scream.

Once those likely matches are identified, a separate ranking stage takes over. This part of the system combines the similarity scores from the first stage with hundreds of other ranking signals for relevance and quality in order to decide which pages should be ranked first.

Benchmarking

Google tested the new system against Cascade ASR and against a perfect-scoring version of Cascade ASR called Cascade Groundtruth. S2R beat Cascade ASR and very nearly matched Cascade Groundtruth. Google concluded that the performance is promising but that there is room for additional improvement.

Voice Search Is Live

Although the benchmarking revealed that there is some room for improvement, Google announced that the new system is live and in use in multiple languages, calling it a new era in search. The system is presumably used in English.

Google explains:

“Voice Search is now powered by our new Speech-to-Retrieval engine, which gets answers straight from your spoken query without having to convert it to text first, resulting in a faster, more reliable search for everyone.”

Read more:

​​Speech-to-Retrieval (S2R): A new approach to voice search

Featured Image by Shutterstock/ViDI Studio

https://www.searchenginejournal.com/google-announces-a-new-era-for-voice-search/558866/


Wikipedia Traffic Down As AI Answers Rise via @sejournal, @MattGSouthern

The Wikimedia Foundation (WMF) reported a decline in human pageviews on Wikipedia compared with the same months last year.

Marshall Miller, Senior Director of Product, Core Experiences at Wikimedia Foundation, wrote that the organization believes the decline reflects changes in how people access information, particularly through AI search and social platforms.

What Changed In The Data

Wikimedia observed unusually high traffic around May. The traffic appeared human but investigation revealed bots designed to evade detection.

WMF updated its bot detection systems and applied the new logic to reclassify traffic from March through August.

Miller noted the revised data shows “a decrease of roughly 8% as compared to the same months in 2024.”

WMF cautions that comparisons require careful interpretation because bot detection rules changed over time.

The Role Of AI Search

Miller attributed the decline to generative AI and social platforms reshaping information discovery.

He wrote that search engines are “providing answers directly to searchers, often based on Wikipedia content.”

This creates a scenario where Wikipedia serves as source material for AI-powered search features without generating traffic to the site itself.

Wikipedia’s Role In AI Systems

The traffic decline comes as AI systems increasingly depend on Wikipedia as source material.

Research from Profound analyzing 680 million AI citations finds that within ChatGPT’s top 10 most-cited sources, Wikipedia accounts for 47.9% of the top-10 share. For Google AI Overviews, Wikipedia’s top-10 share is 5.7%, with Reddit 21.0% and YouTube 18.8%.

WMF also reported a 50% surge in bandwidth from AI bots since January 2024. These bots scrape content primarily for training computer vision models.

Wikipedia launched Wikimedia Enterprise in 2021, offering commercial, SLA-backed data access for high-volume reusers, including search and AI companies.

Why This Matters

If Wikipedia loses traffic while serving as ChatGPT’s most-cited source, the model that sustains content creation is breaking. You can produce authoritative content that AI systems depend on and still see referral traffic decline.

The incentive structure assumes publishers benefit from creating material that powers AI answers, but Wikipedia’s data shows that assumption doesn’t hold.

Track how AI features affect your traffic and whether being cited translates to meaningful engagement.

Looking Ahead

WMF says it will continue updating bot detection systems and monitoring how generative AI and social media shape information access.

Wikipedia remains a core dataset for modern search and AI systems, even when users don’t visit the site directly. Publishers should expect similar dynamics as AI search features expand across platforms.


Featured Image: Ahyan Stock Studios/Shutterstock

https://www.searchenginejournal.com/wikipedia-traffic-down-as-ai-answers-rise/558803/


Review Of AEO/GEO Tactics Leads To A Surprising SEO Insight via @sejournal, @martinibuster

GEO/AEO is criticized by SEOs who claim that it’s just SEO at best and unsupported lies at worst. Are SEOs right, or are they just defending their turf? Bing recently published a guide to AI search visibility that provides a perfect opportunity to test whether optimization for AI answers recommendations is distinct from traditional SEO practices.

Chunking Content

Some AEO/GEO optimizers are saying that it’s important to write content in chunks because that’s how AI and LLMs break up a pages of content, into chunks of content. Bing’s guide to answer engine optimization, written by Krishna Madhavan, Principal Product Manager at Bing, echoes the concept of chunking.

Bing’s Madhavan writes:

“AI assistants don’t read a page top to bottom like a person would. They break content into smaller, usable pieces — a process called parsing. These modular pieces are what get ranked and assembled into answers.”

The thing that some SEOs tend to forget is that chunking content is not new. It’s been around for at least five years. Google introduced their passage ranking algorithm back in 2020. The passages algorithm breaks up a web page into sections to understand how the page and a section of it is relevant to a search query.

Google says:

“Passage ranking is an AI system we use to identify individual sections or “passages” of a web page to better understand how relevant a page is to a search.”

Google’s 2020 announcement described passage ranking in these terms:

“Very specific searches can be the hardest to get right, since sometimes the single sentence that answers your question might be buried deep in a web page. We’ve recently made a breakthrough in ranking and are now able to better understand the relevancy of specific passages. By understanding passages in addition to the relevancy of the overall page, we can find that needle-in-a-haystack information you’re looking for. This technology will improve 7 percent of search queries across all languages as we roll it out globally.”

As far as chunking is concerned, any SEO who has optimized content for Google’s Featured Snippets can attest to the importance of creating passages that directly answer questions. It’s been a fundamental part of SEO since at least 2014, when Google introduced Featured Snippets.

Titles, Descriptions, and H1s

The Bing guide to ranking in AI also states that descriptions, headings, and titles are important signals to AI systems. It’s not necessary to belabor the point that descriptions, headings, and titles are fundamental elements of SEO. So again, there is nothing about optimizing these HTML elements that is unique to AEO/GEO.

Lists and Tables

Bing recommends bulleted lists and tables as a way to easily communicate complex information to users and search engines. This approach to organizing data is similar to an advanced SEO method called disambiguation. Disambiguation is about making the meaning and purpose of a web page as clear as possible, to make it less ambiguous.

Making a page less ambiguous can incorporate semantic HTML to clearly delineate which part of a web page is the main content (MC in the parlance of Google’s third-party quality rater guidelines) and which part of the web page is just advertisements, navigation, a sidebar, or the footer.

Another form of disambiguation is through the proper use of HTML elements like ordered lists (OL) and the use of tables to communicate tabular data such as product comparisons or a schedule of dates and times for an event.

The use of HTML elements (like H, OL, and UL) give structure to on-page information, which is why it’s called structured information. Structured information and structured data are two different things. Structured information is on the page and is seen in the browser and by crawlers. Structured data is meta data that only a bot will see.

There are studies that structured information helps AI Agents make sense of a web page, so I have to concede that structured information is something that is particularly helpful to AI Agents in a unique way.

Question And Answer Pairs

Bing recommends Q&A’s, which are question and answer pairs that an AI can use directly. Bing’s Madhavan writes:

“Direct questions with clear answers mirror the way people search. Assistants can often lift these pairs word for word into AI-generated responses.”

This is a mix of passage ranking and the SEO practice of writing for featured snippets, where you pose a question and give the answer. It’s a risky approach to create an entire page of questions and answers but if it feels useful and helpful then it may be worth doing.

Something to keep in mind is that Google’s systems consider content lacking in unique insight on the same level of spam. Google also considers content created specifically for search engines as low quality as well.

Anyone considering writing questions and answers on a web page for the purpose of AI SEO should first consider the whether it’s useful for people and think deeply about the quality of the question and answer pairs. Otherwise it’s just a page of rote made for search engine content.

Be Precise With Semantic Clarity

Bing also recommends semantic clarity. This is also important for SEO. Madhavan writes:

  • “Write for intent, not just keywords. Use phrasing that directly answers the questions users ask.
  • Avoid vague language. Terms like innovative or eco mean little without specifics. Instead, anchor claims in measurable facts.
  • Add context. A product page should say “42 dB dishwasher designed for open-concept kitchens” instead of just “quiet dishwasher.”
  • Use synonyms and related terms. This reinforces meaning and helps AI connect concepts (quiet, noise level, sound rating).”

They also advise to not use abstract words like “next-gen” or “cutting edge” because it doesn’t really say anything. This is a big, big issue with AI-generated content because it tends to use abstract words that can completely be removed and not change the meaning of the sentence or paragraph.

Lastly, they advise to not use decorative symbols, which is good a tip. Decorative symbols like the arrow → symbol don’t really communicate anything semantically.

All of this advice is good. It’s good for SEO, good for AI, and like all the other AI SEO practices, there is nothing about it that is specific to AI.

Bing Acknowledges Traditional SEO

The funny thing about Bing’s guide to ranking better for AI is that it explicitly acknowledges that traditional SEO is what matters.

Bing’s Madhavan writes:

“Whether you call it GEO, AIO, or SEO, one thing hasn’t changed: visibility is everything. In today’s world of AI search, it’s not just about being found, it’s about being selected. And that starts with content.

…traditional SEO fundamentals still matter.”

AI Search Optimization = SEO

Google and Bing have incorporated AI into traditional search for about a decade. AI Search ranking is not new. So it should not be surprising that SEO best practices align with ranking for AI answers. The same considerations also parallel with considerations about users and how they interact with content.

Many SEOs are still stuck in the decades-old keyword optimization paradigm and maybe for them these methods of disambiguation and precision are new to them. So perhaps it’s a good thing that the broader SEO industry catches up with many of these concepts for optimizing content and to recognize that there is no AEO/GEO, it’s still just SEO.

Featured Image by Shutterstock/Roman Samborskyi

https://www.searchenginejournal.com/review-of-aeo-geo-tactics-leads-to-a-surprising-seo-insight/558796/


Raptive Drops Traffic Requirement By 75% To 25,000 Views via @sejournal, @MattGSouthern

Raptive lowered its minimum traffic requirement to 25,000 monthly pageviews from 100,000.

The ad network announced the new threshold represents a 75% reduction from the previous standard.

Raptive retired its Rise pilot program and consolidated all entry-level publishers into its Insider tier.

What Changed At Raptive

Sites generating between 25,000 and 99,999 monthly pageviews can now apply. These publishers need at least 50% of traffic from the United States, United Kingdom, Canada, Australia, or New Zealand.

Sites with 100,000 or more pageviews need only 40% traffic from those markets.

Raptive’s announcement stated:

“We’re living in a moment where AI drives inflated pageviews for low-quality websites and where algorithms can shift a site’s pageviews overnight. What truly matters—more than ever—is original, high-quality content that audiences trust.”

The Rise program launched in 2024 for sites between 50,000 and 100,000 monthly pageviews. That tier is being eliminated.

Current Insider-level publishers can now add additional sites once they reach 25,000 monthly pageviews.

Referral Program Expansion

Raptive expanded its referral program through January 31.

Publishers receive $1,000 when referring creators with sites generating 100,000 or more monthly pageviews.

For sites between 25,000 and 100,000 pageviews, the referral bonus is $250 during the limited promotion period.

Access Widening At Some Networks

Other networks have adjusted entry requirements in recent years, though changes vary.

Mediavine launched Journey in March 2024 for sites starting around 10,000 sessions. Ezoic removed pageview minimums for its Access Now monetization program. SHE Media lists an entry point around 20,000 pageviews.

These moves don’t necessarily represent an industry-wide pattern but show expanded options for smaller publishers at select networks.

Why This Matters

If you’re managing a site between 25,000 and 100,000 monthly pageviews with strong tier-one traffic, you now have access to Raptive’s managed monetization. You’ll still need to meet quality standards around original content, proper analytics setup, and advertiser compatibility.

The lower threshold acknowledges that traffic volatility from algorithm changes has made consistent pageview growth less predictable.

Looking Ahead

The new 25,000 pageview minimum takes effect immediately for new applications. Raptive continues requiring original content and proper site setup alongside the reduced traffic threshold.

Other networks may adjust their requirements as traffic patterns continue shifting, but each provider sets criteria independently.


Featured Image: Song_about_summer/Shutterstock

https://www.searchenginejournal.com/raptive-drops-traffic-requirement-by-75-to-25000-views/558780/


17 Data Reports That Every SEO Should Be Tracking in 2026 via @sejournal, @MattGSouthern

SEO and marketing are driven by the choices that you make, and those choices should be guided by clear, trustworthy data.

Having a range of sources that you track on a regular basis helps you to stay informed and to speak with authority in meetings with C-suite and clients.

Enable your strategies with real-world insights and answer questions such as, Should paid search budgets go up or down? Which international markets are worth expanding into? And how is traffic shifting towards social platforms or retail media networks? 

The following is a list of some well-known and some lesser-known reports that you should make yourself familiar with to always have qualified answers to your choices.

Financial & Markets Data

These high-level reports provide the map of the digital economy. They show where advertising dollars are flowing, where they are pooling, and where they might flow next.

They give you the “big picture” context for your own budget decisions, allowing you to speak the language of finance and justify your strategy with market-wide data.

IAB/PwC Internet Advertising Revenue Report

Cadence: Annual
Typical release: April
Access: Free, no registration required
Link

Why It Matters:

This report answers the question: Is the digital ad market still growing? For over 25 years, the IAB has been the definitive source for U.S. internet advertising revenue. Its historical data charted the shifts from dial-up to broadband, and then from desktop to mobile. Today, it’s charting the next great reallocation of capital. When your CFO wants authoritative numbers on the industry’s health, this is the gold standard.

The report surveys companies representing over 86% of U.S. internet ad revenue, meaning its figures are based on actual, verified spending. The format breakdowns show how much capital is flowing from established channels like traditional search into high-growth areas like social video, connected TV, and retail media.

Methodology & Limitations:

U.S.-only data; reflects reported revenue from participating companies, which may be delayed by one quarter compared to actual spending; excludes international markets and smaller ad networks below the survey threshold.

MAGNA Global Ad Forecast

Cadence: Biannual
Typical release: June & December
Access: Free summary; full datasets for IPG Mediabrands clients
Link

Why It Matters:

If the IAB report is a photograph of last year, MAGNA’s forecast is a detailed blueprint of the next 18 months. It helps you anticipate whether paid search costs (CPCs) are likely to spike based on an influx of advertiser demand. Their analysis is global, allowing you to see which regions are heating up and which are cooling down.

Their retail media breakouts are useful for making the case to invest in product feed optimization and marketplace SEO. For example, if MAGNA forecasts a 20% surge in retail media while projecting only 5% growth in search, it’s a signal that commercial intent is migrating.

The twice-yearly cadence is its secret weapon. The December update gives you fresh data for annual planning, while the June update allows for mid-year course corrections, making your strategy more agile.

Methodology & Limitations:

The forecast model relies on historical patterns, economic indicators, and advertiser surveys. It is subject to revision due to macroeconomic changes. Coverage varies globally, with the most robust data in North America and Europe, while forecasts for the China market carry higher uncertainty.

Global Entertainment & Media Outlook (PwC)

Cadence: Annual
Typical release: July
Access: Paid subscription; free overview and highlights
Link

Why It Matters:

This is your five-year planning guide, the ultimate tool for long-term strategic thinking.

While other reports focus on the next year, PwC projects revenue and user growth across 53 countries and 15+ media segments five years ahead. This macro view can help build a business case for large, multi-year investments.

Are you considering a major push into podcasting or developing a streaming video channel? This report’s audio and video forecasts can help you size the market and project a realistic timeline for ROI. Its search advertising forecasts by region can help you de-risk international expansion by prioritizing countries with high-growth projections.

The methodology takes into account regulatory changes, technology adoption curves, and demographic shifts. It can help you build strategies that are resilient to short-term fluctuations because they’re aligned with long-term trends.

Methodology & Limitations:

Full access is paid and limits how broadly information can be shared. Keep in mind, forecasts about the next five years are naturally uncertain and get updated every year. Also, these projections assume that regulatory environments stay stable, but changes can always happen.

Company Earnings Reports

While market reports offer an overview of the economy, the quarterly earnings from key companies reveal the reality of the platforms that are integral to the industry.

Financial data exposes the strategic priorities and weaknesses of search platforms, which can offer insights into where they might make significant changes.

Alphabet Quarterly Earnings

Cadence: Quarterly (fiscal year ends December 31)
Typical release: Q1 (late Apr), Q2 (late Jul), Q3 (late Oct), Q4 (late Jan/early Feb)
Access: Free
Link

Why It Matters:

This is the single most important quarterly report for anyone in search.

The key metric is revenue for the “Google Search & other” segment; its growth rate tells you if the core business is healthy, plateauing, or declining. Compare this to the growth rate of “YouTube ads” to see where user attention and ad dollars are shifting.

A secondary indicator to watch is “Google Cloud” revenue. As it grows, expect more integrations between Google’s enterprise tools and its core search products.

Pay close attention to Traffic Acquisition Costs (TAC), which includes the billions Google pays partners like Apple and Samsung to be the default search engine. If TAC is growing faster than Search revenue, it’s a major red flag that Google is paying more for traffic that is becoming less profitable.

In the current environment, the most critical part of the report is the management commentary and the analyst Q&A. Look for specific language about AI Overviews’ impact on query volume, user satisfaction, and any hint of revenue cannibalization.

Methodology & Limitations:

The “Google Search & other” bundles search with Maps, Gmail, and other properties, which prevents isolated analysis of search revenue. AI Overviews metrics are disclosed selectively and not on a comprehensive quarterly basis. Geographic revenue breakdowns are limited to broad regions.

Microsoft Quarterly Earnings

Cadence: Quarterly (fiscal year ends June 30)
Typical release: Q1 (Oct), Q2 (Jan), Q3 (Apr), Q4 (Jul)
Access: Free
Link

Why It Matters:

Microsoft’s report provides a direct scorecard for Bing’s performance via its “search and news advertising revenue” figures. This tells you whether the search engine is gaining or losing ground. Their integration of OpenAI’s models into Bing has made this a number to watch.

However, the bigger story often lies in their Intelligent Cloud and Productivity segments. Pay attention to commentary on the growth of Microsoft 365 Copilot and enterprise search features within Teams and SharePoint. This reveals how millions of professionals are finding information and getting answers without opening a traditional web browser.

Methodology & Limitations:

Search revenue is only reported as a percentage growth, not in actual dollar amounts, which makes market share calculations more complex. Details about enterprise search usage metrics are rarely shared openly. Geographic breakdowns are also limited. To estimate Bing’s market share, we need to infer from revenue growth compared to traffic data.

Amazon Quarterly Results

Cadence: Quarterly
Typical release: Q1 (late Apr), Q2 (late Jul), Q3 (late Oct), Q4 (late Jan/early Feb)
Access: Free
Link

Why It Matters:

This report tells you how much commercial search is shifting from Google to Amazon.

For years, Amazon’s advertising business has grown faster than its renowned AWS cloud unit. That’s an indicator of where brands are investing to capture customers at the point of purchase. The year-over-year ad revenue growth rate can help with justifying investment in Amazon SEO and enhanced content.

Look beyond the ad revenue to their commentary on logistics. When they discuss the expansion of their same-day delivery network, they are talking about widening their competitive moat against all other ecommerce and search players. A Prime member who can get a product in four hours has little incentive to start their product search on Google.

Also, look for the percentage of units sold by third-party sellers (typically 60-62%) to quantify the scale of the opportunity for brands on their marketplace.

Methodology & Limitations:

Advertising revenue is not separated by format (such as sponsored products, display, or video), and there is no disclosure of revenue by product category. International advertising revenue breakdowns are limited, and delivery network metrics are provided only selectively.

Apple Quarterly Results

Cadence: Quarterly
Typical release: Q1 (late Jan/early Feb), Q2 (late Apr/early May), Q3 (late Jul/early Aug), Q4 (late Oct/early Nov)
Access: Free
Link

Why It Matters:

Apple’s report is a barometer for the health of the mobile ecosystem and the impact of privacy. The key number is “Services” revenue, which includes the App Store, Apple Pay, and their burgeoning advertising business. When this number accelerates, expect more aggressive App Store features and search ads that can siphon traffic and clicks away from the mobile web.

Apple’s management commentary on privacy can have meaningful consequences for the digital marketing industry. Look for any hints about upcoming privacy features that could further limit tracking and attribution in search. Prior announcements around features like App Tracking Transparency on earnings calls gave marketers several months to prepare for the attribution shifts.

Snap Quarterly Results

Cadence: Quarterly
Typical release: Q1 (late Apr), Q2 (late Jul), Q3 (late Oct), Q4 (late Jan/early Feb)
Access: Free
Link

Why It Matters:

Snap’s daily active user growth and engagement patterns tell you where Gen Z discovers information. When DAU growth accelerates in markets where your organic search traffic is flat, younger audiences may not be using traditional search in those regions.

Snap reports specific metrics on AR lens usage. These metrics show you how users interact with visual and augmented reality content, previewing how visual search might evolve.

Methodology & Limitations:

Geographic breakdowns are limited to broad regions. Engagement metrics emphasize time spent rather than search or discovery behavior specifically. Revenue per user varies significantly by region, making it difficult to draw global conclusions. The data mainly reflects Gen Z behavior, not wider demographics.

Pinterest Quarterly Results

Cadence: Quarterly
Typical release: Q1 (late Apr/early May), Q2 (late Jul/early Aug), Q3 (late Oct/early Nov), Q4 (late Jan/early Feb)
Access: Free
Link

Why It Matters:

Pinterest’s monthly active user (MAU) growth shows you which markets embrace visual discovery. Their MAU growth rates by region reveal geographic patterns in visual search adoption, often previewing trends that influence how people search everywhere.

Their average revenue per user by region indicates where visual commerce drives revenue compared to just browsing, helping you decide whether Pinterest optimization deserves resources for your business.

Methodology & Limitations:

MAU counts only authenticated users, excluding logged-out traffic. ARPU includes all revenue types, not just search or discovery-related income. There is limited disclosure regarding search query volume or conversion behavior.

Internet Usage & Infrastructure

While earnings reports reveal the financial outcomes, they are lagging indicators of a more fundamental resource: human attention.

The following reports measure the underlying user behavior that drives these financial results, offering insight into audience attention and interaction.

Digital 2025 – Global Overview (We Are Social & Meltwater)

Cadence: Annual
Typical release: February
Access: Free with registration
Link

Why It Matters:

This report settles internal debates about platform usage with definitive, global data. It provides country-by-country breakdowns of everything from social media penetration and time spent on platforms to the most-visited websites and most-used search queries. It’s a reality check against media hype.

The platform adoption curves reveal which social networks are gaining momentum and which are stagnating. The data on time spent in social apps versus time on the “open web” is worth watching, as it provides some explanation for why website engagement metrics may be declining.

Methodology & Limitations:

Data is compiled from a variety of sources that use different methods. Some countries have smaller sample sizes, and certain metrics come from self-reported surveys. Generally, developed markets enjoy higher data quality compared to emerging markets. Additionally, how platform usage is defined can differ depending on the source.

Measuring Digital Development (ITU)

Cadence: Annual
Typical release: November
Access: Free
Link

Why It Matters:

The ITU, a specialized agency of the United Nations, provides the data for sizing total addressable markets for international SEO.

Its connectivity metrics show which countries have the infrastructure to support video-heavy or interactive content strategies, versus emerging markets where mobile-first, lightweight content is still essential.

The most actionable metric for spotting future growth is “broadband affordability.” History shows that when the cost of a basic internet plan in a developing country drops below the 2% threshold of its average monthly income, that market is poised for growth.

Methodology & Limitations:

Government-reported data quality differs across countries, with some nations providing infrequent or incomplete reports. Affordability calculations rely on national averages that might not account for regional differences. Additionally, infrastructure metrics often lag behind actual deployment by one to two years.

Global Internet Phenomena

Cadence: Annual
Typical release: March-April
Access: Free with registration
Link

Why It Matters:

This report helps you understand what people are actually doing online by tracking which applications consume the most internet bandwidth. Its findings are often staggering. In nearly every market analyzed, video streaming is the number one consumer of bandwidth, often accounting for over 50-60% of all traffic.

This provides proof that optimizing for video is no longer a niche strategy; it’s the main way people consume information and entertainment. The application rankings show whether YouTube or TikTok is the dominant force in your target markets, revealing which platform deserves the lion’s share of your video optimization priority.

This data provides the “why” behind other trends, such as the explosive growth of YouTube’s ad revenue seen in Alphabet’s earnings.

Methodology & Limitations:

Based on ISP-level traffic data from Sandvine’s partner networks, coverage varies by region, with the strongest data in North America and Europe. Mobile and fixed broadband breakdowns are not always comparable. The data excludes encrypted traffic that can’t be categorized. Sampling includes large ISPs but does not cover the entire market.

Privacy & Policy

Knowing where your audience is operating is only part of the challenge; understanding the rules of engagement is equally important. As privacy regulations and policies evolve, they set new guidelines for digital marketing, fundamentally altering how we target and measure audiences.

Data Privacy Benchmark Study (Cisco)

Cadence: Annual
Typical release: January
Access: Free with registration
Link

Why It Matters:

This report helps turn the idea of privacy into business results that everyone can understand. It highlights how good privacy practices can positively influence sales, customer loyalty, and brand reputation.

Whenever you’re making a case for investing in responsible data handling or privacy-focused technologies, this report offers valuable ROI insights. It reveals how many consumers might turn away from a brand if privacy isn’t clear, giving you strong support to promote user-friendly policies that also boost profits.

Methodology & Limitations:

The survey methodology relies on self-reported data.  Respondents mainly come from large enterprises. The geographic focus is on developed markets. ROI figures are based on correlation rather than establishing causation. Privacy maturity levels are self-assessed by respondents rather than independently verified.

Ads Safety Report (Google)

Cadence: Annual
Typical release: March
Access: Free
Link

Why It Matters:

Google’s enforcement data provides a glimpse into what may soon impact organic search results. Often, policies first appear in Google Ads before making their way into search quality guidelines. Violations by publishers show which types of sites might get banned from AdSense, sometimes acting as a warning sign for future manual actions in organic search.

When enforcement becomes more active in fields like crypto, healthcare, or financial services, it usually indicates that stricter E-E-A-T standards are on their way for organic results. Google’s actions to block ads due to misrepresentation or coordinated deceptive behavior are sometimes followed by similar issues in organic results.

Methodology & Limitations:

Google-reported data shows enforcement priorities, not industry violation rates. Detection methods, thresholds, and policies lack transparency and are not fully disclosed. Enforcement patterns are unclear, with no independent verification of metrics.

Media Use & Trust

Digital News Report (Reuters Institute)

Cadence: Annual
Typical release: June
Access: Free
Link

Why It Matters:

The Reuters Institute report explores how content discovery differs across countries and demographics. The analysis of over 40 nations details the ways people find information, whether directly, through search, social media, or aggregators.

A key insight is the concept of “side-door” traffic, referring to visitors who arrive via social feeds, mobile alerts, or aggregator apps, rather than visiting a homepage or using traditional search. In most developed nations, this type of traffic now makes up the majority, even for leading publishers.

This highlights the need for a distributed content strategy, emphasizing that your brand and expertise should be discoverable in many channels beyond Google.

Methodology & Limitations:

Survey-based methodology with ~2,000 online respondents per country, excluding offline or low-connectivity users, and overrepresents developed markets. Self-reported news habits may differ from actual behaviors, and the definition of “news” varies by culture and person.

Edelman Trust Barometer

Cadence: Annual
Typical release: January
Access: Free
Link

Why It Matters:

In today’s world of AI-generated content and widespread misinformation, trust is more important than ever. Edelman has been tracking public trust in four key institutions – Business, Government, Media, and NGOs – for over 20 years. Their findings offer a helpful guide for establishing your content’s authority.

When the data shows that “Business” is trusted more than “Media” in a particular country, it suggests that thought leadership from your company’s own qualified experts can be more believable and relatable than just quoting traditional news outlets.

The differences across generations and regions are especially useful to understand. They reveal which types of authority signals and credentials matter most for different audiences, giving you a clear, data-driven way to build E-E-A-T.

Methodology & Limitations:

Survey sample favors educated, high-income populations in most countries, with 1,000-1,500 respondents per nation. Trust is a self-reported perception, not behavioral; country choice focuses on larger economies. Trust in institutions may not reflect trust in brands or sources.

Digital Media Trends (Deloitte Insights)

Cadence: Annual
Typical release: April
Access: Free executive summary
Link

Why It Matters:

Deloitte monitors streaming service adoption, content consumption trends, and attention fragmentation, all of which influence your content strategy. Their research on subscription usage and churn rates shows how users distribute their entertainment budgets.

Their insights into ad-supported versus subscription preferences indicate which business models resonate with different demographics and content types. Data on cord-cutting and cord-never behaviors illustrate how various generations consume media.

Their analysis of social media patterns reveals declining platform popularity, providing early signals to diversify channels.

Methodology & Limitations:

This U.S.-focused study mainly involves higher-income digital adopters, with streaming behavior centered on entertainment, which may not reflect overall information habits. The sample size of 2,000-3,000 limits detailed demographics, and trends may lag six to 12 months behind mainstream adoption.

How To Use These Reports

Use this set of reports to connect market trends and signals with your search and content decisions.

Start with quarterly earnings and ad forecasts to calibrate budgets after core updates or seasonal swings. When planning campaigns, check platform adoption and discovery trends to decide where your audience is shifting and how they’re finding information.

For content format choices, compare attention and creative studies with what’s working in Search, YouTube, and short-form video to guide what you produce next.

Review earnings and forecasts each quarter when you set goals. Scan broader landscape studies when you refresh your annual plan. When something changes fast, cross-check at least two independent sources before you move resources. Look for consistency in your data and don’t act on one-off spikes.

Looking Ahead

The best SEO and marketing strategies are built on more than instinct; they’re grounded in data that stands up to scrutiny. By making these reports part of your regular reading cycle, you have a basis to make solid decisions that you can justify.

Each dataset offers a different lens that allows you to see both the macro trends shaping the industry and the micro signals to guide your next move.

The marketers who know where to find the right data and information are the ones who can be strategic and not reactionary.

More Resources:


Featured Image: Roman Samborskyi/Shutterstock

https://www.searchenginejournal.com/17-data-reports-that-every-seo-should-be-tracking-in-2026/558097/





3 LinkedIn Strategies To Turn Your Founder’s Voice Into A Pipeline Driver via @sejournal, @purnavirji

Your founder’s voice is your startup’s most valuable – and often most underleveraged – asset. I see this so often with startup leaders. They either avoid posting on LinkedIn (my employer) entirely or default to product features and sales pitches.

That results in the all-too-familiar rotation of hot takes, motivational quotes, and business updates that rarely spark real engagement.

There’s a difference between broadcasting and building relationships. The leaders who build true influence understand that. They build connection, trust, awareness, and pipeline by sharing lessons, stories, and insights that only they can offer. And build consistent formats for sharing their expertise to make it stick.

But should a founder’s way-too-packed schedule also include content creation? Let me help you answer that by asking you another question: When I mention Melanie Perkins, Rand Fishkin, and Marc Benioff, which companies come to mind?

You likely thought Canva, SparkToro, and Salesforce, right? That connection between founder and company is strategic. And a real growth driver.

This shift toward founder-led growth has caught the attention of major companies. PayPal’s job opening for Head of CEO content went viral on LinkedIn. Since then, Virio recently posted a Head of Content role paying $500,000 to $1.5 million annually. OpenAI posted a Content Strategist role paying $310,000 to $393,000 annually. Perplexity posted roles for Content Managers at $130,000 to $170,000 a year. These are strategic investments in executive voice as a growth lever.

According to LinkedIn’s new Founder-Led Sales and Marketing Playbook (which I co-authored), startups whose founders post consistently see 33% more leads, up to 3.7x higher deal sizes when prospects follow executives, and 22% faster deal velocity when buyers feel they “know” the founder.

So, how do time-pressed founders create content that drives revenue? Here are three strategies to turn your founder voice into trust, pipeline, and tangible revenue:

1. Lead With Perspective, Not Product

Most founder content reads like a brochure: “We help X do Y!”. While it’s tempting to go straight for the sale, people tend to scroll right past sales pitches. The less you talk about your product, the more people want to buy it.

As Gal Aga, CEO of Aligned, explains in the playbook:

“First, [people] listen to you, they feel like they’re deeply connected, they love the ideas you put out, they trust you, and then they have to check out what you do”.

People buy from people they trust, and the fastest way to build trust is through storytelling. Scott Albro, founder of Goldie, recommends three powerful story types that build trust.

  • Customer Priority Stories position you as someone who understands the market rather than someone selling to it. Instead of “Our AI optimizes workflows,” try “Today, I met with seven independent pizza shop owners in Brooklyn. Their top issue? Managing order flow during peak hours, usually from 6 to 9 p.m…” You’re demonstrating market insight, not making a sales pitch.
  • Transformational Shift Stories help people navigate change. “Right now, most pizza shop owners are upgrading their POS to better time pickups and deliveries. In the future, there’s an opportunity for AI to predict orders before they even arrive…” You’re painting a picture of industry evolution without positioning your product as the solution.
  • Personal Journey Stories build credibility through vulnerability. “After college, I opened a pizza shop. I managed everything with paper and pen. I didn’t know the first thing about restaurants or technology, but I knew I wanted to make great pizza and support pizza makers…”

Don’t shy away from sharing mistakes or moments of vulnerability – these are often the posts that create an emotional connection and make the founder memorable.

2. Turn Your Daily Interactions Into Content Gold

Your calendar is a content buffet. Every customer call, demo, and “aha” moment is a story waiting to be told. The challenge is to spot the content hiding in your day-to-day interactions.

As Alec Paul, founder of SalesBrand, puts it:

“Treat your life like content. Be more like a journalist. You’re talking to customers every day. You’re the most connected to the pains that you’re solving. No one should know this stuff more than you”.

Try this: After each customer call, ask yourself three questions:

  • What surprised me? (That’s your contrarian take.)
  • What bothered me? (That’s your polarizing hook.)
  • What lesson would save others pain? (That’s your high-resonance post.)

Now transform these insights into specific content formats that resonate.

  • Op-Eds let you take a stance based on what you’re seeing. “We almost didn’t launch our analytics feature because early users said it was too complex. Here’s the data that changed our minds.” You’re sharing your decision-making process, not just the final decision.
  • Behind-The-Scenes Features reveal the “why” behind major choices. “I promoted the wrong person. Here’s what happened and how we recovered.” This builds trust through transparency rather than perfection.
  • Customer Interviews: Turn a direct customer quote into a hook. Example: “‘Your product is too expensive.’ What they really meant was…”  You’re addressing common concerns while demonstrating market understanding.

Don’t wait for inspiration. Build a habit of jotting down insights as they happen. Over time, you’ll have a content bank that’s uniquely yours—no one else can replicate it.

3. Pack A Punch With Each Post

Now that you’re spotting stories, let’s make sure they land. Which also leads me to the section on questions I get the most often as a LinkedIn employee: What content and creative tends to work the best on the platform? Here’s what I advise for founder-led growth and executive thought leadership:

Start With Hooks That Stop Scrollers

Your hook is your headline. If it doesn’t make someone pause, the rest doesn’t matter. Gal Aga rewrites posts that don’t get traction in the first 15-30 minutes – his benchmark is one to two likes per minute.

Most people post what’s obvious. Obvious is forgettable; specific is magnetic. Instead of “AI is changing everything,” try “AI is exposing measurement vulnerabilities that always existed.” The second version creates curiosity about what those vulnerabilities might be.

Embrace Depth Over Brevity

LinkedIn data shows posts between 400-800 words generate nearly three times more engagement than those under 50 words.

As Gal notes:

“Short ‘influencer style’ ideas are nice. But for me, the real impact comes from giving people deep advice. Something they can present at a sales kick-off, a playbook, a strategy, a research breakdown, etc.”

Don’t be afraid to go deep if you’re solving real problems. Your audience will thank you for it.

Use Video To Scale Credibility

Video is the fastest-growing language of trust in B2B.

Rand Fishkin, who was early to video in B2B, explains:

“When I first started experimenting with video as a B2B content format back in 2007, I noticed a strange thing: the number of viewers was far lower than our usual blog readers, but the level of engagement, memory, and brand association was WAY higher.”

LinkedIn’s data supports this approach:

  • Video creation is growing 2x faster than any other format.
  • 98% of Fortune 500 CEOs who use social media choose LinkedIn as their primary platform.
  • 63% of B2B buyers say video content helps inform their buying decisions.

Rand’s advice is to not overthink it.

“My full video creation process is incredibly easy, and takes me less time than writing a blog post – as little as 10 minutes to film, upload, and publish a two- to five-minute piece.”

Find Your “Prolific Zone”

This is the narrow band between “obvious” and “outrageous” where your content is authentic, polarizing, and painfully relevant.

Two approaches to try:

  • Challenge conventional wisdom: “Always be closing is dead. Here’s how we 3x’d revenue by firing our SDR team.”
  • Share taboo truths: “Why we let 80% of customers churn…on purpose.”

Track the pushback. If <10% of comments are negative, you’re playing it too safe. If >30%, you’ve gone too far. Somewhere in the middle means you’re onto something.

Work With The Algorithm

Drive the engagement you want by putting the “social” back in social media.

  • Tag people thoughtfully.
  • Ask meaningful questions to boost engagement.
  • Reply to comments, especially in the first few hours.
  • Post 3x a week, ideally between 8 a.m. and 10 a.m. in your audience’s time zone (generally speaking).

Before You Hit Publish, Use The Punch Test

  • Does this make someone feel something? (Emotion).
  • Does this make someone think differently? (Insight).
  • Does this make someone want to respond or share? (Action).

If the answer is yes to at least two, you’re good to go.

The Compound Effect Of Consistency

LinkedIn’s data tells a clear story: Startups whose directors post at least nine times a year see 3x more engagement and 4x more new followers than those who post only once. Trust is built over time, and a high-impact founder brand takes months to grow.

Sendoso saw an 11% higher win rate when prospects were exposed to LinkedIn posts from Director+ executives, and 120% higher closed-won deal sizes when prospects followed Director+ executives on LinkedIn.

These are clear signals. When Gal Aga says, “If 20%+ of your pipeline mentions your content, you’ve won,” he’s talking about attribution you can measure.

Your Move

The market doesn’t need another polished corporate account. It needs real humans solving real problems. That’s you. Every founder has a story – the ones who tell it well build companies, and movements.

Your competitors are either avoiding this entirely or outsourcing their voice to expensive content teams. That creates an opening. While they’re hiring $500,000 content strategists, you can build authentic influence by sharing what only you know.

Start with one post this week. Share a lesson from your last customer call. Take a stance on an industry trend you disagree with. Show the human side of a business decision.

Your expertise is already there. Your audience is waiting. The founders who act now will own the narrative tomorrow.

All data, quotes, and examples cited above without a source link are taken from the “Founder-Led Sales and Marketing Never Ends” playbook.

More Resources:


Featured Image: Master1305/Shutterstock

https://www.searchenginejournal.com/3-linkedin-strategies-to-turn-your-founders-voice-into-a-pipeline-driver/557898/


Mullenweg Talks About Commercially Motivating WordPress Companies via @sejournal, @martinibuster

At the recent WordCamp Canada, WordPress co-founder Matt Mullenweg answered a question about how individuals and agencies could support the WordPress ecosystem against “bad actors” who don’t share the same community values. The question gave Mullenweg the opportunity to portray himself as the victim of a court that’s muzzling his free speech and to encourage the WordPress community to vote with their pocketbooks.

Question About Protecting WordPress Against Bad Actors

The person asking the question had two things on their mind:

1. How can individuals and agencies help protect WordPress’s community values from exploitative or profit-driven actors?

2. Should there be a formal certification system to identify and promote ethical contributors and agencies within the ecosystem?

The question asked reinforced that the WordPress community is divided into two sides, with those who stand with Mullenweg in his dispute with WP Engine and those on the other side who disapprove of the drama.

This is the question that was asked:

“WordPress has always thrived because of its open, community-driven ethos, but as the ecosystem grows, we’re seeing more like large, profit-driven players who don’t necessarily share the values. How can individual contributors and agencies like ours actively help protect WordPress and uphold the values and ethics that have sustained it from bad actors and people who might try to exploit the community.

And do you see room for something more formal, like a certification for individuals and agencies that define what being a good actor is to help educate clients and even the market to help kind of protect in a more proactive way from those sorts of bad actors?”

The question paints assumes a polarization in the WordPress community, with the exploitative profit-seeking bad actors on one side and the ethical WordPress supporters on the other.

No Bad Actors

Matt Mullenweg began his answer by stating that he’s not one to call anyone a bad actor.

He answered:

“So first, I’ll say, I don’t want to say that there’s bad actors. I think there might be bad actions sometimes and just temporarily bad actors who hopefully will be good in the future. So, you know, every saint has a past, every sinner has a future. So I never want to define like any company or any person is like permanently good or bad. Let’s talk about actions. “

Is This You?

It was a strange way to begin his answer because he used the phrase “bad actors” in his at last years WordCamp USA that called out WP Engine:

“I think that we also just need to call out bad actors. And you got to, the only way to fight a bully is to fight them back. If you just allow them to run rampant on the playground, they’re just going to keep terrorizing everyone.”

He followed that speech with a blog post where he went further and called WP Engine a “cancer to WordPress.”

You can hear it at the 33:48 minute mark of the recording from last year’s WordCamp

[embedded content]

Motivating Good Behavior

Mullenweg continued his answer by discussing ways to motivate companies to give back to the WordPress community while also enforcing the GPL and protecting the WordPress trademark. Lastly, he encouraged the WordPress community to vote with their wallets by spending money on companies that that are defined as “good” and giving less to businesses who are presumably defined as a bad actors.

He continued:

“So second, I think with these actions, we can start to create incentive systems. And it’s part of what we’re doing with Five for the Future, which is basically saying you contribute back, which also implies that you’re not violating the GPL or something like that.

So we’ve got the hard stuff, like if you violate the GPL, you’re gonna get a letter, violate the trademark, that is more of a legal thing, but also the gentle stuff, like how can we encourage a good behavior by giving people higher rankings in the directory or in the showcase, for example, then finally, I’ll just say vote with your wallet.”

At this point he continued with the topic of motivating companies to do the right thing and drifted off into talking about WP Engine without actually naming WP Engine.

Mullenweg continued:

“So each one of you here has the ability to strongly influence these companies. By the way, if they’re commercially motivated, great. Let’s commercially motivate them to do the right thing by giving more business to the good companies and less business to the other companies.

This has actually been happening a lot the past year. I think I can say this. There’s a site called WordPressEngineTracker.com, which is currently tracking a number of sites that have left a certain host. It’s about to crash 100,000, about to cross 100,000, that have switched to other hosts, and over 74,000 have gone offline since September of last year.

We actually used to make all this data public. It was all the whole list was on there. They got a court order, so that way the data could be fact-checked by press or other people. There was actually a court order that made us take that down. So again, trying to muzzle free speech and transparency. But we’re allowed to keep that site up, so check it out while you can.”

Mullenweg’s comments frame spending choices as a form of moral expression within the WordPress ecosystem. By urging the community to “commercially motivate” companies, he encourages consumer spending as a way of enforcing ethical accountability, implicitly targeting WP Engine and unnamed others that fall short.

He positioned himself as the victim whose free speech is muzzled, but the court order simply required him and Automattic to stop sharing a spreadsheet of WP Engine’s customers. He also framed the whole dispute as one about ethics and morals, invoking the religious imagery of sinners and saints. WordPress is both a business and a community, but it’s not a religion. So it’s somewhat odd that those connections were made in the context of contributing money or time back into WordPress, which is a cultural obligation but not a legal (or religious) one.

Watch the Q & A here:

[embedded content]

https://www.searchenginejournal.com/mullenweg-talks-about-commercially-motivating-wordpress-companies/558694/


WPBakery WordPress Vulnerability Lets Attackers Inject Malicious Code via @sejournal, @martinibuster

An advisory was issued for the popular WPBakery plugin that’s bundled in thousands of WordPress themes. The vulnerability enables authenticated attackers to inject malicious scripts that execute when someone visits an affected page.

WPBakery Plugin

WPBakery is a drag-and-drop page builder plugin for WordPress that enables users to easily create custom layouts and websites without writing code. WPBakery is frequently bundled with premium themes. Theme developers license it so that they can bring the power of a drag and drop page builder functionality to their WordPress themes.

WPBakery Vulnerability

The WPBakery Page Builder WordPress plugin was discovered to have insufficient input sanitization and output escaping in it’s Custom JS module.

Insufficient input sanitization and output escaping are flaws that enable attackers to upload malicious code into a website and cause the affected site to output malicious code. In general, this can lead to vulnerabilities such as Cross-Site Scripting (XSS) and SQL Injection.

  • Input Sanitization filters uploaded user data before it is stored or processed by the plugin.
  • Output Escaping converts characters that have HTML meanings into safe output before it is displayed on a web page. This prevents executable code from outputting onto a live web page and affecting users.

This flaw enables attackers with contributor-level access or higher to inject arbitrary scripts to affected websites. The vulnerability affects WPBakery plugin versions up to and including version 8.6.1.

Users of the plugin are encouraged to update to the latest version of WPBakery, which is currently version 8.7.

Featured Image by Shutterstock/3d artwork wallpaper

https://www.searchenginejournal.com/wp-bakery-wordpress-vulnerability-2/558261/


Google Redesigns How Search Ads Are Labeled via @sejournal, @brookeosmundson

Google is rolling out a change to how ads appear in Search, and this time it’s focused on clarity and user control.

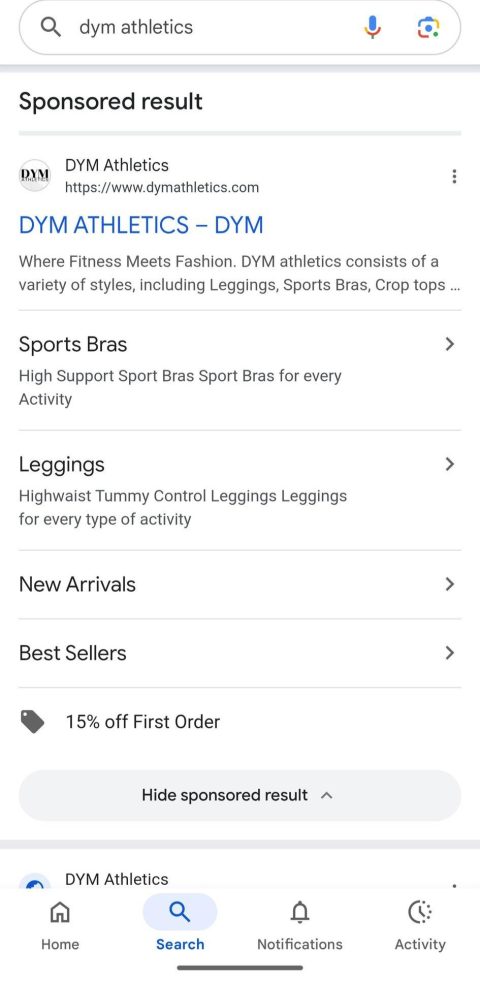
Text ads will now be grouped under a single “Sponsored results” label that stays visible as you scroll. In addition, a new “Hide sponsored results” option lets users collapse the entire ad block with one click.

This update doesn’t change how ads are served or ranked, but it does change how they’re presented to users. Even small interface updates can influence how people interact with search results, so advertisers should pay attention to how this evolves over time.

A Look at the New Sponsored Label on Google Search

Previously, each text ad showed a small “Sponsored” label at the top of each ad.

Now, Google is grouping all text ads together with a single header that clearly signals where the sponsored section begins and ends. That label remains visible even if the user scrolls down the page.

While doing a Search in the wild, the new format appeared, even with just one ad:

New 'Sponsored Result' layout on Google Ads search result.Screenshot taken by author

Google is also extending this approach to other formats. For example, Shopping placements will use a “Sponsored products” label.

On results that include AI Overviews, the sponsored section can appear above or below the AI-generated content, but it will still follow the same grouping and labeling format.

The most noticeable addition is the ability to collapse all sponsored results. Not every user will hide the section, but the option itself introduces a new behavior that didn’t exist before.

Google noted that these updates are rolling out globally to users on both desktop and mobile

Why This Matters to Advertisers

From a performance perspective, the underlying mechanics are unchanged. Bidding, Quality Score, ranking, and the maximum number of ads (up to four in a block) all remain the same.

That said, grouping ads together can influence how users perceive them.

When ads are visually separated from organic listings, the difference between the two becomes more intentional.

Users who skim results may pause and decide whether to interact with the sponsored block at all. For lower-intent searches, this could result in fewer casual clicks. For higher-intent queries, the impact may be minimal.

This puts more pressure on the quality of the ad itself. Clear value propositions, relevant messaging, and strong alignment with search intent will matter even more.

Ranking at the top will still be valuable, but visibility alone won’t guarantee engagement if users are more aware of what they’re clicking.

While the update is primarily visual, advertisers should keep an eye on performance once it fully rolls out across mobile and desktop. A few areas to watch include:

  • Changes in CTR or Impression-to-Click patterns
  • Differences in engagement based on query intent
  • Any vertical-specific impact where users are more likely to hide ads

Early shifts may be small, but trends could emerge over time as users adjust to the new layout.

Why Did Google Make This Change?

Google notes that these changes were driven by user testing and feedback. The goal is to create a more consistent and transparent experience across all ad formats. It also reflects increasing expectations around clarity in search results as AI-generated content becomes more common.

By making it easier to recognize sponsored content, Google is signaling that paid placements can be both visible and trustworthy, as long as they’re clearly labeled.

This approach may help maintain long-term confidence in search results as the interface continues to evolve.

Moving Towards a More Transparent SERP

Google’s update reinforces a larger shift: how ads appear on the page is becoming just as important as where they appear.

The auction logic and placement limits remain the same, but the experience around ads is becoming more clearly defined for users.

As presentation evolves, it’s reasonable to expect user behavior to follow. Some people will ignore the change. Others may start to be more selective about when they engage with ads.

This puts more weight on relevance, clarity, and value in the message itself.

Advertisers don’t need to overhaul their campaign structure or bidding strategy because of this change. Instead, the focus should be on tightening creative quality, aligning closely with intent, and paying attention to early performance shifts.

Even if the impact is subtle at first, updates like this often lead to gradual behavior changes over time.

Search has always been a balance between visibility and trust. Advertisers who adapt early and continue to prioritize useful, high-quality messaging will be in the best position to maintain performance as the SERP continues to evolve.

https://www.searchenginejournal.com/google-redesigns-how-search-ads-are-labeled/558173/


Get Your Ad Campaigns Ready Before Black Friday via @sejournal, @brookeosmundson

For most PPC marketers, the weeks leading up to Black Friday aren’t just doing busy work. They’re loaded with decisions, deadlines, and last-minute requests.

If you’re managing Google Ads, Microsoft Ads, or any ad platform in between, this time of year can either be a strong finish or a missed opportunity.

The difference usually comes down to planning.

If you’re looking to approach Black Friday with a more structured and thoughtful strategy, keep reading. This article focuses on what you can control (like budgets, campaign builds, and feed readiness) and includes specific examples across platforms to help you avoid common pitfalls.

Let’s start with what to revisit from last year.

Take The Time To Audit Last Year’s Wins And Pitfalls

Before building anything new, it’s worth taking a closer look at last year’s performance.

The strategy here isn’t about copying old campaigns; it’s about understanding where they overdelivered, where they stalled out, and how the landscape might have changed since then.

In Google Ads, start with the attribution reports. Look beyond just last-click conversions and examine how various campaign types contributed throughout the funnel.

If Performance Max campaigns played more of an assist role, that should inform how you structure them this year.

If Standard Shopping capped out early or certain product categories were underrepresented, those are fixable issues.

You can also use auction insights to see when competitors ramped up spend, or whether you lost impression share due to budget or rank. These reports offer useful context if you’re planning to scale this year but didn’t last year.

If you’re using Microsoft Ads, review audience and device performance to see where volume shifted.

Holiday behavior isn’t always the same across platforms. What worked well on Google may not have translated to Bing or Meta, and vice versa.

The goal is to identify specific opportunities, not just assume last year’s playbook will hold up.

Build Early, Even If You’re Not Launching Yet

There’s value in building out your campaigns well in advance of Black Friday, even if you don’t plan to activate them until closer to the sale.

Whether you’re launching new campaigns or just updating ads in existing ones, getting ahead on structure gives you time to QA creative, troubleshoot disapprovals, and coordinate across teams.

If you’re planning to reuse existing campaigns, you can still stay organized using labels. For example:

  • Apply labels to new Responsive Search Ads (RSAs) that include holiday-specific copy or promotions.
  • Label sitelinks, callouts, or promo assets that reference Black Friday offers.
  • Tag ad groups or asset groups that are tied to limited-time sale messaging.

Using a clear naming convention makes it easier to filter, review, and schedule changes across campaigns without confusion.

If you want to automate this even further, you can create automated rules based on labels.

For example, you can set a rule to enable all ads with your Black Friday label at 12:01 a.m. on November 28. You can also set up rules to pause those same ads at the end of the promotion, reducing the chance that outdated messaging stays live.

You’d also want to create an automated rule to run to pause all non-Black Friday ads at the same time. This ensures that only your promo ads are running during Black Friday season.

If you end up creating Black Friday-specific campaigns, you can easily set start and end dates on them to ensure they only run during the allotted time.

While you don’t have complete scheduling control at the ad or asset level across platforms, you can use a combination of labels, automated rules, or campaign/ad group start and end dates. These give you enough flexibility to manage most scenarios without scrambling the morning of your launch.

If you’re running Meta Ads, be sure to upload your Black Friday creative and audience setups well in advance. Platforms are slower to review and approve ads during peak periods, and early delivery data will help the algorithm optimize once you start increasing budgets.

Give Smart Bidding Better Direction

Most advertisers are using some sort of Smart Bidding for their campaigns, especially around Black Friday. That doesn’t mean you should take a hands-off approach, though.

If you’re using Google Ads, consider seasonality adjustments if you’re planning for a short-term sale or expect a sudden fluctuation in conversion rates. These adjustments tell Google to expect better-than-usual performance during a specific window, and can help avoid underspending during flash sales.

Seasonality adjustments are currently available for these campaign types that use either a Target ROAS or Target CPA bid strategy:

  • Search.
  • Shopping.
  • Display.

If you’re using seasonality adjustments for conversion rates, then you can choose between these campaign types:

  • Search.
  • Display.
  • Shopping.
  • Performance Max.
  • App (in beta).

That said, they’re not suited for every situation. If you’re running a longer sale or have limited historical volume, the adjustment could cause more volatility than good.

For broader holiday performance, make sure your campaigns have enough data to support Smart Bidding decisions. Review the “Bid Strategy Report” and watch for signs of limited learning or constrained budgets.

Pushing into a critical promo window without stabilized bidding can lead to inefficient spend, especially with newer campaigns.

Check Your Product Feed Before It Becomes A Problem

It’s easy to focus on campaign settings and forget that your product feed is powering everything from standard Shopping campaigns to Performance Max. If it’s not accurate or timely, your best offers might not show up correctly.

In Google Merchant Center, navigate to the Diagnostics tab and resolve any disapprovals or mismatched pricing issues. These often spike around holidays when sale prices don’t sync correctly or out-of-stock products remain active.

Make sure your feed includes items like:

  • Up-to-date GTINs and product identifiers.
  • Attributes like ‘sale_price’ and ‘sale_price_effective_date’ for promotions.
  • High-quality images that meet platform guidelines.
  • Clear shipping and availability details.

If you’re running Performance Max campaigns, review the Listing Groups report to ensure your most valuable products are getting served. Many advertisers find that certain SKUs get minimal impressions due to budget spread or structural issues.

This is also a good time to upload holiday-themed creative assets, including lifestyle images and product videos. These can improve performance in placements like YouTube and Discover, which tend to ramp during PMax campaigns in Q4.

The more you control the feed and asset side, the less you have to worry about automation making subpar choices when competition is highest.

Expect Things To Break, And Plan Around That

Black Friday campaigns don’t always go according to plan.

Promo pages fail to update. Budgets cap out early. Tracking drops off mid-day. It’s worth thinking through what could go wrong now, while you still have time to build a backup plan.

Start with some of the basics in campaign planning:

  • Double-check conversion actions in Google Ads and Google Analytics 4. Make sure no duplicate events are being counted, and key actions like purchases, add-to-cart, and email sign-ups are being tracked.
  • Test final URLs on mobile and desktop. If you’re using promo pages, confirm they’re live and loading quickly. A slow checkout experience during Black Friday Cyber Monday (BFCM) will almost always tank performance.
  • Pre-schedule creative updates where possible. You don’t want to be manually swapping sitelinks or headlines in the middle of a surge.
  • Double-check your automated rules. If you’re using rules to enable sale ads and pausing evergreen ads, make sure to have the platform(s) email you with any changes so you can confirm with confidence the right ads are being shown at the right time.
  • Set up alerts for unusual activities. If campaigns showcase a sudden ROAS drop, zero conversions, or unusual spend, you’ll want to be alerted in real-time. Even something as simple as a budget cap hitting before 10 a.m. can throw off the day if it goes unnoticed.

The more you can troubleshoot before launch week, the fewer fires you’ll need to put out when things are moving fast.

Don’t Shut Down Campaigns The Minute Cyber Monday Ends

It’s common for brands to ramp hard through Cyber Monday, then pause everything until January. But, many shoppers are still active well into December, especially those looking for last-minute gifts or deals that weren’t available earlier.

Based on previous personal experience, Google Ads auction data may show that competition could dip after Cyber Monday and shopping intent doesn’t disappear. Conversion rates often stay steady through the first two weeks of December, particularly for brands with fast shipping or digital products.

Rather than winding down completely, consider updating your messaging to reflect the urgency. Swap out “Black Friday” language for “Still Time to Save” or “Guaranteed Delivery Before Christmas.” Countdown ads and shipping deadline assets work well here.

If you’re running remarketing campaigns, exclude recent purchasers and focus on users who visited key pages but didn’t convert. These audiences tend to convert at lower cost-per-acquisition (CPA) during post-Cyber sales, especially if you’ve got gift cards or bundled offers to promote.

December also gives you a chance to build audience pools for Q1. Visitors from BFCM campaigns can be remarketed to in January for loyalty or cross-sell efforts. Just make sure your campaign structure allows for clean audience segmentation.

Planning Ahead Is Still Your Best Defense

Black Friday doesn’t reward last-minute execution. It rewards structure, preparation, and proactive troubleshooting.

The platforms are going to do what they do. Smart Bidding will make the best decisions based on your inputs. Asset groups will mix and match in ways you can’t fully control.

But, what you can control, like budgets, tracking, and product feed health, still has a major impact on your campaign performance.

Getting your campaigns in order early gives you the breathing room to monitor performance, scale what’s working, and catch issues before they snowball.

And when something inevitably breaks or shifts unexpectedly, you’ll already have a plan in place.

More Resources:


Featured Image: Roman Samborskyi/Shutterstock

https://www.searchenginejournal.com/get-your-ad-campaigns-ready-before-black-friday/556374/