Domino’s Pizza Stock Drop Bestows Opportunity
Pizza delivery chain Domino’s Pizza (NYSE: DPZ) shares have recently fallen due to the benchmark indices selling off. Shares of the world’s largest pizza restaurant chain showed signs of reversion in its business as the pandemic tailwinds seem to have dissipated since the days of COVID lockdowns. Top line actually slipped (-1%) in its Q4 2021 earnings release. While international is driving sales momentum, its U.S. business suffered from staffing challenges in a tough labor market which was partially offset by higher delivery fees and menu price inflation. The Company opened over 1,200 new stores in 2021, which should continue to fuel growth in 2022. Prudent investors looking for exposure into the leader in pizza delivery can watch for opportunistic pullbacks in shares of Domino’s Pizza.
 Depositphotos.com contributor/Depositphotos.com – MarketBeat
 Q4 Fiscal 2021 Earnings Release
On March 1, 2022, Domino’s released its fourth-quarter fiscal 2021 results for the quarter ending December 2021. The Company reported an earnings-per-share (EPS) profit of $4.25 excluding non-recurring items versus consensus analyst estimates for a profit of $4.29, missing estimates by (-$0.04). Revenues fell (-1%) year-over-year (YoY) to $1.34 billion falling short of the $1.38 billion consensus analyst estimates. Same-store sales in the U.S. grew 1% in the quarter and 3.5% for 2021. International sale store sales grew 1.8% for Q4 2021 and 8% for fiscal 2021. The Company added 468 stores in the quarter and 1,204 total stores in fiscal 2021. Domino’s CEO Ritch Allison commented, “”When we compare our 2021 results back to pre-pandemic 2019, the Domino’s brand grew by nearly $3.5 billion in global retail sales over the last two years. Looking forward, we remain focused on leading with innovation and leveraging our global scale to drive outstanding returns for our franchisees and shareholders.”
Conference Call Takeaways
CEO Allison welcomed the new CEO Russell Weiner as of May 1, 2022. Mr. Weiner is currently the COO of Domino’s since 2008. CEO Allison is expected to retire on July 15, 2022. CEO Allison proceeded to highlight 2021 milestones including the $17.8 billion in global sales for 2021, up 11.7% over 2020 which had an impressive 10.4% growth. The Domino’s brand grew by $3.5 billion, which was the size of its entire U.S. sales in the past decade, pre-pandemic in two years. CEO Allison didn’t really address the elephant in the room, the drop in U.S. sales and profit momentum. CFO Jessica Parrish provided more insight into the 2022 guidance and impacted charges, “We currently project that the store food basket within our U.S. system will be up 8% to 10% as compared to 2021 levels. We previously told you that we estimated that changes in foreign currency exchange rates could have a $4 million to $8 million negative impact on royalty revenues in 2022 as compared to 2021. Based on the current outlook, we now estimate that this could be an $8 million to $12 million negative impact. We expect that we may continue to see volatility in this outlook as there are many uncontrollable factors that drive the underlying exchange rates.” She did point out the 112 consecutive quarter of positive international comps indicating that international growth was still happening. The weakness in U.S. same store sales were a result of a very challenging staffing environment for franchise stores despite higher menu prices and increase of delivery fees and product mix.

DPZ Opportunistic Pullback Levels
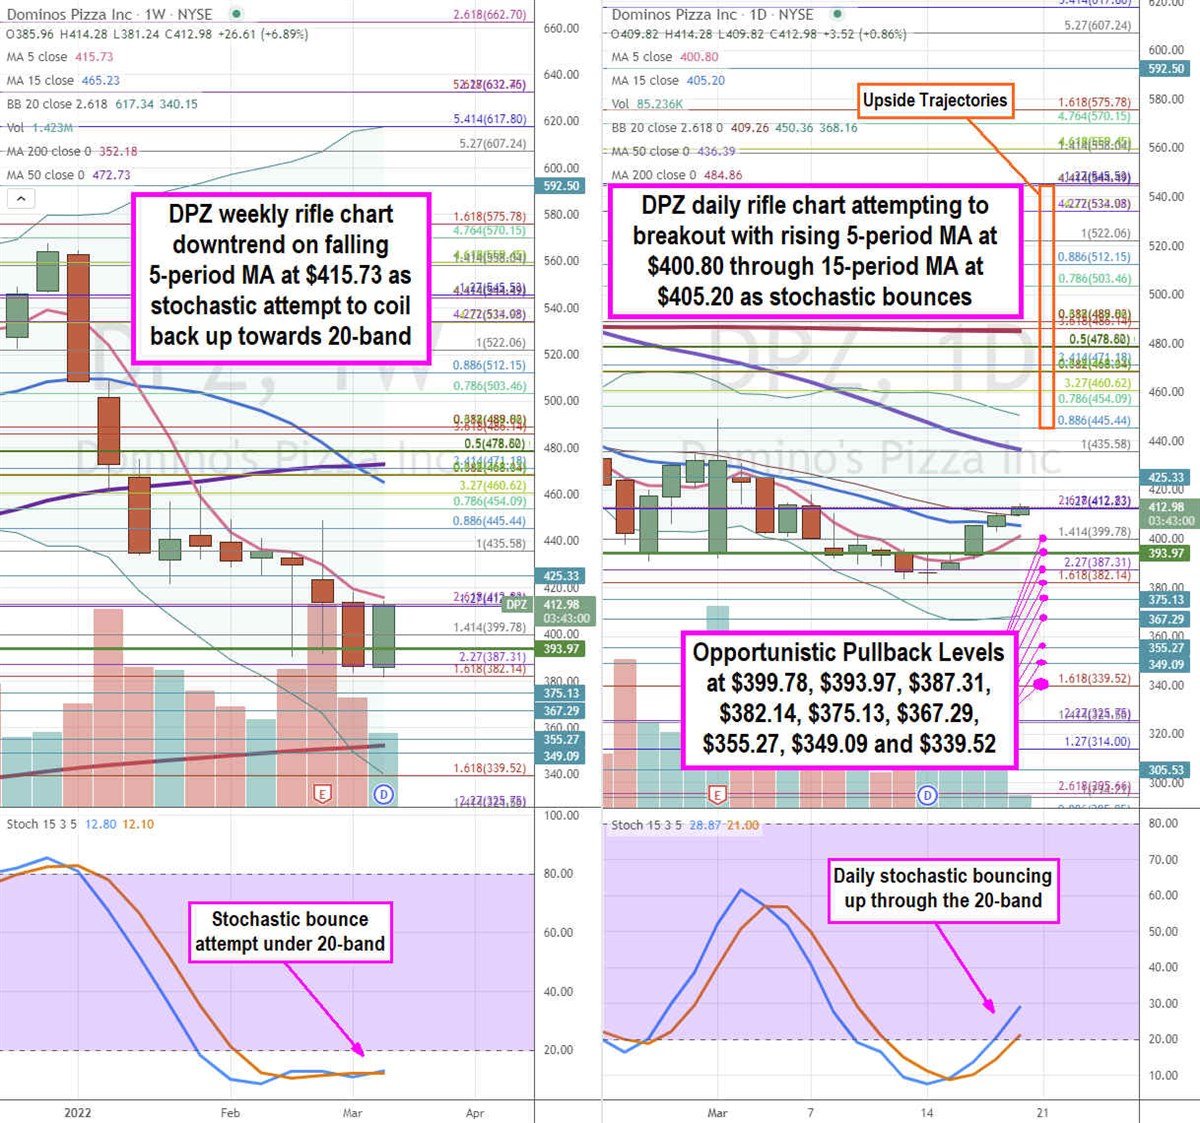
Using the rifle charts on the weekly and daily time frames provides a precision view of the landscape for DPZ stock. The weekly rifle chart peaked near the $445.44 Fibonacci (fib) level. The weekly downtrend has a falling 5-period moving average (MA) resistance at $415.73 as the stochastic attempts to bounce towards the 20-band. The weekly 15-period MA resistance is still falling at $415.73 crossing below the weekly 50-period MA at $472.73. The weekly 200-period MA support sits at $352.18 with weekly lower Bollinger Bands (BBs) near the $339.52 fib. The daily rifle chart downtrend has stalled out as the 5-period MA is rising at $400.80 to potentially cross the 15-period MA at $405.20 to trigger a breakout. The daily market structure low (MSL) buy triggered on the breakout above $393.97. The daily 50-period MA sits near the $435.58 fib with upper BBs at $450.38 and the daily 200-period MA at $484.86. The daily stochastic crossed up through the 20-band. Prudent investors can look for opportunistic pullbacks at the $399.78 fib, $393.97 daily MSL trigger, $387.31 fib, $382.14 fib, $375.13, $367.29, $355.27, $349.09, and the $339.52 fib level. Upside trajectories range from the $445.44 fib up towards the $545.53 fib level.
https://www.entrepreneur.com/article/422792