Nutanix Stock Bestows a Cheap Entry
Enterprise hybrid multi-cloud computing platform Nutanix (NASDAQ: NTNX) stock was a unicorn on its IPO but has plunged like a rock down (-47%) on the year. The virtualization platform is benefitting from the acceleration of enterprise digital transformation and multi-cloud operating models. The Company fundamentals are still improving as revenues have grown 17.2% in its fiscal Q3 2022. Nutanix noticed an unexpected impact limiting its upside. Supply chain and logistics disruptions caused its hardware partners to delay shipments combined talent attrition has caused Nutanix to lower its forward guidance. The Company stresses that the start dates have been delayed pending hardware deliveries and availability. This is a supply issue, not a demand issue. Prudent investors seeking exposure in the virtualization and hybrid multi-cloud segment can look for opportunistic pullbacks in shares of Nutanix.
 MarketBeat.com – MarketBeat
 Q3 Fiscal 2022 Earnings Release
On May 25, 2022, Nutanix released its fiscal third-quarter 2022 results for the quarter ending April 2022. The Company reported an earnings-per-share (EPS) loss of (-$0.05) excluding non-recurring items versus consensus analyst estimates for a loss of ($0.21), beating estimates by $0.16. Revenues rose 17.2% year-over-year (YoY) to $403.7 million beating analyst estimates for $397.9 million. The Company had 28% YoY ACV billings growth. GAAP gross margins rose 180 bps to 80.2%. Nutanix CEO Rajiv Ramaswami commented, “Late in the third quarter, we saw an unexpected impact from challenges that limited our upside in the quarter and affected our outlook for the fourth quarter. Increased supply chain delays with our hardware partners account for the significant majority of the impact to our outlook, and higher-than-expected sales rep attrition in the third quarter was also a factor. We don’t believe these challenges reflect any change in demand for our hybrid multicloud platform, and we remain focused on mitigating the impact of these issues and continuing to execute on the opportunity in front of us.”
Lowered Fiscal 2022 Guidance
Nutanix lowered its guidance for fiscal Q4 2022 revenues to come in between $340 million to $360 million versus $440.26 consensus analyst estimates with ACV billings of $175 million to $185 million. Nutanix lowered its fiscal full-year 2022 revenue guidance between $1.535 billion to $1.555 billion versus $1.63 billion consensus analyst estimates. It Company sees ACV billing of $1.535 billion to $1.555 billion.
Conference Call Takeaways
CEO Ramaswami saw strength in the renewables business. Enterprise demand for its cloud platform is being driven by accelerating digital transformation, multicloud adoptions and modernization of data centers. While the end of the quarter is when a significant portion of orders get booked, he noticed a material impact on their billings stemming from delays from its hardware partners. The billings have not been cancelled but delayed to future start dates to coincide with hardware delivery and availability. The Company also experienced sales people attrition rates worsen in Q3 with a lower sales representative headcount heading into fiscal Q4 2022. The Company continues its execution of the subscription model. Nutanix closed a seven figure deal with a North American based energy exploration company that wanted to modernize its three tier infrastructure while extending their workloads in the public cloud and adding flexibility. By adopting the Nutanix cloud infrastructure as Nutanix Cloud Manager for self-service automation, hybrid multi-cloud management duties and application life cycle management, the client will have simplified operations, reduce support requirements while seamlessly extending workloads in the public cloud. He proceeded to provide multiple examples of client winds in the quarter highlighting the improvements to efficiency and productivity utilizing Nutanix cloud solutions.

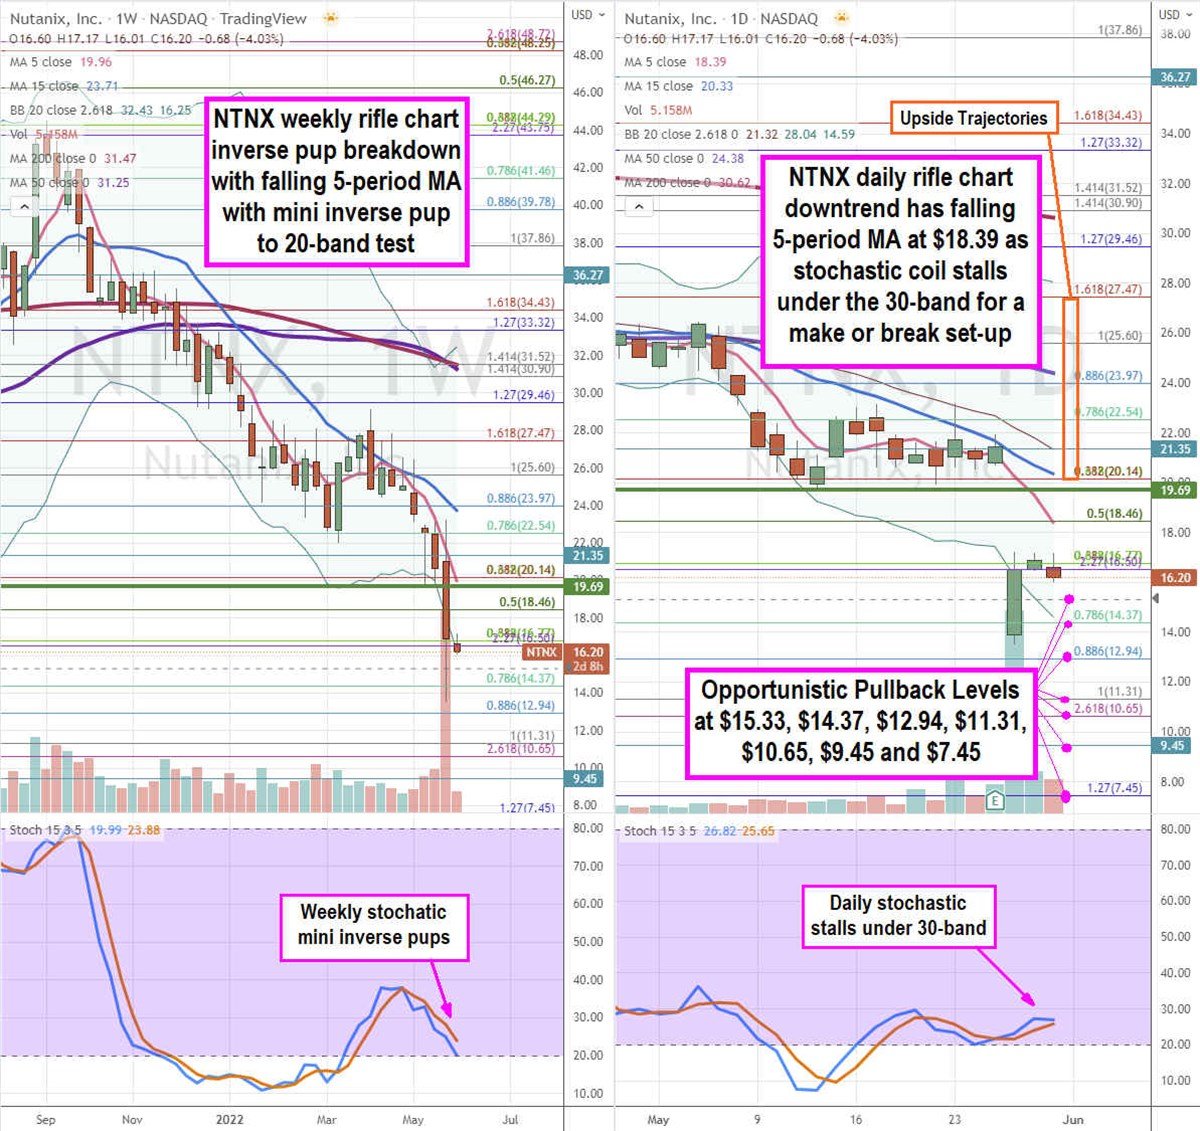
Opportunistic Pullback Levels
Using the rifle charts on the weekly and daily time frames to lay out the playing field for NTNX. The weekly rifle chart peaks and reversed near the $28.47 Fibonacci (fib) level. The weekly inverse pup has a falling 5-period simple moving average (MA) at $17.17 followed by the 15-period MA at $23.71. The weekly lower Bollinger Bands (BBs) sit at $16.25. The weekly stochastic has a mini inverse pup falling to test the 20-band. The weekly market structure low (MSL) buy triggers above the $19.69. The daily rifle chart formed an inverse pup breakdown on the earnings gap down. The daily 5-period MA continues to fall at $18.39 followed by the 15-period MA at $20.33. The daily lower BBs sit at $14.59. The daily stochastic crossed up but is stalling under the 30-band setting up a make or break. Prudent investors can watch for opportunistic pullback levels at the $15.33, $14.17 fib, $12.94 fib, $11.31 fib, $10.65 fib, $9.45, and $7.45 fib level. Upside trajectories range from the $20.14 fib level up towards the $27.47 fib level.
https://www.entrepreneur.com/article/429234