Google Ads launches new tool to help marketers connect with Gen Z
Google has launched the Gen Z Music lineup, a new tool that helps marketers better connect with young people.
The paid-for feature is now available globally to assist advertisers who would like to increase their appeal to 18- to 24-year-olds.
Why we care. Google has identified that the music favored by Gen Z plays an important role in shaping today’s culture. By finding out what songs are trending and allowing advertisers to have their campaigns displayed near media that uses the music this cohort has on repeat, brands will be seen at the forefront of culture.
The Gen Z Music lineup also provides marketers with an opportunity to better connect with Gen Z – a group of people that is rapidly becoming one of the largest online consumer groups. If advertisers aren’t paying attention to content that engages these potential customers most, then they risk failing to secure their buy-in.
How it works. The Gen Z Music lineup feature uses data from audio, long-form and YouTube Shorts to identify trending music. It follows these steps:
The Gen Z Music lineup identifies trending songs amongst 18- to 24-year-olds using regularly refreshed data across audio, long-form and YouTube Shorts.
Google AI then uses this data to package relevant music videos into the Gen Z Music lineup.
Marketers then have the option to buy the lineup.
Upon purchasing the lineup, advertisers’ campaign will then be served alongside content that plays the identified trending songs.
Get the daily newsletter search marketers rely on.
What has Google said? Brian Anderson, Google’s Global Head of Music and Audio, released a statement via the Google Ads Help newsroom. He said:
“Gen Z plays a huge role in shaping the cultural zeitgeist. And this largely happens on YouTube, where Gen Z music fans discover, consume, and participate in music across multiple formats.”
“Now we’re helping advertisers align their brand with the music Gen Z audiences (18-24) love on YouTube with the new Gen Z Music lineup.”
Deep dive. For more information, read Google’s full Gen Z Music announcement.
@media screen and (min-width: 800px) { #div-gpt-ad-3191538-7 { display: flex !important; justify-content: center !important; align-items: center !important; min-width:770px; min-height:260px; }
}
@media screen and (min-width: 1279px) { #div-gpt-ad-3191538-7 { display: flex !important; justify-content: center !important; align-items: center !important; min-width:800px!important; min-height:440px!important; }
}
About the author
Nicola Agius is Paid Media Editor of Search Engine Land after joining in 2023. She covers paid search, paid social, retail media and more. Prior to this, she was SEO Director at Jungle Creations (2020-2023), overseeing the company’s editorial strategy for multiple websites. She has over 15 years of experience in journalism and has previously worked at OK! Magazine (2010-2014), Mail Online (2014-2015), Mirror (2015-2017), Digital Spy (2017-2018) and The Sun (2018-2020). She also previously teamed up with SEO agency Blue Array to co-author Amazon bestselling book ‘Mastering In-House SEO’.
Comparing UA vs. GA4 metrics: Key differences you need to know
Unless you’ve been away on a desert island for the last 18 months, you’re well aware that Google Analytics 4 (GA4) took center stage on July 1 as the source for our web metrics. We’ve had to say goodbye to Universal Analytics (UA), an old friend to many marketers.
One of the biggest challenges marketing teams may face will be comparing a current period of data to year-over-year (YOY) historicals to measure growth success.
There are fundamental changes in how GA4 measures data vs. how UA does, so comparing data between the two won’t be an apples-to-apples scenario.
The apples-to-apples YOY comparison scenario is why there was a big push by many to get GA4 set up, running and collecting data by July 1, 2022. That would allow for a true comparison.
So what happens if you’re one of the procrastinators (don’t feel bad – there are plenty!) who won’t be able to make a true apples-to-apples comparison? Well, here’s what you need to know.
Fundamentally different data models
UA was based on sessions and pageviews. GA4 is based on events and parameters. Both methods can collect and tally data, but the output in a report will look different.
So what does this mean in plain English?
Different numbers in metrics you report
You’ll encounter cases where the metric is called the same thing so you’re tempted to believe the number should completely match up (or at least come close). However, you may find some variances.
For example:
User counts
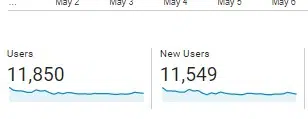
Here is a small website’s UA user/new user count for one month:
UA count of users and new users
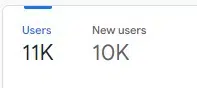
Now here is that same small website’s GA4 user/new user count for the same exact time period:
GA4 count of users and new users
In the reports snapshot, GA4 rounds the numbers, but you can see the users reported in GA4 is about 8% lower than what’s seen in UA.
The new users metric is even more pronounced (a difference of almost 14%) if you look at the rounded number. (Actual number reported in GA4 when you drill down is 10,443 – a difference of just under 10%.)
Sessions
GA4 has a couple of key differences when it comes to counting sessions, which actually make the count more accurate.
While both platforms have a default session timeout setting of 30 minutes, UA restarts the session at midnight and generates a new one when a UTM promo code is clicked on.
If you could follow that, basically, the “session count” numbers you’ve been reporting on forever aren’t exactly an exact tally.
GA4 does not restart at midnight and does not generate a new session if a UTM promo code is clicked.
For example, I have seen some websites put a promo UTM code on a link to an internal page (bad idea and unnecessary, by the way).
In UA, that causes a new session to be started and it overwrites any other UTM promo code that may have actually driven the traffic.
Conversions
The way conversions are calculated between the two platforms differ.
UA will only count one conversion per session for each goal. So for example, a user clicks on the “click to call ” multiple times.
However, the user doesn’t follow through and cancels before the call goes through the first time. Only one conversion will be counted for that goal.
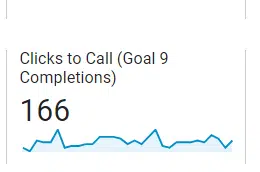
Here’s an example of the “Clicks to Call” goal setup in UA:
Clicks to Call goal completions in UA
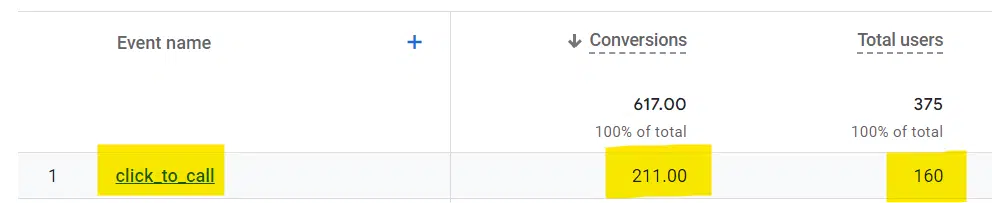
In contrast, GA4 will count a conversion every time even if that same conversion event is recorded multiple times during a session (Same user, same site, same visit):
Click to Call goal completions in GA4
Understanding the proper context matters here.
On the one hand, you could argue GA4 inflates the actual number of conversions since you basically have the same individual clicking on the “call” link multiple times (presumably for a single purpose).
On the other hand, you could argue that all you really cared about was whether the user converted on the call to action – not how many attempts it took on a particular session. Regardless of which method you feel is better, the GA4 method is now the way forward.
If we’re talking about an “Add to cart” conversion where the user put one pair of shoes in a cart, then continued to shop and added socks, GA4 would count this as two conversion events.
You could argue that GA4 counting two conversion events is appropriate (depending on how you choose to look at it).
Get the daily newsletter search marketers rely on.
Rethinking our web performance metrics
GA4 is giving us a new way to think about success metrics for the business and what really matters. Here are a couple of examples:
Sessions
We already covered the differences in how the two platforms calculate sessions, but GA4 steers us to thinking about sessions that actually result in meaningful engagement on the site.
One of the first callouts you’ll notice is “Engaged sessions,” which is simply a count of sessions where the user actually did something.
Engagement metrics
An “engaged session” can only be considered if it lasts longer than 10 seconds, has one or more conversion events, or has two or more page/screen views.
You may or may not agree, but that’s what GA4 uses for its standard. “Engaged session” is not a canned metric in UA.
Bounce rate
For a generation, marketers loved to report a low bounce rate as a measure of success. However, it’s not always a great metric. As with any success metric, context is king.
For example, a simple recipe page could do its job perfectly but show a high bounce rate.
The user got what they came for (the recipe) and then made a happy exit. Is that bad?
No, actually. It’s a good thing for the user.
Bounce rate is now gone as a stand-alone metric in GA4. Now you can refer to the engagement rate intended to show you the percentage of quality site visits. (Again, according to the definition of quality.)
If you start with 100 and subtract the engagement rate from it, in theory, you get something similar to a bounce rate.
For this article, just a quick high-level reminder of the differences:
In UA, events are used to track site actions that don’t necessarily generate a success page.
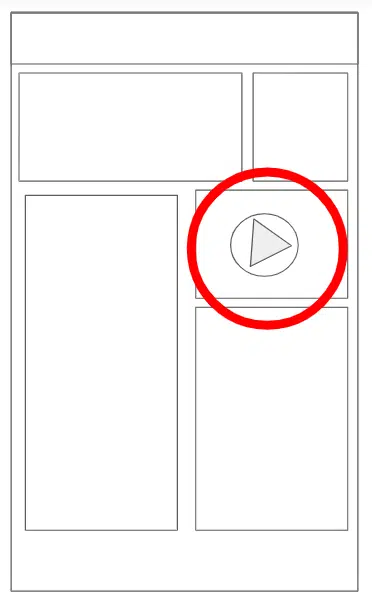
For example, you have a video on your home page. That video is played all the way through.
Upon completion of that video, there is no “Thank You” page you can easily set up as a standard conversion goal. This is where events come in.
UA lets you give “events” a category, action, and label to provide more description and context. An event is counted when an action is triggered. For example, if you have a video on the home page and track completions.
A wireframe example of a video on the front page of a site
GA4 has no category, action, or label, so there’s no point in learning it now. And with GA4, everything is an event. For example:
Pageview = Event
Session Start = Event
First Visit = Event
Scroll = Event
Click = Event
Video Start = Event
File Download = Event
Video progression = Event
Video complete = Event
Newsletter Signup = Event
Contact Submission = Event
View Search Results = Event
You get the idea.
Everything remotely worth measuring is an event.
Views vs. data streams
In UA, you can have one simple website and a mind-boggling number of views set up. You can see different numbers depending on which view you’re looking at, so it was worth understanding.
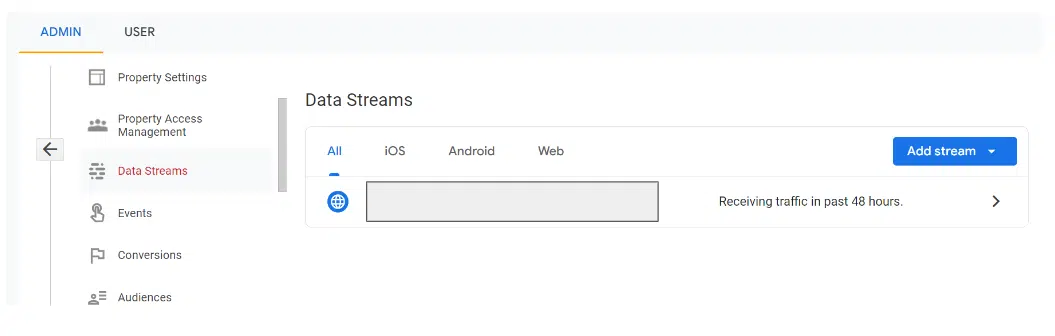
There are no more views in GA4. Instead, there are data streams. Those can be seen in Admin > Data Streams:
If you had previously set up multiple views in UA, you’ll want to look at the data stream settings in GA4 to make sure you’re measuring what matters to your business.
One of the benefits of GA4 is you can better see a more accurate reflection of the number of users.
For example, a data stream can be a website or an app. If your business also has a native mobile app, that can be a plus.
Moving on from UA to GA4
If you didn’t have GA4 set up and running by July 1, 2022, you will not have a true apples-to-apples YOY comparison for July 2023 data. So be careful how you report the numbers.
If you have no choice but to show UA data for the previous year, include a big asterisk along with an explanation. Hopefully, this article provides a little context and backup info when you’re asked why.
Opinions expressed in this article are those of the guest author and not necessarily Search Engine Land. Staff authors are listed here.
@media screen and (min-width: 800px) { #div-gpt-ad-3191538-7 { display: flex !important; justify-content: center !important; align-items: center !important; min-width:770px; min-height:260px; }
}
@media screen and (min-width: 1279px) { #div-gpt-ad-3191538-7 { display: flex !important; justify-content: center !important; align-items: center !important; min-width:800px!important; min-height:440px!important; }
}
About the author
Adam Proehl is Partner & Co-Founder at NordicClick Interactive, a full-service digital agency with local and national clients, based in Minneapolis.
In digital marketing since 1998, Proehl has spoken at numerous national and international conferences, including SMX. He is a current Advisory Board Member for the Paid Search Association.
Google ranks AI-generated ‘Star Wars’ article lacking E-E-A-T
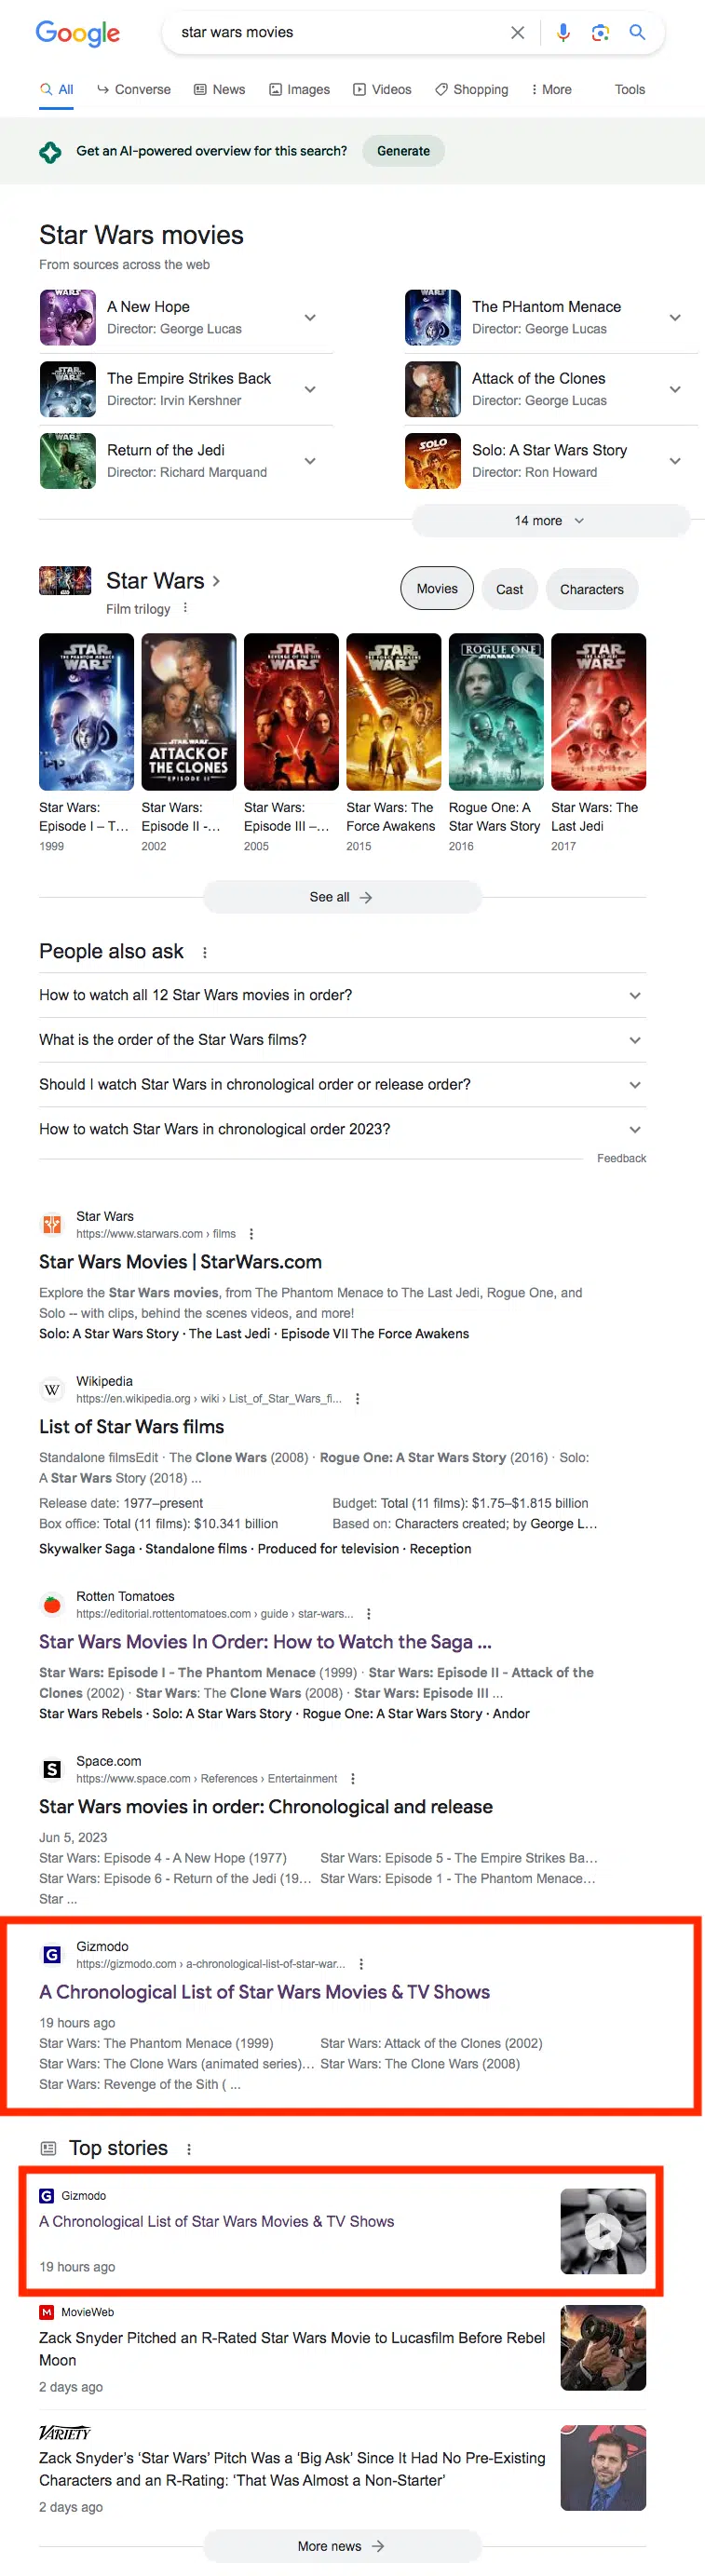
Despite constant reminders to create helpful content and the importance of E-E-A-T (expertise, experience, authoritativeness and trustworthiness) – Google Search still finds ways to rank content on Page 1 that shouldn’t be there.
Page 1 for [Star Wars movies]. Despite multiple errors, the article ranked just fine:
Now it is in Position 5, but earlier in the day, it was in Position 3, above the Rotten Tomatoes page.
Freshness may have been a key factor here. Also, Gizmodo is a strong brand and publishes lots of content on this and related topics.
This article. It lives on the io9 section (which publishes content around science-fiction and fantasy movies, TV, books, comics) of the technology blog Gizmodo.
The editor’s response. As well all know, AI-generated content isn’t bad just because AI created it. However, this was so bad James Whitebrook, deputy editor, took to Twitter to make it clear that neither he, nor his team, had any part in the editing or publishing of the article:
Hello! As you may have seen today, an AI-generated article appeared on io9. I was informed approximately 10 minutes beforehand, and no one at io9 played a part in its editing or publication.
Here is a statement I have sent to G/O Media, alongside a lengthy list of corrections. pic.twitter.com/xlROmxmupA
“For 15 years, io9 has grown an audience that demands quality coverage of genre entertainment, from critical analysis, to insightful explainers, to accurate news and industry-shaping investigative reporting. These readers have grown io9 into one of the best performing desks at Gizmodo, G/O Media’s flagship site in terms of traffic, and they have done so by rigorously holding this team and the colleagues that came before us to a standard of expertise and accuracy that we have been product to achieve. The article published on io9 today rejects the very standards this team holds itself to on a daily basis as critics and as reporters. It is shoddily written, it is riddled with basic errors; in closing the comments section off, it denies our readers, the lifeblood of this network, the chance to publicly hold us accountable, and to call this work exactly what it is: embarrassing, unpublishable, disrespectful of both the audience and the people who work here, and a blow to our authority and integrity. It is shameful that this work has been put to our audience and to our peers in the industry as a window to G/O’s future, and it is shameful that we as a team have had to spend an egregious amount of time away from our actual work to make it clear to you the unacceptable errors made in publishing this piece.
The correction. The editorial team has now updated the article and added a note at the bottom:
“A correction was made to this story on July 6, 2023. The episodes’ rankings were incorrect. In particular, The Clone Wars was placed in the correct chronological order in the corrected list.“
If you’re curious about what the original version looks like, you can see it via the Wayback Machine.
Why we care. You absolutely can publish AI-generated content. Some of it may rank well – even on Page 1. But if that content has incorrect information, because it hasn’t been reviewed by an editor and/or subject matter expert, there could be severe long-term damage to your brand’s reputation.
Not the first, nor the last. Many brands – in an attempt to save costs by laying off human writers (see: Red Ventures’ BankRate and CNET) – are turning to AI-generated content. It’s faster and cheaper to produce, but the end result hasn’t always been good:
@media screen and (min-width: 800px) { #div-gpt-ad-3191538-7 { display: flex !important; justify-content: center !important; align-items: center !important; min-width:770px; min-height:260px; }
}
@media screen and (min-width: 1279px) { #div-gpt-ad-3191538-7 { display: flex !important; justify-content: center !important; align-items: center !important; min-width:800px!important; min-height:440px!important; }
}
About the author
Danny Goodwin has been Managing Editor of Search Engine Land & Search Marketing Expo – SMX since 2022. He joined Search Engine Land in 2022 as Senior Editor. In addition to reporting on the latest search marketing news, he manages Search Engine Land’s SME (Subject Matter Expert) program. He also helps program U.S. SMX events. Goodwin has been editing and writing about the latest developments and trends in search and digital marketing since 2007. He previously was Executive Editor of Search Engine Journal (from 2017 to 2022), managing editor of Momentology (from 2014-2016) and editor of Search Engine Watch (from 2007 to 2014). He has spoken at many major search conferences and virtual events, and has been sourced for his expertise by a wide range of publications and podcasts.
The brightest minds in marketing and tech converge at NexTech, Nov. 14–15 in NYC. Get your pass for the latest on generative AI, gaming and more.
Meta’s new Twitter clone app—Threads—is expected to launch on July 6, according to Apple’s App Store.
The decentralized app was made available for pre-order, although not paid, on Monday on Apple’s App Store and Google Play. The web version is expected to go live around the same time.
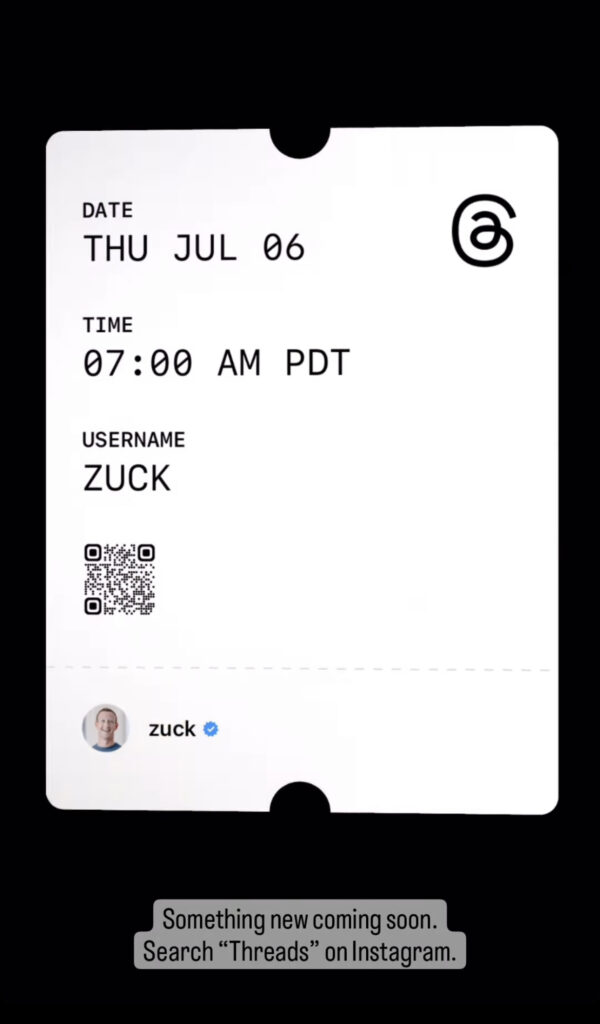
According to Mark Zuckerberg’s Instagram teaser, anyone who types “Threads” on Instagram search receives a ticket indicating the app will be live by 10 a.m. ET.
Here’s what we know about the app so far.
Apple
According to a leaked screenshot and previews made available on the App Store and Google Play, Threads bears a striking resemblance to Twitter, featuring the ability to create content threads, restrict responses, and add images.
Meta’s Threads is set to release around the same time as Twitter limits the number of tweets people can view per day to deter third parties from scraping data off the platform. Elon Musk tweeted that unverified users could read 600 tweets and verified users 6,000 per day.
Searches for the term “delete Twitter account” saw a staggering surge of 292% in the U.S. and 131% worldwide on July 1, compared to the previous seven days, according to CasinoAlpha, an online comparison service.
Matt Navarra/Twitter
Advertisers have been lukewarm about Threads given Meta’s history of data collection practices. Questions remain about Thread’s adoption and monetization. However, brands could find opportunities in real-time brand conversations and get hyperlocal with user interaction on Threads.
“Twitter is severely wounded and Meta’s Threads could deliver another major blow,” said Insider Intelligence principal analyst, Jasmine Enberg via email. “While it’s hard to imagine that the most avid Twitter users will deflect and go to Threads, many people are frustrated enough by the recent tweet rate limits implemented by Musk to give Threads a shot.”
Threads will be compatible with other apps like Mastodon and will be made available in the U.S. and the U.K.
How does the app work with Instagram?
Once on Threads, according to Lia Haberman, author of the social media newsletter ICYMI, creators and public figures can log in with a single sign-on with their Instagram username and password and sync up with their existing followers. The user’s handle, bio, and verification will migrate over from Instagram. Threads users will be able to search for, follow and interact with creators and public figures on the app.
Users can post text updates up to 500 characters and can attach links, photos and videos up to five minutes long. They can interact via likes, replies and reposts.
Built on the back of Instagram, Threads will operate based on Instagram’s existing guidelines. Blocked accounts and users will carry over on Threads.
Who is using it?
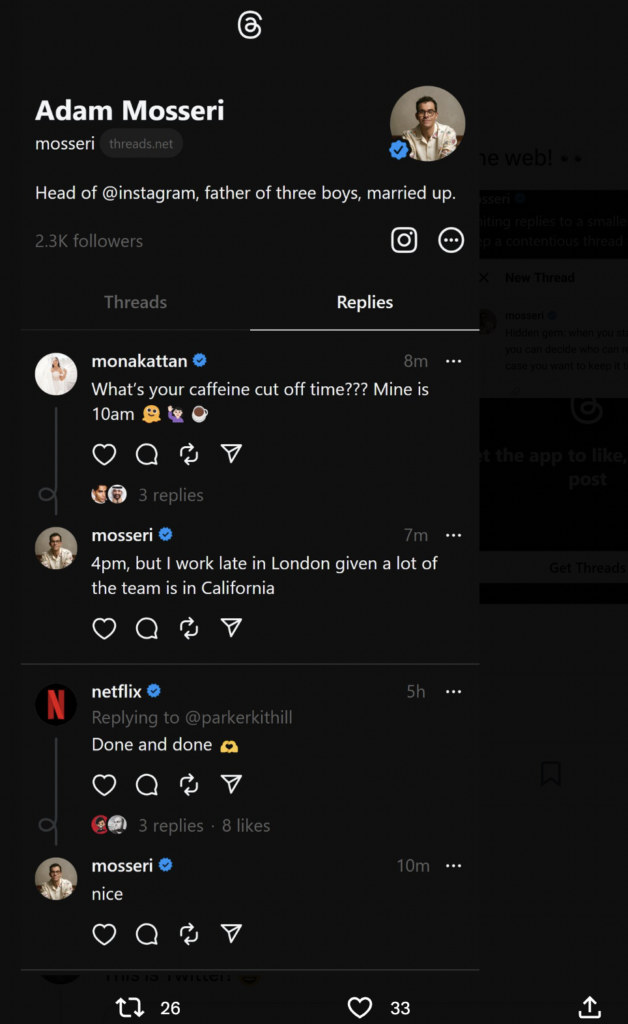
Meta is actively courting creators and celebrities to the platform, sources previously told Adweek. According to leaked tweets by Alessandro Paluzzi, current Threads testers included Vogue editor Gabriella Karefa-Johnson and creators like Shabaz Says alongside official accounts for streaming services like Netflix.
“Meta only needs roughly one-in-four Instagram users to use Threads monthly to make it as big as Twitter,” said Enberg. “If the company can attract even a handful of top Instagram creators from its wide user base, audiences will follow.”
What about data and privacy, especially in Europe?
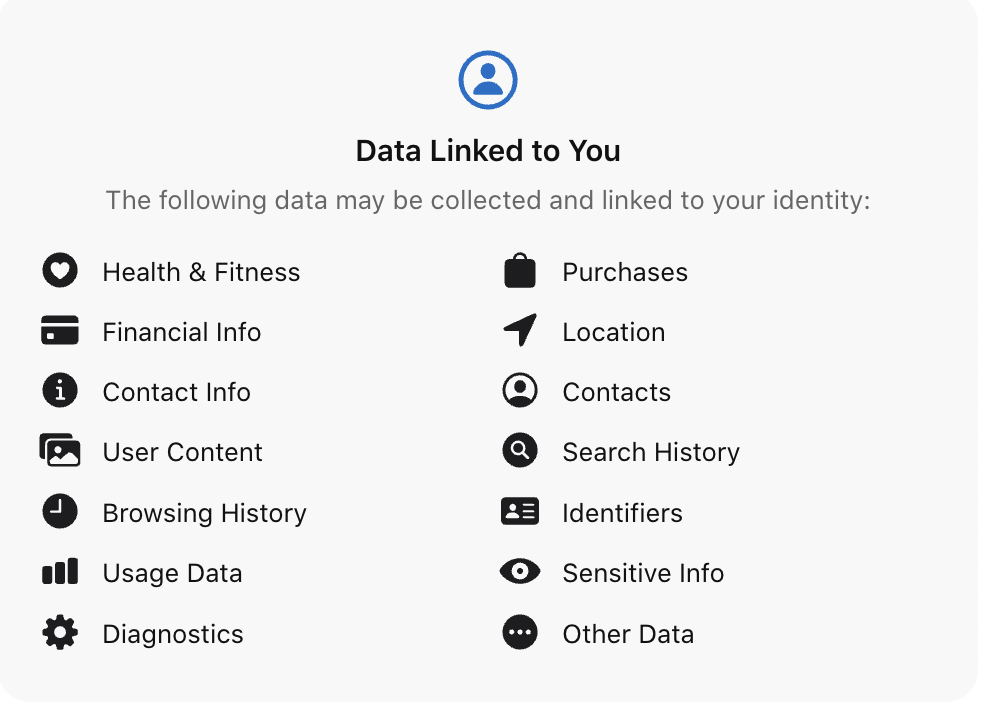
According to the App Store listing, Threads will import all the data from Instagram, including behavioral and advertising information, such as health and fitness data, financial information, browsing history and sensitive information.
Posting a screenshot of Thread’s privacy policy, Twitter’s former CEO, Jack Dorsey, referred to Meta’s massive data collection practice saying “All your Threads belong to us.”
Apple
But, the data transfer from Instagram to Threads has limited the company’s release in the EU, according to Bloomberg, as Meta awaits guidance on the Digital Markets Act, a regulation designed to rein the monopoly of the gatekeepers of the digital economy. This will indicate how data sharing between Instagram and Threads will be regulated.
A spokesperson for Ireland’s Data Protection Commission (DPC) told the Independent that the regulator had received information about the new app and that it would not be rolled out in the EU “at this point.”
What are the opportunities for marketers?
While the question of how Threads will make money still remains, Enberg pointed out that ads are Meta’s bread and butter, making them an obvious choice. Subscriptions and paywalled content could be another revenue stream fit for the creator-focused app.
Allowing Instagram users to port their profile to Threads makes it easy for the new app to gain more traction, according to Matt Navarra, a social media consultant. This could be a selling point for advertisers and people who have fled Twitter.
“You can build up an audience fairly quickly,” he said.
Being built on the back of Instagram means Threads’ content moderation and copyright protection are already built in—something Twitter seems to grapple with.
“This signals to me a great opportunity for marketers at a fairly low risk,” said Navarra.
Threads could spur brands to have more hyperlocal conversations, fostering communities around individual stores or locations in a way Instagram or Twitter hasn’t, said Damian Rollison, director of market insights at SOCi.
For example, Starbucks which has its main page on Instagram, could have a real-time capability to launch different pages on Threads that could support different stores and have conversations relating to that specific location.
“The launch of Threads has already sparked privacy concerns, and that could have implications both for Threads’ rollout to consumers and its monetization strategy,” Enberg said.
Study: TikTok loses popularity as ecommerce search engine
Fewer U.S. adults are beginning their product searches on TikTok than a year ago, according to a CivicScience study.
Why we care. This is the latest evidence that Amazon is a platform that retail brands must pay attention to. While TikTok intends to build a $20 billion ecommerce business, the U.S. won’t be a big factor yet – and may never be. Regardless, marketing and advertising budgets will continue to follow users. But ultimately it comes down to whether TikTok is an effective platform for your brand.
Amazon and Google reign. Overall, the starting point for product searches among online shoppers is Amazon (49%, up from 46% in 2022), followed by Google (34%, down from 35% in 2022).
Amazon also increased its popularity among younger age groups, compared to last year:
18- to 24-year-olds: Up 45%
25- to 34-year-olds: Up 44%.
Additional context. These results are similar to another U.S. survey we reported on in Amazon beats Google as starting point for product search. That survey found 38% of shoppers began product searches on Amazon, while 35% started searching on Google.
TikTok’s YoY decline. After hitting a new high in 2022, CivicScience noted a “steep decline” for TikTok among younger generations this year:
“Usage fell from 18% to 11% among Gen Z (18-24) and from 10% to 5% among young Millennials (25-34) from August 2022 to June 2023.”
Most people who start their product searches on TikTok, Instagram or Reddit are between the ages of 18-34, CivicScience noted.
About the study. The CivicScience study asked U.S. online shoppers: “When shopping for a product online, where do you typically start for product searches and research?” It then compared 5,638 responses received between June 6 and 26 to 4,643 responses from August 2022.
@media screen and (min-width: 800px) { #div-gpt-ad-3191538-7 { display: flex !important; justify-content: center !important; align-items: center !important; min-width:770px; min-height:260px; }
}
@media screen and (min-width: 1279px) { #div-gpt-ad-3191538-7 { display: flex !important; justify-content: center !important; align-items: center !important; min-width:800px!important; min-height:440px!important; }
}
About the author
Danny Goodwin has been Managing Editor of Search Engine Land & Search Marketing Expo – SMX since 2022. He joined Search Engine Land in 2022 as Senior Editor. In addition to reporting on the latest search marketing news, he manages Search Engine Land’s SME (Subject Matter Expert) program. He also helps program U.S. SMX events. Goodwin has been editing and writing about the latest developments and trends in search and digital marketing since 2007. He previously was Executive Editor of Search Engine Journal (from 2017 to 2022), managing editor of Momentology (from 2014-2016) and editor of Search Engine Watch (from 2007 to 2014). He has spoken at many major search conferences and virtual events, and has been sourced for his expertise by a wide range of publications and podcasts.
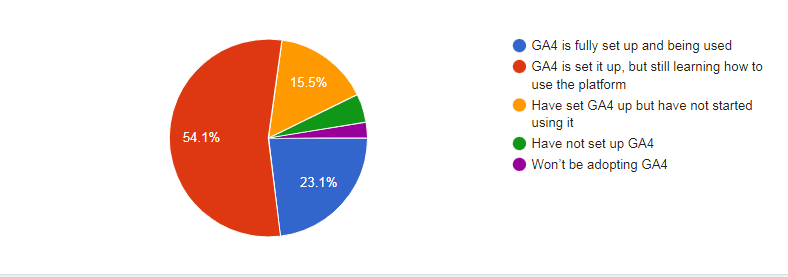
Almost a quarter of respondents said they have fully implemented and already are using GA4.
Just over half said they had implemented it but were still learning how to use it.
Almost 16% have it set up but have not started using it.
The takeaway from those statistics: more than 90% of our joint readership is aboard the GA4 train, for better or worse.
Only 2.6% of respondents said they had no plans to use GA4.
4.6% have just not set it up yet.
Why we care. At first glance, this looks like a vote of confidence in Google’s analytics strategy. After all, there are plenty of alternatives to GA4. But it’s not that simple.
Rightly or wrongly, it’s possible to adopt a tool even though you really don’t like it.
“An unfinished product rushed to market.”
“It’s not that the masses aren’t ready for GA4, it’s that GA4 isn’t ready for the masses. The UI is terrible.”
“Terrible UI, terrible reporting.”
Selected comments from poll respondents.
We might need to wait a while to see if people can make GA4 work for them or if frustrations with it start to make the alternatives look more attractive.
@media screen and (min-width: 800px) { #div-gpt-ad-3191538-7 { display: flex !important; justify-content: center !important; align-items: center !important; min-width:770px; min-height:260px; }
}
@media screen and (min-width: 1279px) { #div-gpt-ad-3191538-7 { display: flex !important; justify-content: center !important; align-items: center !important; min-width:800px!important; min-height:440px!important; }
}
About the author
Kim Davis is the Editorial Director of MarTech Today. Born in London, but a New Yorker for over two decades, Kim started covering enterprise software ten years ago. His experience encompasses SaaS for the enterprise, digital- ad data-driven urban planning, and applications of SaaS, digital technology, and data in the marketing space. He first wrote about marketing technology as editor of Haymarket’s The Hub, a dedicated marketing tech website, which subsequently became a channel on the established direct marketing brand DMN. Kim joined DMN proper in 2016, as a senior editor, becoming Executive Editor, then Editor-in-Chief a position he held until January 2020. Prior to working in tech journalism, Kim was Associate Editor at a New York Times hyper-local news site, The Local: East Village, and has previously worked as an editor of an academic publication, and as a music journalist. He has written hundreds of New York restaurant reviews for a personal blog, and has been an occasional guest contributor to Eater.
YouTube stops playing videos for people with ad blockers in new trial
YouTube is disabling videos for people using ad blockers as part of a new trial.
The social media platform is asking users to either turn ad blockers off or pay £11.99 a month for YouTube Premium if they want access to its extensive video library.
Why we care. If this trial is expanded to the general population, all YouTube users, who want to continue watching videos for free, will be forced into allowing ads to play. This is great news for marketers as it will increase reach for campaigns, which ultimately, could result in more conversions.
How it works. Right now, the trial is being tested on a small group of people around the world that have ad blockers enabled. When they sign in to watch content, all videos will be blocked unless they either change their settings to disallow ad blocker or they sign up for YouTube Premium.
Get the daily newsletter search marketers rely on.
What has YouTube said? Oluwa Falodun, a spokesperson for Google, told The Verge in a statement:
“Ad blocker detection is not new, and other publishers regularly ask viewers to disable ad blockers.”
“We take disabling playback very seriously, and will only disable playback if viewers ignore repeated requests to allow ads on YouTube.”
“In cases when viewers feel they have been falsely flagged as using an ad blocker, they can share this feedback by clicking on the link in the prompt.”
“We want to inform viewers thatad blockers violate YouTube’s Terms of Service, and make it easier for them to allow ads on YouTube or try YouTube Premium for an ad free experience,”
Why now? YouTube has said that it is taking these measures to ensure that its content creators are compensated for their work. “YouTube’s ad-supported model supports a diverse ecosystem of creators, and provides billions of people globally access to content for free with ads,” the company said in a statement.
Deep dive: For more information on YouTube’s ad policy, you can visit the YouTube Advertising hub.
@media screen and (min-width: 800px) { #div-gpt-ad-3191538-7 { display: flex !important; justify-content: center !important; align-items: center !important; min-width:770px; min-height:260px; }
}
@media screen and (min-width: 1279px) { #div-gpt-ad-3191538-7 { display: flex !important; justify-content: center !important; align-items: center !important; min-width:800px!important; min-height:440px!important; }
}
About the author
Nicola Agius is Paid Media Editor of Search Engine Land after joining in 2023. She covers paid search, paid social, retail media and more. Prior to this, she was SEO Director at Jungle Creations (2020-2023), overseeing the company’s editorial strategy for multiple websites. She has over 15 years of experience in journalism and has previously worked at OK! Magazine (2010-2014), Mail Online (2014-2015), Mirror (2015-2017), Digital Spy (2017-2018) and The Sun (2018-2020). She also previously teamed up with SEO agency Blue Array to co-author Amazon bestselling book ‘Mastering In-House SEO’.
The brightest minds in marketing and tech converge at NexTech, Nov. 14–15 in NYC. Get your pass for the latest on generative AI, gaming and more.
The clamor for regulatory reforms targeting Big Tech companies stems from a fundamental issue deeply embedded in the advertising industry. Within this complex landscape, tech giants such as Google, Facebook and Amazon reign supreme, wielding control over data, platforms and buy-side ad tech.
However, the very nature of their dominance poses a challenge, as they find themselves facing conflicts of interest. The imbalances they helped create have sparked the neutrality debate surrounding buy-side infrastructure, driving calls for change.
Grading your own homework
Talk about a stacked deck. These companies’ walled gardens are designed to collect and activate audience data. But by owning the data, the platform and the buy-side ad tech, these Big Tech players are grading their own homework.
Buy-side and sell-side are fundamentally at odds: Buyers want to maximize return on ad spend, while sellers want to maximize yield. There is no fair way to play on both sides simultaneously, and the intensifying regulatory pressure on Big Tech makes neutrality an existential question for these companies.
Several years ago, Big Tech bought up all their own ad-serving technology and with it, the mechanisms for reporting on viewability and verification. In the vacuum created by that consolidation, a trifecta of companies created what became a multibillion-dollar market just to handle brand safety and verification, because these checks can onlybe provided by an impartial third party.
Brands have come to appreciate that the same is true of other core capabilities, everything from ad serving to identity solutions to dynamic creative and audience intelligence. With ongoing fragmentation in supply, omnichannel marketers need these essential tools to be centralized under their control.
As it turns out, Big Tech is feeling the same way and increasingly embracing the idea of media-neutral buy-side infrastructure.
The incentives to do so are strong. First, it’s just what marketers need. Dollars will flow where advertisers can target their audiences and track their investments, and walled gardens still need those dollars. Second, there is an increasing demand on Big Tech to connect third-party ad tech to owned supply.
The walled gardens know they need a healthy independent ecosystem in order to survive, and they are becoming better partners in building it.
The case for independent tech
Here are some key reasons an independent buy-side solution remains an essential part of the mix, regardless of whether marketers also rely on Google, Amazon and Facebook:
Transparency. Marketers will not backtrack on decades of innovation in data-driven marketing practice. They want insights, data and transparency into fees and access to unbiased measurement. Nobody should grade their own homework.
Consolidation. Marketers would prefer to work with fewer, more strategic partners. A multinational brand that has 13 agencies in 10 markets doesn’t want 13+ dashboards to rationalize. They want reporting and they want real-time results, not waiting a few months to see what’s happening in markets. An independent third party that works across walled gardens can offer that.
Fragmentation. Consumer attention and inventory supply are fragmented across channels and devices. The shift toward omnichannel media consumption has forced marketers to seek new ways to plan, buy and measure media with a single view of their audience.
Creative. Creative personalization and optimization represent one of the last great value plays in advertising. After more than a decade of focusing on targeting, planning and measurement (all worthwhile), a new set of AI-enabled capabilities are returning marketers’ attention to what can be done with creative personalization. These tools can only be leveraged effectively when they are communicating with contextual and behavioral signals.
Marketers want the best tech to move dollars fast and reduce friction, and that’s reason enough for Big Tech to open its doors and take a more collaborative approach with neutral buy-side tech. But, as mentioned, the big three are not the only ones.
Tightening the screw
The goals and incentives of the buy side (to maximize return on ad spend) are fundamentally at odds with those of the sell side (to maximize yields). To date, Big Tech has gotten around that conflict by virtue of sheer scale, good campaign performance and unrivaled data, but the conflict is still there.
Now that the DOJ is aiming specifically at these conflicts within Google’s ad-tech business, and with serious talk about divestiture and breakups, all the Big Tech players in advertising are looking at things differently.
For them, it appears increasingly that embracing an independent ecosystem is imperative for resolving the conflicts of interest now at the center of the regulatory debate. The question for Big Tech is less whether or not to embrace it, but how to control the process so that it isn’t done for them by the state.
It wasn’t long ago that Big Tech and independent tech were pitted on either side of an issue, but things change quickly in a fast-paced environment. Today and moving forward, neutral buy-side infrastructure is more of a common cause for the industry.
Luckily, there is no shortage of analytics tools that can compete with it, both in features and price.
Here, we’ve compiled a list of 15 free and low-cost alternatives to Google Analytics 4 that you may want to consider.
1. Matomo
Matomo is an open-source analytics platform that provides similar features to Google Analytics. It offers real-time analytics, customizable dashboards and detailed reports.
Matomo also gives users complete control over their data and offers a range of privacy features.
One of the most popular Google Analytics alternatives, Matomo is free if hosted on your servers.
2. Piwik PRO
Piwik PRO is a commercial spinoff of Matomo. The main differences are enterprise-level support and the integration of a customer data platform.
Like Matomo, it has an integrated privacy consent manager.
Piwik has free and paid plans.
3. Clicky
Clicky is a flash-free, real-time analytical platform that is easy to use and records and tracks user actions in detail.
It offers features like heat mapping, backlink analysis, and mobile compatibility.
It summarizes information in a convenient dashboard and provides data like rage clicks and excessive scrolling, which could indicate user frustration. Clarity also offers session recording features, which can help you understand user behavior.
Clarity is free.
6. Woopra
Woopra provides website analytics based on four data types: people, journey, trends, and retention.
It analyzes user actions based on their journey through different touchpoints like customer reactions after introductory emails.
Woopra tracks usage through your website and apps with real-time analytics and data. It also offers customized live reports that can help you use data to improve your customer retention and engagement.
Woopra offers free and paid plans.
7. Countly
Countly is an open-source analytics tool that prides itself on being a GDPR-friendly alternative to Google Analytics.
It offers real-time analysis across websites and apps, as well as a unique user ID feature that allows the same user to be identified more easily across multiple browsers and devices.
It has free and paid options.
8. Smartlook
Smartlook is an analytics solution tool for websites, iOS/Android apps and various app frameworks.
It helps users understand how customers interact with their website or app by providing features such as session recordings, heatmaps, automatic tracked events, and conversion funnels.
Smartlook has free and paid options.
9. GoSquared
GoSquaredis a web analytics platform designed for ease of use.
Its features include heatmaps, session recordings and funnel analysis. It is also privacy-focused, with features like IP anonymization and consent management.
Plans start at $9.
10. Kissmetrics
Kissmetrics tracks and analyzes user behavior based on first-party data it collects from your website or app.
Features include heatmaps, session recordings and funnel analysis. Kissmetrics helps personalize the user experience by showing different content to different users based on their behavior.
Plans start at $299.
11. Cabin Analytics
Cabin Analytics is designed to have a very small carbon footprint.
It is similar to Kissmetrics in that it is based on first-party data and can personalize user experience.
Cabin Analytics has free and paid plans.
12. PostHog
PostHog is an all-in-one product analytics platform that includes session recording, A/B testing and other features to track user behavior in your app or website.
It is an event-based platform, which means you only pay for the events you track.
PostHog offers a generous 1 million events per month for free, so most smaller users can use it for free.
13. Plausible
Plausibleis a leader in the trend of lightweight, privacy-oriented analytics tools.
It is easy to use and does not collect any personally identifiable information, making it ideal for complying with the E.U.’s General Data Protection Regulation (GDPR). This comes at the cost of functionality.
Plausible, and tools like it, only track very basic website metrics like pageviews, session duration and referrer information. It is a good option for content and marketing teams who just want easy-to-use, basic website analytics.
Plans start at $9.
14. Fathom
Fathomis another privacy-focused analytics tool like Plausible.
It doesn’t have the deeper features of GA4, but it’s a solid choice if you want a lightweight website analytics tool.
Plans start at $14.
15. Counter
Counter is an open-source analytics tool that uses a “pay what you want” model.
As with Plausible and Fathom, it is privacy focused and has very basic features and measurements.
The big difference between it and the previous two entries is you can’t drill down deeply into individual page performance. However, it is free.
@media screen and (min-width: 800px) { #div-gpt-ad-3191538-7 { display: flex !important; justify-content: center !important; align-items: center !important; min-width:770px; min-height:260px; }
}
@media screen and (min-width: 1279px) { #div-gpt-ad-3191538-7 { display: flex !important; justify-content: center !important; align-items: center !important; min-width:800px!important; min-height:440px!important; }
}
About the author
Constantine von Hoffman is managing editor of MarTech. A veteran journalist, Con has covered business, finance, marketing and tech for CBSNews.com, Brandweek, CMO, and Inc. He has been city editor of the Boston Herald, news producer at NPR, and has written for Harvard Business Review, Boston Magazine, Sierra, and many other publications.
TikTok invites creators to make ads for marketers in new pilot
TikTok is testing a new feature that connects advertisers and creators in a financially beneficial way for both parties.
Under the new program, titled TikTok Creative Challenge, marketers can share ad briefs with relevant U.S.-based creators, who will then have complete creative freedom to make a video entry for consideration.
Should their submission get approval from the marketer, that creator will then receive payment based on the video’s performance.
Why we care. Advertisers will have access to influencers with already established followings and a deep understanding of the TikTok audience. Not only will this type of collaboration potentially give brands better insight into their target audience, which could result in higher engagement, but the fee they have to pay is dependent on ad performance, which reduces financial risk.
How it works. The TikTok Creative Challenge is an in-app feature that creators must sign up for. Once enrolled, they will have access to briefs posted by marketers, which should include reward pool details, rules and requirements.
Here’s a step-by-step breakdown of what happens next:
If creators are interested in applying to a marketer’s brief, they will need to submit a video entry that meets the requirements specified in the ad.
For each brief, advertisers will receive up to 30 ad creatives within 10 days.
Should advertisers wish to ask creators for revisions or modifications, they have the option to notify them.
If the final entry is given the green light, approved videos will run as ads on the For You feed.
Videos will not be displayed on the creator’s profile.
Creators will be able to track the performance of their submissions on the in-app feature, including views and monthly earnings.
⭐️TikTok Creative Challenge⭐️ A new way for creators to collaborate with brands with full creative freedom! We’re excited to continue recognizing and rewarding creators for their creativity through this new in-app feature.
How much will advertisers need to pay creators? Rewards will differ from project to project as multiple variable factors are considered, such as:
Qualified video views.
Clicks.
Conversions.
However, creators will not just benefit financially from signing up to this feature. Once enrolled in the TikTok Creative Challenge, they will also have access to a number of rich resources, including a dedicated Creator Community group and a Mentor Program to connect with other creators.
The rules. Content creators wishing to take part in the TikTok Creative Challenge must adhere to certain rules and regulations set out by the platform:
Creator must be at least 18 years old.
Creator must also have a U.S.-based account.
Creator needs to have a minimum of 50,000 TikTok followers.
All videos submitted for the TikTok Creative Challenge must abide by the platform’s Community Guidelines.
Videos should be high-quality, well-edited, original content.
Get the daily newsletter search marketers rely on.
What has TikTok said? TikTok explained via a statement posted in its digital Newsroom that the TikTok Creative Challenge is aimed at helping all parties involved – however, the initiative remains a pilot for now, which is still under review:
“TikTok Creative Challenge is currently in testing as we explore this new solution with select brands.”
“We will continue to listen to the feedback of our community to further develop the program and continue to make it easier to advertise and drive results on TikTok. We’re committed to working with our community to bring new features that enrich the TikTok experience and look forward to continuing that journey with the TikTok Creative Challenge.”
“TikTok Creative Challenge provides brands with authentic, high-performance and easy-to-use creative content at scale to help drive their performance advertising campaigns.”
“By simply creating a creative challenge on the platform, advertisers are given up to 30 ad creatives within 10 days created specifically for the TikTok audience developed by creators who truly understand the community.”
Deep dive. To find out more about how creators can monetize or collect rewards on TikTok, including Series, Creativity Program Beta, Pulse and LIVE Subscription, visit the platform’s Creator Portal.
@media screen and (min-width: 800px) { #div-gpt-ad-3191538-7 { display: flex !important; justify-content: center !important; align-items: center !important; min-width:770px; min-height:260px; }
}
@media screen and (min-width: 1279px) { #div-gpt-ad-3191538-7 { display: flex !important; justify-content: center !important; align-items: center !important; min-width:800px!important; min-height:440px!important; }
}
About the author
Nicola Agius is Paid Media Editor of Search Engine Land after joining in 2023. She covers paid search, paid social, retail media and more. Prior to this, she was SEO Director at Jungle Creations (2020-2023), overseeing the company’s editorial strategy for multiple websites. She has over 15 years of experience in journalism and has previously worked at OK! Magazine (2010-2014), Mail Online (2014-2015), Mirror (2015-2017), Digital Spy (2017-2018) and The Sun (2018-2020). She also previously teamed up with SEO agency Blue Array to co-author Amazon bestselling book ‘Mastering In-House SEO’.