Daily Mail ‘set to sue’ Google over Bard copyright issues
Google may soon be facing fresh legal action over copyright issues from the owner of the Daily Mail.
The search engine allegedly has illegally taken hundreds of thousands of the newspaper’s articles to train its ChatGPT rival, Bard.
Daily Mail and General Trust (DMGT), the publishing house owned by Lord Rothermere, has reportedly already sought legal advice and is preparing to officially file a lawsuit against Google imminently, according to the Telegraph.
Why we care. As Pierre Far explained in Crawlers, search engines and the sleaze of generative AI companies, search engines used to give website operators full control over the crawling and indexing of their content. However, the rise of generative AI, built on large language models trained on web content, has changed all that. Many content creators and publishers are not happy about what Google and OpenAI have done and fear this could have detrimental effects.
What has Google done? Google allegedly created a dataset to develop Bard using 1 million articles from news publishers, without their permission or knowledge. It’s claimed that 75% of these stories were lifted from the Daily while the remaining 25% come from CNN’s website.
Get the daily newsletter search marketers rely on.
Why the Daily Mail and CNN? Google allegedly used content created by these publishers because they both summarise articles in bullet points at the top of every story. It’s claimed that the search engine tested Bard’s capabilities by presenting it these bullet point summaries with missing text, then asking the chatbot to fill in the blanks based on the main body of the copy.
What has Google said? Google, DMGT and CNN have all declined to comment on the reports.
More legal troubles. News of this potential lawsuit comes just days after eight plaintiffs in the US, including a best-selling author from Texas, accused Google of illegally using copyrighted content and stealing the personal information of millions of Americans to train its AI products. The individuals filed a proposed class action lawsuit in San Francisco last week, and if Google is found guilty, it could be ordered to pay out $5 billion in compensation.
@media screen and (min-width: 800px) { #div-gpt-ad-3191538-7 { display: flex !important; justify-content: center !important; align-items: center !important; min-width:770px; min-height:260px; }
}
@media screen and (min-width: 1279px) { #div-gpt-ad-3191538-7 { display: flex !important; justify-content: center !important; align-items: center !important; min-width:800px!important; min-height:440px!important; }
}
About the author
Nicola Agius is Paid Media Editor of Search Engine Land after joining in 2023. She covers paid search, paid social, retail media and more. Prior to this, she was SEO Director at Jungle Creations (2020-2023), overseeing the company’s editorial strategy for multiple websites. She has over 15 years of experience in journalism and has previously worked at OK! Magazine (2010-2014), Mail Online (2014-2015), Mirror (2015-2017), Digital Spy (2017-2018) and The Sun (2018-2020). She also previously teamed up with SEO agency Blue Array to co-author Amazon bestselling book ‘Mastering In-House SEO’.
5 Google Analytics 4 ‘flaws’ that you can use to your advantage
Marketers have criticized Google Analytics 4 since it was released in late 2020.
The list of complaints is long – from the move from user tracking to event tracking, to the missing standard reports, and the replacement of bounce rate with engagement rate, to name just a few.
GA4 is the predominant platform for measuring website performance and user behavior. (This is partly because it is free, and many competitors disappeared over the years as they couldn’t give away their software at no cost.)
Although some will argue that GA4 falls short in many areas, I believe that many of these perceived flaws are, in fact, true improvements to the product.
This article explores five main criticisms of GA4 and sheds light on how they actually contribute to its improvement.
1. Data discrepancies and disruptions
One primary concern about GA4 is the potential for data discrepancies and disruptions. This also happened in 2012, when users were forced to change from the original Google Analytics (GA2) to Universal Analytics (GA3, AKA UA).
With each iteration, the method used by any analytics tool for calculating unique users and sessions changes. This is to measure more accurately these critical data points used in virtually all key performance indicators (KPIs).
Critics argue that the new data model and measurement protocol lead to inconsistencies, making relying on GA4 for accurate reporting difficult. This is a flaw in their logic.
By not understanding the differences, they assume it is inaccurate, while the reality is that it is more accurate than UA.
This is why analytics professionals (like myself) have been advocating for businesses to enable GA4 for well over a year now. This ensures you have a full year of data for meaningful comparisons (comparing GA4 vs. UA with over a year of data).
For various reasons, many organizations waited or didn’t bother to review the configuration until the last minute to ensure correct data collection. They are now faced with a great challenge when conducting period comparative analysis.
Users must embrace this opportunity, revisit their measurement plans and adopt a more comprehensive and holistic approach to data analysis. With GA4, organizations can leverage multiple data sources (through third-party data imports) and integrate them to gain a deeper understanding of their users and their journey, which was nearly impossible with UA.
2. Learning curve and interface complexity
GA4 introduces a revamped user interface and a different approach to reporting, leading to a steep learning curve for many users.
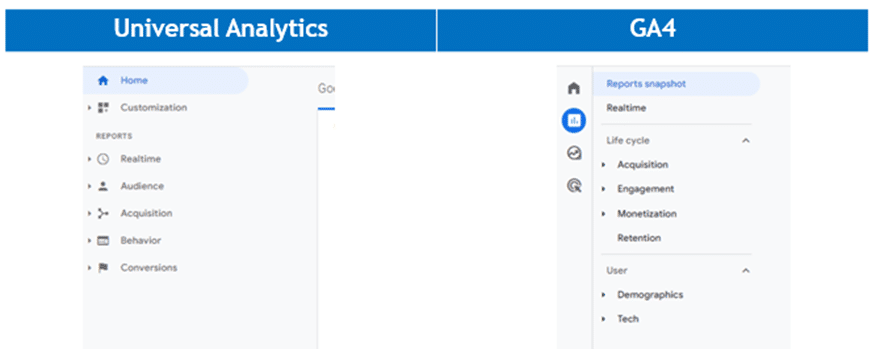
Any change in a UI is difficult. GA4’s UI has been completely overhauled with no similarities to its predecessor. Critics argue that the complexity of the new interface hinders its adoption and usability.
This should not be a surprise to any user. Most software upgrades to new versions come with a new UI. With any new UI, there is always a learning curve.
The redesigned interface reflects a shift toward a more user-centric approach. It empowers all users (marketers and analysts) to explore data in a more intuitive and customizable manner, enabling deeper analysis and uncovering hidden patterns.
The new customizable interface lets you make the GA4 interface truly your own. Remove reports that do not apply to your business. Add custom reports that are tailored to your organization. Organize and group reports into meaningful categories. (No need to learn how Google thinks reports should be named or grouped!)
While the initial learning curve may be daunting, the long-term benefits of improved data interpretation and actionable insights and a fully customizable interface far outweigh this temporary inconvenience.
3. Limited historical data
Another critique of GA4 is its limited compatibility with historical data from UA. Users argue that this limitation hampers the ability to conduct meaningful trend analysis and track long-term performance accurately.
This is not new.
The same attitude was taken when GA migrated to UA. Back in 2012, there wasn’t an option either to port old data into the new measurement logic of UA. This left businesses with comparing apples to oranges (before and after the change) in their data.
Many analytics professionals have long advocated and argued that there was little analytics insight to gain from revisiting data more than a year old and most certainly over two years old. The pandemic’s impact on many businesses makes comparing year-over-year data meaningless, and so does comparing the past months to the same period from three or four years prior.
Websites and apps have been updated, marketing strategies modernized and the global economy and user preferences have changed. Unless your reporting considers this, simply reporting users, sessions and even sales numbers out of context was and still is meaningless.
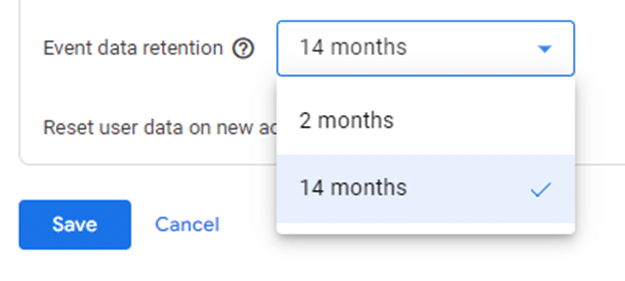
The new maximum GA data storage limit of 14 months is disconcerting compared to the previous “unlimited” option. To address this issue, Google has given all accounts a free BigQuery (data warehouse) account. By storing your data here, you still get virtually an unlimited time frame of storage.
Granted, configuring and using BigQuery is not simple. It entails a steep learning curve and time commitment that is beyond many Google Analytics users, especially those without their own data team.
With limited historical data, you must reevaluate your approach to measurement. How are you going to evaluate success? Adopting GA4 enables us to revisit our data collection strategies and redefine KPIs.
This shift prompts a fresh perspective on data analysis, focusing on real-time and forward-looking insights rather than relying solely on historical trends. Consequently, we can better align strategies with current market dynamics and adapt swiftly to changing consumer behavior.
While digital analytics helps evaluate marketing performance, it is far more effective at generating questions than answering them. Reviewing your analytics for user behavior changes — and then investigating why — yields greater value than simply using it to validate campaign effectiveness.
4. Reduced customization options
GA4 offers a more streamlined approach to event tracking and customization compared to its predecessor.
Critics claim that this reduction in customization options (custom reports only) limits the ability to track specific user actions and tailor analytics to individual business needs. However, this apparent flaw ushers in a new era of efficiency.
GA4 enables marketers and analysts to focus on the most critical metrics and outcomes by simplifying event tracking. It forces us to reevaluate our tracking requirements and prioritize the metrics that truly matter, leading to more concise and actionable insights.
The reduced customization options promote a more standardized approach to analytics, facilitating benchmarking and industry-wide comparisons.
Despite critics’ claims of a reduction in customization, GA4 does offer greater levels of customization to the UI.
You can (using the library feature) completely customize the user interface and add any number of custom reports and report sections.
With a little effort, the entire UI can be customized to your business needs.
By doing so, commonly required reports become easily accessible.
Reports that were never used can be removed from the UI.
The result is faster access to data yielding greater productivity.
5. Privacy concerns and consent management
With the growing emphasis on user privacy, GA4’s stricter data collection and consent management mechanisms have drawn criticism. Critics argue that the enhanced privacy measures limit the availability of data for analysis and hinder marketers’ ability to understand their audience fully.
However, this perceived flaw is crucial to building trust and transparency. By embracing privacy-centric practices, businesses can strengthen their relationships with users and establish themselves as ethical data stewards.
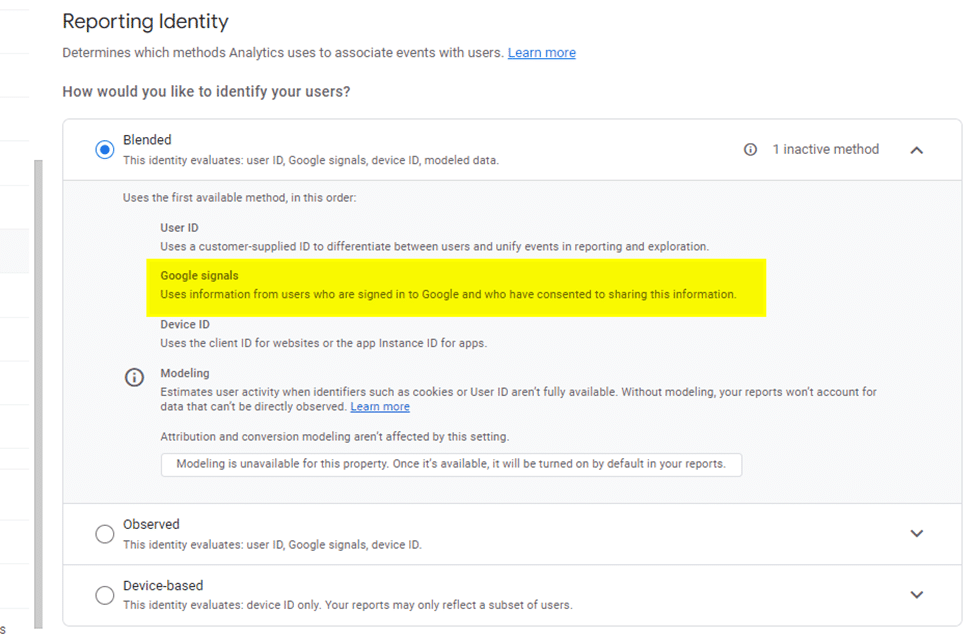
As part of the migration to GA4, website and app privacy policies must be reviewed. For sites that have enabled Google signals as part of the “Reporting Identity” and operate under the legal aspects of GDRP, this review is critical.
Embrace changes in your measurement approach
Once you get past the initial surprise of the new interface and understand why the top five complaints about it are actually positive improvements, you will likely begin to appreciate GA4.
While items are missing from the standard features, there is hope that Google will add these back in a future release. (The annotation tool and ability to save predefined segments from standard reports are missed by users.)
Although many marketers widely consider the rollout of the GA4 upgrade as “one of the worst ever,” it brings improvements that will likely be embraced by most users within a few months.
Opinions expressed in this article are those of the guest author and not necessarily Search Engine Land. Staff authors are listed here.
@media screen and (min-width: 800px) { #div-gpt-ad-3191538-7 { display: flex !important; justify-content: center !important; align-items: center !important; min-width:770px; min-height:260px; }
}
@media screen and (min-width: 1279px) { #div-gpt-ad-3191538-7 { display: flex !important; justify-content: center !important; align-items: center !important; min-width:800px!important; min-height:440px!important; }
}
About the author
Alan K’necht an independent SEO, social and analytics consultant, a public speaker, award-winning author and a corporate trainer (SEO, social media marketing and digital analytics).
Threads is adding branded content tools to create paid promotion opportunities
Threads is implementing branded content tools to give marketers access to paid promotion opportunities.
Meta’s new social platform doesn’t serve ads yet. However, this feature will enable brands to explore the possibility of running influencer campaigns.
Why we care. Meta is waiting until Threads reaches a critical mass before selling ad space, which is proving a little frustrating for brands wanting to be one of the first to advertise on the fastest-growing social app in the world. With that in mind, paid promotion opportunities could be an effective way for brands to connect with the Threads audience in the meantime, in a way beyond creating organic posts.
Following Instagram’s lead. Threads has adopted the terms of services implemented by its Meta sister platform, Instagram. The terms include guidance regarding sponsored content. Under these guidelines, Threads has to ensure that:
Brands use Instagram’s branded content tools when they work with influencers on sponsored content.
Only eligible brands have access to paid partnership labels to posts.
Why now? Marketers are eager to ensure that their brands are one of the first to establish their voice and identity on Threads, while it’s still one of the world’s most talked about social apps.
More than 100 million people signed up to Threads in its first week, and marketers are desperate to start reaching the platform’s users in the most effective way possible while it’s still trending.
Deep dive. Read our Threads FAQ guide for a more in-depth overview of the new platform.
@media screen and (min-width: 800px) { #div-gpt-ad-3191538-7 { display: flex !important; justify-content: center !important; align-items: center !important; min-width:770px; min-height:260px; }
}
@media screen and (min-width: 1279px) { #div-gpt-ad-3191538-7 { display: flex !important; justify-content: center !important; align-items: center !important; min-width:800px!important; min-height:440px!important; }
}
About the author
Nicola Agius is Paid Media Editor of Search Engine Land after joining in 2023. She covers paid search, paid social, retail media and more. Prior to this, she was SEO Director at Jungle Creations (2020-2023), overseeing the company’s editorial strategy for multiple websites. She has over 15 years of experience in journalism and has previously worked at OK! Magazine (2010-2014), Mail Online (2014-2015), Mirror (2015-2017), Digital Spy (2017-2018) and The Sun (2018-2020). She also previously teamed up with SEO agency Blue Array to co-author Amazon bestselling book ‘Mastering In-House SEO’.
Amazon Prime Day 2023 sets U.S. sales record: $12.7 billion
Amazon Prime Day 2023 broke records to become the retailer’s most successful to date.
The two-day event, which took place on July 11 and 12, saw year-on-year spending shoot up by 6.1% to $12.7 billion in the U.S., according to Adobe Analytics data.
Prime members splashed out on more than 375 million products worldwide and saved over $2.5 billion on Amazon’s discounted deals.
Why we care. Amazon Prime Day is soaring in popularity and with such a high footfall of traffic, it’s an excellent time for marketers to advertise and optimize on the platform for maximum reach. For those advertising on Amazon already, it may be worth considering increasing ad spend. The bi-annual event provides brands with the opportunity to not only strengthen their relationship with existing customers but also reach and attract new ones, which could potentially help drive brand awareness and result in a higher ROI.
What categories reported the biggest increase in sales? Surges in spend were reported across several categories by Adobe. In comparison to average daily sales in June:
Appliance sales increased by 52%
Toy sales increased by 27%
Apparel sales increased by 24%
Electronics sales increased by 12%
Stationary and office supplies sales increased by 76%
“Prime Day has become one of the biggest e-commerce moments of the year, as consumers latch onto major discounts from a number of different retailers. The record spending shows us that consumers are tapping into their inner bargain hunters, stocking up on specific categories such as electronics and apparel while the discounts remain steep,” said Vivek Pandya, lead analyst at Adobe Digital Insights.
Get the daily newsletter search marketers rely on.
What discounts were offered? Amazon offered discounts across all categories of its product portfolio – although not all products were included:
Electronics were discounted by up to 16%
Apparel was discounted at 13%
Toy were discounted by up to 15%
Sporting goods were discounted at 9%
Furniture was discounted at 7%
Additional findings. In addition to identifying how much customers spent, the Adobe Analytics report also identified how customers are changing their buying process:
Buy Now Pay Later (BNPL) orders were up 19.5% year-on-year and accounted for 6.4% of all online orders.
BNPL generated $461 million in revenue.
BNPL was primarily used for products purchased in apparel, furniture/home and electronics categories
Smartphone sales were up 42.7% year on year and drove 43.7% of sales
When is the next Amazon Prime Day? Amazon is yet to confirm if there will definitely be a second Prime Day this year. However, last year, in addition to hosting the two-day sale in July, Amazon also hosted one Oct. 11 and 12.
Retail Media Networks. A new force this year, retail media networks (RMNs) also contributed to Prime Day returns. Traffic referred to retail websites from RMNs increased by more than 70% over last year, according to Salesforce.
“Ads on retail media networks caught consumers’ eyes throughout Prime Day. We saw a huge surge in traffic from this emerging media – making it a critical component of the marketing mix,” said Rob Garf, Salesforce’s VP and GM of retail.
Additional reporting on this story from Chris Wood.
@media screen and (min-width: 800px) { #div-gpt-ad-3191538-7 { display: flex !important; justify-content: center !important; align-items: center !important; min-width:770px; min-height:260px; }
}
@media screen and (min-width: 1279px) { #div-gpt-ad-3191538-7 { display: flex !important; justify-content: center !important; align-items: center !important; min-width:800px!important; min-height:440px!important; }
}
About the author
Nicola Agius is Paid Media Editor of Search Engine Land after joining in 2023. She covers paid search, paid social, retail media and more. Prior to this, she was SEO Director at Jungle Creations (2020-2023), overseeing the company’s editorial strategy for multiple websites. She has over 15 years of experience in journalism and has previously worked at OK! Magazine (2010-2014), Mail Online (2014-2015), Mirror (2015-2017), Digital Spy (2017-2018) and The Sun (2018-2020). She also previously teamed up with SEO agency Blue Array to co-author Amazon bestselling book ‘Mastering In-House SEO’.
Repetitive ads ‘damage brand reputation and purchase intent’
Repetitive advertising on streaming platforms can damage a brand’s reputation, according to a new study.
Overexposure to the same ad campaigns was described as “annoying” and “disruptive” by participants in a new joint study, conducted by IPG’s Magna unit and ad tech firm Nexxen, called It’s All in the Delivery: How Repeating Ads Affect CTV Viewers, Brands and Platforms.
Notably, researchers identified a 16% drop in purchase intent amongst those who had seen the same ad six times or more.
Why we care. Marketers must ensure they are purchasing ad space on platforms with effective technology to manage frequency. By not doing so, they run the risk of overexposing the services and products they want to promote which has been identified as having a negative impact on potential customers. Not only does improper frequency management result in a decline in purchase intent but it can also damage the reputation of a brand.
By the numbers. Although participants who saw the same ad six times reported a 92% recall afterward, demonstrating an incredibly strong brand awareness, there were negative findings linked to the increased frequency:
48% of participants found the ad “annoying.”
33% of participants reported the ad “disrupted” their viewing experience.
83% of participants were convinced the repetition was intentional.
68% of participants blamed the brand for the repetition.
44% of participants blamed the streaming service for the repetition.
Get the daily newsletter search marketers rely on.
What have the researchers said? Kara Manatt, executive vice president of intelligence solutions at Magna, stressed that repetitive ads caused damage to both brands and the streaming platforms, and so called for change. She said:
“The platforms are suffering too, because people also attribute the fact that this is happening to the platform. It really can be so annoying to people and viewers, that they’re willing to find content elsewhere.”
“This really validates the need to be working with trusted partners who have the right technology to help manage frequency. It’s not just the overall frequency. It’s making sure that those six exposures don’t take place in a single show [but rather] takes place in an appropriate cadence over time.”
IPG client, New Balance, took part in the study and said the results highlighted the need for frequency caps. The company said in a statement:
“While these fundamentals are currently part of our buying process, we are eager to hear more in terms of larger advancements in the industry from a broadcaster/publisher perspective that will ultimately create a more optimal user experience.”
About the study. The It’s All in the Delivery report research analyzed the feedback of 1,246 participants, who were exposed to a variety of frequencies of the same ad during a one-hour viewing period. Some were exposed to the same ad six times, while others just once.
@media screen and (min-width: 800px) { #div-gpt-ad-3191538-7 { display: flex !important; justify-content: center !important; align-items: center !important; min-width:770px; min-height:260px; }
}
@media screen and (min-width: 1279px) { #div-gpt-ad-3191538-7 { display: flex !important; justify-content: center !important; align-items: center !important; min-width:800px!important; min-height:440px!important; }
}
About the author
Nicola Agius is Paid Media Editor of Search Engine Land after joining in 2023. She covers paid search, paid social, retail media and more. Prior to this, she was SEO Director at Jungle Creations (2020-2023), overseeing the company’s editorial strategy for multiple websites. She has over 15 years of experience in journalism and has previously worked at OK! Magazine (2010-2014), Mail Online (2014-2015), Mirror (2015-2017), Digital Spy (2017-2018) and The Sun (2018-2020). She also previously teamed up with SEO agency Blue Array to co-author Amazon bestselling book ‘Mastering In-House SEO’.
Google sued for allegedly stealing content, data to train AI products
Google is accused of illegally using copyrighted content and stealing the personal information of millions of Americans to train its AI products.
The allegations were made in a proposed class action lawsuit in San Francisco on Tuesday by eight individuals, who say they are seeking to represent the millions of internet users affected.
If Google is found guilty of violating federal privacy and consumer protection laws, it could owe at least $5 billion in damages.
Why we care. Marketers are widely being encouraged to embrace AI and implement technologies such as ChatGPT and Bard into their strategies. However, if AI products are being developed using content and data that has been taken illegally, this could prove to be problematic, as it runs the risk of potential copyright issues.
What has Google allegedly done? The claimants allege Google has:
Been illegally taking digital content created and shared by millions of Americans.
Been using this private property to train its AI technology, including its chatbot, Bard.
Stolen “virtually the entirety of our digital footprint”, including “creative and copywritten works” to develop its catalog of AI products.
The eight plaintiffs have accused Google of taking a variety of content they shared on social media without permission, ranging from photos on dating websites to playlists saved on Spotify to videos uploaded onto TikTok.
One of the claimants, who is described as a best-selling author from Texas, more specifically accused Google of copying a book they wrote in its entirety to train Bard.
Who is suing Google? There are eight plaintiffs who remain anonymous and are known only by their initials.
The lawsuit was filed by Clarkson Law Firm against Google, its parent company Alphabet as well as Google’s AI subsidiary DeepMind. If Clarkson Law Firm sounds familiar, that’s because it’s the same company that filed a similar lawsuit against OpenAI last month.
What do the claimants want? The plaintiffs want Google to give its users the option to opt out of its “illicit data collection”. They are also asking the search engine to delete its existing catalog of data – otherwise, they say Google should pay the owners of that content “fair compensation.”
Get the daily newsletter search marketers rely on.
What have the claimants said? Ryan Clarkson, managing partner of the Clarkson Law Firm, issued a statement:
“Google harvested this data in secret for years, without providing notice to anyone, much less with anyone’s consent.
“Google does not own the internet, it does not own our creative works, it does not own our expressions of our personhood, pictures of our families and children, or anything else simply because we share it online.”
Tim Giordano, an attorney working on behalf of the plaintiffs at Clarkson Law Firm, told CNN:
“Google needs to understand that ‘publicly available’ has never meant free to use for any purpose.
“Our personal information and our data is our property, and it’s valuable, and nobody has the right to just take it and use it for any purpose.”
What has Google said? Google has denied the claims and described the lawsuit as “baseless.” In a statement, Halimah DeLaine Prado, Google’s general counsel, said:
“We’ve been clear for years that we use data from public sources — like information published to the open web and public datasets — to train the AI models behind services like Google Translate, responsibly and in line with our AI Principles.”
“American law supports using public information to create new beneficial uses, and we look forward to refuting these baseless claims.”
@media screen and (min-width: 800px) { #div-gpt-ad-3191538-7 { display: flex !important; justify-content: center !important; align-items: center !important; min-width:770px; min-height:260px; }
}
@media screen and (min-width: 1279px) { #div-gpt-ad-3191538-7 { display: flex !important; justify-content: center !important; align-items: center !important; min-width:800px!important; min-height:440px!important; }
}
About the author
Nicola Agius is Paid Media Editor of Search Engine Land after joining in 2023. She covers paid search, paid social, retail media and more. Prior to this, she was SEO Director at Jungle Creations (2020-2023), overseeing the company’s editorial strategy for multiple websites. She has over 15 years of experience in journalism and has previously worked at OK! Magazine (2010-2014), Mail Online (2014-2015), Mirror (2015-2017), Digital Spy (2017-2018) and The Sun (2018-2020). She also previously teamed up with SEO agency Blue Array to co-author Amazon bestselling book ‘Mastering In-House SEO’.
Twitter is reportedly blocking links to its new rival, Meta’s Threads.
Reports started surfacing on Monday that Twitter was selectively blocking links to Mark Zuckerberg’s latest social networking app. Users noted that while some links worked, others noticeably did not.
The move means it will be more difficult for people to track down conversations on Threads and locate users’ profiles.
Why we care. Since Threads launched on July 5, the app has become the fastest-growing social media platform in history and trending regularly on Twitter. Experts believe the decision to block selected links to Threads in Twitter search results is an attempt to keep users engaged on the platform rather than move away to its rival.
What have people said? American technologist and blogger, Andy Baio, was one of the many people on Twitter to notice that selected links to Threads weren’t working. He confirmed the problem after conducting a search query using the operator “url:threads.net”. After this search failed to serve any results, he shared his findings on Threads:
“Twitter is selectively blocking searches for tweets that link to Threads, even though they allow posting Threads URLs (for now).”
However, Baio shared a technique that users can implement to prevent the block:
“Clever workaround via @kepner, you can quote the domain name and remove the period to bypass the block.”
“Adding “filter:follows” and clicking Latest will show you everyone you follow who has posted links to Threads.”
In an exchange with The Messenger, Baio described the move by Twitter as “anti-competitive”. He said:
“Hiding tweets about Threads seems fully in line with Twitter’s new anti-competitive stance, creating a fully walled garden that blocks open expression while hypocritically claiming to promote free speech.”
Why now?
What has Twitter said? Twitter is evidently taking people’s concerns extremely seriously. So much so, the platform responded to our request for comment with a poop emoji, perhaps indicating that it is now in fight or flight mode in response to Thread’s soaring popularity.
Twitter owner Elon Musk has also addressed the increasingly tense rivalry between himself and Meta CEO Zuckerberg. Earlier this week, when Threads sign-ups surpassed the 100 million mark, the billionaire tweeted “Zuck is a cuck.”
He then reassured his loyal army of followers that he is not remotely threatened by Zuckerberg by proposing “a literal d*ck measuring contest”. In case anyone was confused by the word “measuring,” he added an emoji of a ruler for clarification.
Get the daily newsletter search marketers rely on.
Twitter blocks unregistered users and Google Search. It seems Musk isn’t trolling his good friend Zuckerbeg, he may have his finger hovering over the block button as in addition to restricting links to Threads, he also blocked unregistered users and Google Search last week. As a result, there was a 62% drop in index saturation by Google of Twitter.com.
This was another move by Twitter that may be of huge concern to marketers as it could impact reach for brands that may rely heavily on visibility in Google Search. It also means that some older tweets which may have historically always ranked well in Google Search, may see a dive in rankings and therefore reach and CTR.
Deep dive. During Threads’ first two days of operation, Twitter traffic was down 5% in comparison to the same period a week earlier. It was also 11% down compared to the same period a year earlier. Read the full SimilarWeb analytics report to find out how Twitter and Threads are competing against each other.
@media screen and (min-width: 800px) { #div-gpt-ad-3191538-7 { display: flex !important; justify-content: center !important; align-items: center !important; min-width:770px; min-height:260px; }
}
@media screen and (min-width: 1279px) { #div-gpt-ad-3191538-7 { display: flex !important; justify-content: center !important; align-items: center !important; min-width:800px!important; min-height:440px!important; }
}
About the author
Nicola Agius is Paid Media Editor of Search Engine Land after joining in 2023. She covers paid search, paid social, retail media and more. Prior to this, she was SEO Director at Jungle Creations (2020-2023), overseeing the company’s editorial strategy for multiple websites. She has over 15 years of experience in journalism and has previously worked at OK! Magazine (2010-2014), Mail Online (2014-2015), Mirror (2015-2017), Digital Spy (2017-2018) and The Sun (2018-2020). She also previously teamed up with SEO agency Blue Array to co-author Amazon bestselling book ‘Mastering In-House SEO’.
How to deliver PPC results to executives: Get out of the weeds
Executives have much on their plate and little time to get through it all.
When presenting PPC results to a CMO or VP of marketing, many marketers make the mistake of diving too far into the weeds of their work.
Tailoring your delivery to your audience is crucial for any communication, whether it’s a presentation, an email or a report.
Here are three ways to make your next delivery to an executive successful.
1. Start with a straightforward takeaway
There are instances where “save the best for last” is great advice. Presenting to executives is not one of them.
Executives are busy, and as a result, they’re often impatient. They need the CliffsNotes version, not the unabridged edition.
They need to know right off the bat what the takeaway should be.
In order to give them that takeaway, you first need to figure out what it is. My formula for the perfect takeaway has three primary parts:
What did you do?
What happened? (Tie this back to the main goals of the project or business if not readily apparent.)
How should your audience feel about it and what you’re doing next?
Once you have these three elements, you have your default opener.
Your takeaway should start things off, whether it’s the first sentence of your email, the abstract of your report, or the opening slide of your presentation.
The beauty of this format is that it hits all the main points while limiting your ability to wax poetic about your process or secondary metrics that don’t actually matter to someone with a VP title.
The executive needs to know what you did, but they usually don’t need to know how you did it.
They need to know the results, but only as far as they affect the primary KPIs.
And they need to know how they should feel about it and what comes next.
Here is an example takeaway:
We launched Performance Max campaigns at the beginning of last month.
In the past eight weeks, these campaigns drove more leads at a lower cost than legacy campaigns. Notably, an 8% lower cost per acquisition and a 4% higher conversion rate.
These are great early results that we expect to improve on in the coming months by launching additional Performance Max campaigns.
Get the daily newsletter search marketers rely on.
This takeaway starts out by “naming” the project, so the executive can reference it later if needed.
It tells how the results affected the primary KPI (leads, in this case), even if the metrics we’re reporting on are tangentially related (CPA and CR).
And finally, since it’s a rare Executive that would know that a 4% increase in Conversion Rate in PPC is amazing, it tells them that these are really good results and what comes next.
2. Use data to support your takeaway, not distract
Now that you have your main takeaway, you have some clear direction about what should come next.
When it comes to selecting which data and graphics to include in your reports, use the following checklist.
Does my data visualization reference the metrics in my takeaway?
Use the metrics in your takeaway to guide the data you select. This ensures that the data you show is directly relevant to your main point.
It also helps you identify and rule out data that may be tangentially fascinating but doesn’t directly tie to what you’re trying to say.
Any charts or tables that don’t directly relate to your takeaway should be relegated to the appendix or shared later as supplementary,
Does my data visualization show where to look?
Data and charts can quickly get overwhelming, and executives need to know, at a glance, what’s important.
Visual representations should be included to help your audience understand data quickly, not muddy the waters.
Use arrows, callouts, highlights, and text to show exactly where someone’s attention should go. This is especially important if you include a table with multiple rows and columns.
Does my data visualization clearly say one thing?
A data chart should only convey one major point to avoid obscuring or overshadowing your takeaway.
You might be tempted to fall into the “more is better” trap, but resist the temptation.
Remember that successful results mean tailoring your presentation to your audience.
When your audience is executives, they need to know immediately why you are including a chart and what they should take from it.
This means that you need to be ruthlessly stingy when evaluating how necessary metrics are, and generous in creating new visualizations for each point.
If complex visualizations are necessary, use highlights, arrows, and callouts to draw attention to the part that really matters.
3. Run it by a colleague from another team
“The medium is the message” is a concept coined by communication theorist Marshall McLuhan.
He asserts that the way a message is delivered determines how that message will be received.
This means how you verbally present your slides is just as important as the content on your slides.
The words in between the data in your email determine how the data is accepted by the reader.
The style and delivery of your report matters as much as what the report is trying to say.
Even if you follow the above steps and know what you want your message to be, it can be difficult to know if it’s coming across the way you mean it to.
You can feel like you’re at the pinnacle of brevity compared to your usual delivery.
Still, it can come off as rambling and confusing to executives who don’t interface with you regularly and have no point of comparison.
To help evaluate the medium of your message and to ensure it makes sense to an executive, run your presentation or report by a colleague who is not knowledgeable about PPC and ask for specific feedback, such as:
Is your takeaway clear?
Is the main point evident quickly?
Does the data clearly support your main point?
Is there “fluff” that can be removed or seems superfluous?
Does it feel too long?
If it’s a verbal presentation
Are your transitions from slide to slide seamless?
Do you use acronyms and not explain what they stand for?
Is the information organized in an easy-to-follow format?
If it’s a written report
Are there too many conjunctions?
Did they have to read any sentences twice?
Make sure to time yourself, too.
Shorter is better, and a time/word limit, even a self-imposed one, can help you rule out items that aren’t directly relevant and remove unnecessary wordiness.
Presenting your work to people who matter
If these suggestions seem like extra work, it’s because they are.
Presenting to executives means presenting to the most influential people at a company and requires different preparation.
These people can move your ideas forward or stop them in their tracks.
As nerve-wracking as it can be to deliver results to senior leadership, it can also open doors and opportunities if you nail it. Remember: stay succinct and stay out of the weeds.
Opinions expressed in this article are those of the guest author and not necessarily Search Engine Land. Staff authors are listed here.
@media screen and (min-width: 800px) { #div-gpt-ad-3191538-7 { display: flex !important; justify-content: center !important; align-items: center !important; min-width:770px; min-height:260px; }
}
@media screen and (min-width: 1279px) { #div-gpt-ad-3191538-7 { display: flex !important; justify-content: center !important; align-items: center !important; min-width:800px!important; min-height:440px!important; }
}
About the author
Ann Robison has been in the digital marketing industry for over a decade, starting with writing meta descriptions for Google’s then-new Panda update. She currently serves as the Client Services Manager at Portent, a digital marketing agency. She has a strong background in PPC, Paid Social, and digital marketing strategy across B2B and B2C verticals, from Fortune 500 companies to one-woman shows. Robison also provides free-lance consulting to small businesses on digital marketing strategy and analytics. When not working, Robison spends time with family, sings jazz with her local vocal jazz group, and dreams up new adventures for her D&D group.
How to track Performance Max campaigns with Google Apps Script
If you manage ecommerce PPC accounts in Google Ads, you likely have used Performance Max campaigns since mid-2022. You also know that the insights and reporting are limited.
We can’t control how much of our budget goes to top-of-funnel strategies like video, display and discovery campaigns.
We can’t see how that spend is broken out through Google’s automation.
Learn how to overcome this hurdle using Google Apps Script to pull data on campaign spend breakout and glean insights to improve performance and impress your clients and team.
Why use Apps Script in Google Ads, Performance Max?
Apps Script is a Google tool enabling you to automate actions in Google Ads using JavaScript code in your account. (Don’t worry, no coding experience is needed for this guide!) This saves time and simplifies management.
Due to a lack of control and insights from Performance Max, some advertisers opt to use standard Shopping campaigns.
While the Insights tab in Google Ads shows audience insights, search term insights and general performance, it does not include the breakout of spend or impressions by campaign type.
If you see high impressions on a campaign or asset group with similar clicks to other campaigns or asset groups, you can only assume that video or display campaigns (awareness-based campaigns with high impressions) were shown over search or Shopping ads.
A script to monitor performance
Mike Rhodes was kind enough to create and share a script with the digital marketing community through GitHub. The most recent version is the 24th, released in April 2023.
Now grab the URL of your sheet and enter it below in the line that starts with let ss =. Put the URL between the single quotes.
Next name your script: “YOUR CLIENT”: pMax Charts
Name your sheet: “YOUR CLIENT” – pMax charts v24 (updates daily)
Google will then ask you to authorize the script to access your Google Ads account. Please note that this won’t change or update your ads in any way. It will only extract the data to send to Google Sheets.
Once authorized, save and run your script!
You want to set up your script to run daily. I recommend running it early morning when you won’t be in the Google Ads system.
Insights from the report
Now that you have your report running, you can pull insights from the report. The report shows only the past 30 days.
One great thing is to see how Google prioritizes campaign types.
In the example below, you will see that consistently for the past 30 days, this campaign has allocated 100% of its cost toward Shopping ads. Please note that “Other” is predominantly search ads.
This can signal that the products in this category consistently show Shopping ads as the top-of-page results on the SERP.
In the example below, on the same account, you will see that the campaign shows a majority of Shopping ads with the budget, but it also shows search and video.
Try making test searches to see if these searches for the products in this particular campaign show consistent Shopping results at the top of the SERP or if the results are often search ads. This can explain the lower Shopping distribution.
Another thing that may signal this is the ROAS. If you are using tROAS on the campaign and are consistently below the target, Google may try different campaign types to hit that tROAS if it recognizes that Shopping ads will not accomplish that.
Optimizations from insights
Use these insights and predictions to run tests!
In the first example, where all spend went to Shopping, try pushing the limits of what ROAS you can achieve by incrementally increasing your Target ROAS bid.
In the second example above, try decreasing your Target ROAS bid to see if the Shopping ad spend distribution increases.
I recommend only increasing in increments of 25-50% to avoid causing a sudden drop in performance.
In the example below, you will see that the week of May 7, we increased our ROAS target too drastically.
It caused our performance to plummet, signaled by a sharp increase in impressions due to Video ads being shown.
Using this tool, we were able to track the allocation daily and return our ROAS target to its original goal.
The report also has tabs with table views of data by campaign and asset groups.
Beyond that, there are tabs with charts showing asset group performance by:
Impressions
Cost
Conversion Value
Below is an Asset Group report by Impressions from a campaign with four asset groups. The In Market / Affinity audience receives many more impressions than its counterparts.
You’ll want to investigate the first chart again. Does this campaign have high video or display spend allocation? Could that explain the high impressions on that particular asset group?
You’ll also want to check the chart report by asset group. You will see the high impressions on In Market/ Affinity, but we also see the lowest cost per acquisition of any asset group in that campaign!
Now use this information to update audience signals across other campaigns that match this asset group, and do the same with your assets.
Filling the data gaps through scripts
Try other available scripts based on your clients’ needs and learn Google Apps Script to build your own.
As Google pulls back data and control from marketers, there are ways we can fill the gaps in data by using scripts shared throughout the digital marketing community.
Opinions expressed in this article are those of the guest author and not necessarily Search Engine Land. Staff authors are listed here.
@media screen and (min-width: 800px) { #div-gpt-ad-3191538-7 { display: flex !important; justify-content: center !important; align-items: center !important; min-width:770px; min-height:260px; }
}
@media screen and (min-width: 1279px) { #div-gpt-ad-3191538-7 { display: flex !important; justify-content: center !important; align-items: center !important; min-width:800px!important; min-height:440px!important; }
}
About the author
Andrew Wirtz is Senior PPC Strategist at Portent, a full-service digital marketing agency. Andrew covers topics on paid search, shopping and more. Prior to Portent, he was a Digital Marketing Strategist at Spectrum Communications and is a graduate of UIUC. You can find Andrew on Linkedin to ask questions or discuss PPC news!
Maximizing brand impact with Amazon’s video advertising: A comprehensive guide
Video advertising is a powerful tool for brands looking to engage audiences and drive conversions.
Among the digital advertising giants, Amazon has cemented its position with a versatile suite of advertising solutions that cater to diverse marketing goals and audience demographics.
This guide covers Amazon’s video advertising solutions and how brands can leverage them to enhance their digital advertising strategies.
Understanding Amazon’s video advertising solutions
Amazon offers a range of video advertising options, each with distinct features and benefits.
Amazon provides versatile tools to reach your target audience effectively. Choices include:
In-stream video ads
In-stream ads are commercials that play before, during, or after the viewer’s selected content on Amazon-owned sites and apps, such as Amazon Prime Video, IMDb, Twitch, and Fire TV.
These ads are an excellent platform for extending reach, enhancing brand visibility, and driving customer engagement.
Out-stream video ads
Out-stream ads are displayed on Amazon’s ad-supported third-party websites and apps.
Unlike in-stream ads, out-stream ads start playing when in view and pause when out of view, ensuring a non-disruptive yet engaging ad experience.
Video ads for Amazon Live
Amazon Live offers brands a platform for real-time engagement with potential customers.
This solution is ideal for interactive content such as product demonstrations, tutorials, live launches, and events encouraging viewer participation and feedback.
OTT (over-the-top) video ads
OTT video ads are served on streaming platforms and devices, reaching audiences who have moved from traditional television to digital streaming services.
With precise targeting capabilities, OTT ads can effectively reach a specific audience segment based on their viewing habits and preferences.
Amazon ad-supported tier is in the works
Following Netflix’s massive subscriber losses in 2022, the streaming platform responded by rolling out an ad-supported plan last November. This gives customers a value-priced option in exchange for viewing ads and has been a success.
As of May 2023, almost 5 million global subscribers signed up for the ad-supported tier. It’s a step in the right direction to help overcome last year’s drop in customers and is similar to what other platforms (e.g., Hulu, Peacock, Max) offer.
Amazon is in talks to introduce an ad-supported tier to its Prime Video platform. This should help expand its user base and provide new opportunities to reach additional customers.
While there is currently no scheduled date for the rollout, it’s something to remember when considering your Amazon advertising options.
The unique advantages of Amazon video advertising
Amazon’s video advertising solutions offer unique advantages that set them apart from other digital advertising platforms.
Amazon integrates advertising with its robust ecommerce platform. This seamless integration allows advertisers to link their video ads directly with product pages, enhancing the customer journey from product discovery to purchase.
Amazon’s vast consumer data provides valuable insights for ad targeting. You can use this data to tailor your ads based on the viewer’s browsing history, shopping habits, and demographic profile, ensuring that your ads are displayed to the most relevant audience.
In addition, Amazon offers comprehensive analytics and reporting tools that help you:
Track their ad performance.
Measure the return on ad spend.
Refine their advertising strategy based on data-driven insights.
Get the daily newsletter search marketers rely on.
A 3-step guide to creating successful Amazon video ad campaigns
The process of creating a successful Amazon video ad campaign involves several strategic steps:
Choosing the right solution
The first step is to choose the most appropriate Amazon video ad solution based on your brand’s marketing objectives, target audience, and budget.
Each solution offers different benefits, which can help you make an informed choice.
Creating compelling content
A video ad’s effectiveness largely depends on its content’s quality and appeal. Brands should strive to create high-quality video content that is clear, concise, and compelling.
The video should clearly convey the brand message, include a strong call to action, and engage the viewer’s attention and interest.
Setting up the campaign
Once the content is ready, the next step is to set up the ad campaign on Amazon’s advertising platform.
This involves defining the campaign parameters such as the campaign name, daily budget, start and end dates, targeting strategy, and bidding strategy.
Measuring and optimizing video ads
The success of an Amazon video ad campaign depends on its setup and execution, along with continuous monitoring, measurement, and optimization.
Amazon provides detailed metrics that help you understand ad performance.
Key performance indicators such as impressions, clicks, view rate, and conversion rate provide insights into audience engagement and the ad campaign’s effectiveness.
Based on these metrics, brands can identify areas of improvement and make necessary adjustments to their ad content, targeting strategy, or campaign settings.
For example, if the view rate is low, brands may need to improve the quality or appeal of their video content. Brands may need to refine their call to action or linking strategy if the conversion rate is low despite a high view rate.
Moreover, brands should consider conducting A/B testing to compare the performance of different versions of their video ad. This can provide valuable insights into what works and what doesn’t, allowing brands to improve their video ad campaigns for better results.
Reaching your audience with Amazon video ads
Video advertising has become integral to effective digital marketing strategies as the digital landscape evolves. Amazon’s video advertising solutions provide brands with versatile and powerful tools to reach their target audience, engage their interest, and drive conversions.
By understanding these solutions and leveraging them effectively, you can enhance your brand’s digital advertising efforts, achieve marketing goals, and stay ahead in the competitive digital marketplace.
Opinions expressed in this article are those of the guest author and not necessarily Search Engine Land. Staff authors are listed here.
@media screen and (min-width: 800px) { #div-gpt-ad-3191538-7 { display: flex !important; justify-content: center !important; align-items: center !important; min-width:770px; min-height:260px; }
}
@media screen and (min-width: 1279px) { #div-gpt-ad-3191538-7 { display: flex !important; justify-content: center !important; align-items: center !important; min-width:800px!important; min-height:440px!important; }
}
About the author
Evan Facinger is a digital marketer with 15 years of experience and is the Director of Sales and Marketing at Foremost Media, a full-service digital marketing and web development agency. Evan has a robust background that includes; Amazon optimization, search engine optimization (SEO), conversion rate optimization (CRO), marketing automation, and pay-per-click management. He has helped hundreds of clients realize their business goals through digital marketing.