10 things to eliminate from your life to be more productive at work

We’ve all seen how work has changed over the past two and a half years. 

Remote work, once rare, became the norm, especially in industries like online marketing which can easily be done remotely.

During the peak of the COVID-19 pandemic, as many as 71% of workers were working remotely.

That said, many digital marketers already worked remotely. 

I’ve been fully remote since 2012 and before that, worked hybrid (mostly remotely) for five years. I know many who have done the same.

Remote work has its benefits and challenges. One of the biggest challenges is productivity.

Being productive while working remotely has always been tricky. There are distractions at home that don’t exist in an office.

I would argue, though, that an office has distractions that don’t exist at home.

Water cooler conversations, impromptu meetings, people stopping by your desk to chat, and an open-office environment – all are distractions that can make workers less productive. 

Add to that the Great Resignation and tech layoffs due to a possible recession, and you might be overwhelmed and find it difficult to be productive no matter where you work.

Not to worry – here are 10 things to eliminate from your life to be more productive at work.

1. Distractions

Whether you’re working from home or in an office, distractions can be a problem. Distractions can come from your surroundings, such as house cleaning, the TV at home or coworkers in the office.

Technology, which is designed to make us more productive, can also be a distraction. 

For example, just now as I was writing this, a meeting reminder popped up on my screen.

Meeting reminders are probably a necessary distraction. But do you really need to be notified every time you get an email or a Teams chat?

Probably not.

Turning off unnecessary notifications goes a long way in reducing interruptions and improving productivity.

I disable email notifications entirely. No flying envelope on the screen, no sound, nothing. I check email at regular intervals but don’t react every time one comes through.

Same thing for Teams or other IM chat notifications. I mute notifications from group chats, treating them like email. Otherwise, my Teams notifications would be going off all day.

Enable only the notifications that are absolutely necessary, and mute or disable the rest.

I leave meeting reminders on because without them I’d never remember all my meetings. But I know people who don’t even have meeting reminders going off. Experiment and decide what works best for you.

2. Multitasking

We’ve all been on a Zoom call where we’ve given in to the temptation to check email or chats. Especially now that so many meetings are happening via technology rather than with people sitting around a table, it’s easy to pop over to Outlook and start reading.

Resist the temptation to multitask.

While you may think multitasking makes you more productive, it actually doesn’t.

Frankly, it’s also rude.

Make every effort to give the meeting your full attention. That way you can focus on any takeaways and to-do’s that might be assigned to you.

And if you find yourself in a meeting that you don’t need to be in, ask to drop. Or decline the meeting invite.

It’s OK to protect your valuable time. Decline meetings that you don’t absolutely need to be in.

And if you’re the one scheduling the meetings, consider whether it needs to be a meeting at all. 

Meeting culture is broken and people will thank you for helping clear their calendar.

3. Working without breaks

Have you ever been so busy that you feel like you need to stay chained to your desk to get everything done?

I sure have.

It’s hard to step away when you have so much to do, so many meetings, and so many people calling, emailing, and IM’ing you. 

Do it anyway.

Taking short breaks improves productivity and helps give you a fresh perspective on the tasks at hand.

I like to walk, and I take short walk breaks a couple of times a day. Outside, if possible.

The fresh air and movement help clear my head.

I’ve often found that the solution to a problem I’d been scratching my head over becomes clear as day when I step away from my desk and get some fresh air.

If you can’t get outside and walk, at least step away from your desk. Walk the hallways of your office or home. Go up and down stairs if you have them. Get your blood pumping.

And don’t forget about lunch breaks.

Many of us work through lunch, concerned that taking 20 minutes to eat will set us behind.

Forget that.

Take a break, even if it’s just for a few minutes to grab a bite and eat it, slowly.

4. Repetitive work

Do you find yourself performing the same task, day after day or week after week?

Pulling reports, checking budget pacing, and reviewing performance are all regular part of any digital marketer’s routine.

But if you find yourself doing repetitive work, see if you can streamline it.

If you have junior staff, delegate!

We have a rule on our team that if a manager finds themselves doing a task more than three times the exact same way, we make a video illustrating how to do the task – and then delegate it to a junior team member.

It’s amazing how much time and effort this has saved our busy managers.

Now, I realize not everyone has someone they can delegate to.

Before we were part of Merkle, I was pretty much running my accounts solo.

If that’s the case for you, don’t fret! See what you can automate.

I think a lot of us forget that we can automate report pulls from Google Ads, Microsoft Ads, Facebook Ads, analytics platforms, bid management platforms and pretty much any tool we’re using to evaluate performance has a way to create automated reports.

Use them. It’s so much easier to react to a report in your inbox than to have to create it from scratch every time.

One more tip – if you’re not familiar with scripts for Google Ads and Microsoft Ads, it’s time to learn and use them.

Scripts can help automate routine tasks and save tons of time.

5. Unnecessary meetings

I’ve mentioned meetings a couple of times already. Meetings are such a big part of many digital marketers’ workdays. 

Often, meetings are necessary and unavoidable. We all have to meet with clients, for example.

But many meetings are just unnecessary, especially now that so many people work remotely.

I worked remotely long before the pandemic. But I noticed my calendar filled up dramatically once everyone else was remote.

It seemed like conversations that previously would have been a quick phone call or email had now turned into a meeting on the calendar. 

And when a meeting is on the calendar, meeting organizers feel like they have to fill the scheduled time.

Resist this temptation.

If you just have a question for someone, call or email them. Don’t schedule a meeting.

If a meeting is necessary, think carefully about who needs to attend. Invite only those who are critical to the objective.

Speaking of objectives – preparing for meetings goes a long way to keeping them productive. 

Every meeting should have an agenda listed in the meeting invite. This helps attendees prepare.

Distribute any materials – reports, screenshots, etc. – ahead of time if possible so people can review them and prepare questions.

Have a plan for the meeting. If you’re leading the call, prepare what you’re going to say, how long you’ll spend on each topic, and what outcomes are needed.

Don’t leave a meeting without outlining next steps. This helps prevent additional meetings.


Get the daily newsletter search marketers rely on.


6. A messy calendar

Whether you use Microsoft Outlook, Google Calendar, Calendly or some other calendar program, getting a grip on your calendar is key to being productive.

Don’t limit the use of your calendar to meetings. I schedule blocks of time to get things done. Otherwise, someone will fill my time with more meetings.

If you use Microsoft Outlook, their Viva tool will actually help you schedule “focus time” where you can block open times to focus on task completion.

And protect your time. Have a set start and end time for your workday, and stick to it as much as you can.

Sure, urgent meetings outside of normal hours can and do happen – sometimes they’re unavoidable. 

But for regular meetings, work with your team/client to see if you can find a time that fits with your schedule so you’re not regularly attending 7 a.m. or 7 p.m. meetings – unless that’s your preference.

7. A messy workspace

What does your workspace look like? Is it neat as a pin, or covered with clutter?

Most of us are probably somewhere in between. But if you can get closer to “neat as a pin,” you’ll find your productivity increasing.

Research cited in the Harvard Business Review “has shown that our physical environments significantly influence our cognition, emotions, and behavior, affecting our decision-making and relationships with others.”

Many people were forced into working remotely when they didn’t really have the right space for it.

I get that. We dealt with that in my own household at the start of the pandemic.

But at this point, if you’re still remote, it’s likely at least partly by choice. So whatever and wherever your workspace is, see if you can clear the clutter. You might be surprised at how much more productive you become.

Yes, we all get news from social media. You probably found this article via a social media link.

In the SEO and SEM space, social media has been around since before it was called social media. I fondly remember the old SEO forums of the early 2000s, where members of the community gathered to ask questions, share news, and just chat with each other.

But constantly checking social media is a real productivity killer.

Instead of keeping Twitter open all day, set times that you’ll look at it. Maybe you only check your feed first thing in the morning, at lunch, and before logging off at night. 

Just don’t stay on there all day. You’ll find you’re much more productive.

9. Pressure on yourself

We all put a lot of pressure on ourselves. It’s human nature.

How many times per day do you think, “I should be able to do all this! Why am I struggling?”

Try to go easy on yourself.

Be realistic about what you can get done in a day. If you’re feeling overloaded, sit down with your manager and lay out all the tasks on your plate.

Ask your manager to help you prioritize. And be clear with them about how long it will take you to complete everything on the list.

As mentioned earlier, set a time to shut down every day. Do not answer emails all day and night.

If you must have work email on your personal phone (and I know this is the reality for many of us), turn off your notifications and do not open your work email app after hours. The emails will be there in the morning.

Search engine marketing is rarely life or death. Aside from emergencies like a website going down, most problems can wait until the next morning. 

10. Self-doubt

Going hand in hand with putting pressure on yourself is dealing with self-doubt. 

Just this week, I had a moment where I felt like I just couldn’t do the task that was being asked of me. 

And I’ve done paid search for more than 20 years.

We hear a lot about imposter syndrome. According to Healthline: 

“Imposter syndrome, also called perceived fraudulence, involves feelings of self-doubt and personal incompetence that persist despite your education, experience, and accomplishments.” 

Try to push past imposter syndrome.

You were put in your job because your supervisor had confidence you could do it. So unless you lied about your qualifications, be confident!

You can do this!

Showing confidence goes a long way not only in increasing your productivity, but making clients feel at ease.

It’s OK to confidently say, “Let me look that up and get back to you.” I say this on calls on a regular basis.

No one expects you to have every answer at your fingertips. Don’t hem and haw – just say you’ll follow up. 

Being more productive leads to better results

I hope you can apply some of these productivity tips to your work life. 

Here’s to eliminating productivity blockers and getting more done with less stress.


Opinions expressed in this article are those of the guest author and not necessarily Search Engine Land. Staff authors are listed here.


Related Stories

New on Search Engine Land

@media screen and (min-width: 800px) { #div-gpt-ad-3191538-7 { display: flex !important; justify-content: center !important; align-items: center !important; min-width:770px; min-height:260px; } } @media screen and (min-width: 1279px) { #div-gpt-ad-3191538-7 { display: flex !important; justify-content: center !important; align-items: center !important; min-width:800px!important; min-height:440px!important; } }

About The Author

Melissa Mackey

Melissa Mackey is associate director of paid search at MerkleB2B. A veteran PPC marketer, she helps clients achieve maximum ROI from paid search. Mackey contributes regularly to several industry publications, writing on PPC strategy. Mackey has spoken at industry conferences such as SMX Advanced, SMX Create and HeroConf.

https://searchengineland.com/things-to-eliminate-from-your-life-to-be-more-productive-at-work-389404


10 Google Analytics 4 settings to check before the holiday season

Technically, you don’t need Google Analytics 4 (GA4) to measure your holiday sales efforts this season because Universal Analytics (UA) is still active.

However, next year at this time UA will no longer be tracking data and the individual accounts will likely be permanently shut down and closed sometime around January 2024. 

From next year on, the only analytics data you’ll have (from a Google-owned analytics platform, anyway) will be from GA4.

GA4 measures website activity very differently from UA, so the only way you’ll get a year-over-year comparison for this holiday season vs. the next holiday season is if you have the latest platform properly configured now. That’s why you should care.

So, here are 10 things you’ll want to make sure are being properly tracked today. 

(Author’s Note: The setup paths listed below are accessed within the GA4 platform itself and you must have Admin privileges) 

GA4 Admin Screen
GA4 Admin Screen

1. Does your ecommerce platform have an easy app or plugin to allow GA4 tracking yet?

Six months ago, robust support for GA4 from platforms (e.g., Shopify, BigCommerce) was not yet available.

Now there are apps out there positioning themselves for easier GA4 support.

Many of them are very new so they don’t yet have a large user base. Do your homework before just installing one of those.

In fact, it might be best to consult with a professional. You need to make sure any app or plugin meets your specific measurement needs.

2. Do you have referral exclusions that need to be added? 

You may have a number of referral exclusions to consider. For example, PayPal, GooglePay, AmazonPay, ApplePay, etc. 

Here is the path to set this up within GA4:

  • Admin > Property > Data Stream > Configure Tag Settings > Show More > List Unwanted Referrals

3. Is there any domain tracking needed?

If your ecommerce site is all one domain, then nope. You’re good to go. 

However, if you have multiple domains, then you better make sure those are properly set up. An example of this would be a site that has the following:

  • https://www.companyname.com
  • https://shop.companyname.com

4. Are you driving traffic via Google Ads?

If so, do you have audiences built in Google Analytics for use in Google Ads? 

Are you importing conversions from Google Analytics into Google Ads? 

It’s a great idea to do so, but if you’re using UA for conversion optimization currently, make sure you list your GA4 audiences as secondary, not primary. 

To connect to Google Ads:

  • Admin > Property > Product Links > Google Ads Links

To connect to Google Merchant Center:

  • Admin > Property > Product Links > Google Merchant Center
Google Ads Link
Google Ads links

5. Which analytics account is your Google Search Console connected to?

You can only connect your Search Console to one analytics account at a time so if UA is your source of truth and primary platform of use for this holiday season, keep it connected there. 

However, if you’re ready to make the full switch to GA4, it’s pretty simple. 

To make that connection:

  • Admin > Property > Product Links > Search Console Links

Get the daily newsletter search marketers rely on.


6. Have you set up your landing page reports?

Landing pages are often recycled for the next year, so for purposes of YOY comparison data, you’ll want to make sure you’re set up for it.  

Here’s how:

  • Reports > Life cycle > Engagement > Pages and Screens > Customize Report (pencil icon in the upper right page)

For a full tutorial, be sure to check out How to Make a GA4 Landing Page in 10 Easy Steps from Search Engine Land contributor Krista Seiden.

7. Have you enabled the ‘enhanced measurement’ options for key events?

In GA4, everything worth measuring is an event. Get used to it and make sure you’re all set. Anything related to conversion path is an event. 

For ecommerce, that includes critical touchpoints like:

  • Site search
  • Product listing view page
  • Product detail page
  • Product video or gallery view
  • Add to cart
  • Payment page visit
  • Confirm order
  • Support page/chat
  • Etc.
Events Setup/Modify
Events Setup/Modify

If your GA4 account does not show any of the above actions as events, then you need to get them set up accordingly. 

Many of the actions you’ll want to track (site search, video views, scrolls, etc.) require the “enhanced measurement” feature to be turned on. 

Additionally, tracking for form submission signups, button, phone and email clicks needs to be set up as custom events.

To enable enhanced measurement:

  • Analytics > Property > Data Streams > Enhanced measurement toggle switch

8. Are your attributions and lookback windows properly set?

While (in the opinion of this author) cookie-cutter attribution models have questionable value in terms of what actually drove the conversion, they are relevant when managing a campaign with multiple touchpoints in a purchase process. 

When it comes to lookback windows, the concept is pretty simple: “How far back in time do you look when measuring what assisted in driving the conversion?” 

A good rule of thumb is 30 days for acquisition-related events and 90 for others. 

Is it perfect? Far from it. 

However, defaulting to 30 days should cover you in most cases (but there are exceptions, of course). 

To ensure your attribution and lookback windows are properly set:

  • Admin > Property > Attribution Settings
Lookback Window
Lookback window

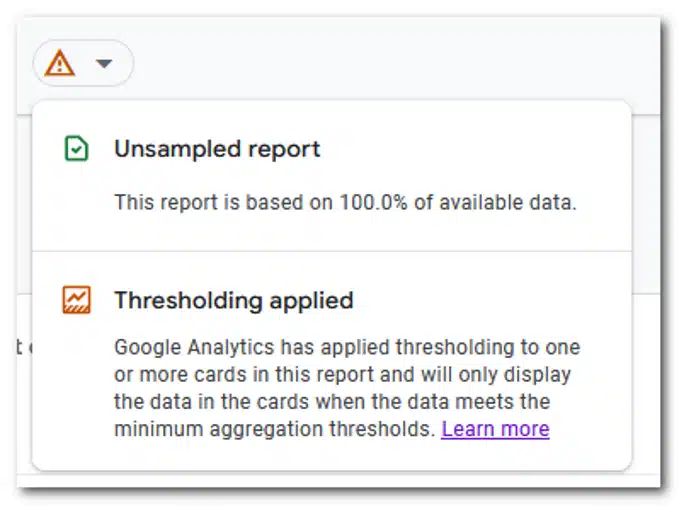
9. Have you looked into GA4’s thresholding issue (smaller accounts)?

What is “thresholding”?

If you have Google signals activated in your GA4 account, you can get session details from sites and apps associated with a Google account. 

While this can be beneficial for understanding user behavior, Google also doesn’t want you to be able to personally identify an individual via GA4. 

For example, if your ecommerce site has a dozen products and gets 10-20 orders per day, there’s a good chance it would be possible to identify an individual user by taking their order information and matching that up with data you can see via GA4. 

If you’ve ever seen thresholding in a GA4 report, it’s terrible. 

Thresholding

The good news is there is a way around thresholding (for now), but you have to know where to look. Here’s where:

  • Admin > Account Settings > Reporting Identity > Show all

Once there, click on “device-based” and that’ll mitigate the thresholding issue:

Reporting Identity
Reporting Identity

10. How will you take annotations?

In UA, the user is able to add an annotation to add critical context to a number. 

For example, bad winter weather may have closed the entire state for a whole weekend causing an abnormal spike in website traffic and conversions while people were stuck at home bored. 

Knowing why there was an abnormal spike in traffic is critical from a forecasting perspective because the cause should not be considered a reliable, repeatable event.

As of this writing, annotations are not yet available on the native GA4 platform. (Remember the entire point of this article regarding the importance of year-over-year tracking?) 

Having annotations to provide proper context to key numbers is critical. 

Right now your best options are to either document them separately or install a browser extension that will give you that capability. 

Do a simple Google search for “GA4 browser extension” and you’ll see a list of choices.

(This author is neither endorsing nor rejecting the use of a browser extension, but will always advise to only use ones with a solid install base, are well-supported, and come highly recommended by reputable industry experts.)

Annotations will no doubt be added natively to GA4 at some point in the future so documenting them in a spreadsheet somewhere safe is certainly a viable option for now.

Ensure you have solid GA4 data for future use 

GA4 has a lot of possibilities, but also a lot of complexities when it comes to setup and use.

This article is by no means a complete checklist, as the platform continues to evolve. 

But hopefully, it gives you a solid base to ensure you’ll be able to have solid data from this holiday season to use in future YOY comparisons. 


Opinions expressed in this article are those of the guest author and not necessarily Search Engine Land. Staff authors are listed here.


Related Stories

New on Search Engine Land

@media screen and (min-width: 800px) { #div-gpt-ad-3191538-7 { display: flex !important; justify-content: center !important; align-items: center !important; min-width:770px; min-height:260px; } } @media screen and (min-width: 1279px) { #div-gpt-ad-3191538-7 { display: flex !important; justify-content: center !important; align-items: center !important; min-width:800px!important; min-height:440px!important; } }

About The Author

Adam Proehl

Adam Proehl is Partner & Co-Founder at NordicClick Interactive, a full-service digital agency with local and national clients, based in Minneapolis.
In digital marketing since 1998, Proehl has spoken at numerous national and international conferences, including SMX. He is a current Advisory Board Member for the Paid Search Association.

https://searchengineland.com/google-analytics-4-settings-holiday-season-389330


Excel pivot table best practices for search marketers

In 7 useful Excel formulas and functions for PPC, I shared tips to quickly identify high-impact PPC optimizations that will move the needle for your brand or client.

I am a firm believer in an analytical approach to search marketing. My “weapon of choice” for manipulating search data is Excel and one of my favorite features of the platform is pivot tables.

In this article, I’ll highlight a use case you might not be familiar with, along with some tips and shortcuts to enhance your pivot table skills. 

Unique use case: Using pivot tables to QA bulk sheets

If you’ve come across pivot tables in your search marketing career, I’d expect it was likely in a performance report. However, they can be leveraged in creative, non-analytical ways.

One such approach I am a particularly big fan of is using pivot tables to QA bulk sheets.

Might be a given, but you need to build your bulk sheet before you can use this technique. I won’t cover bulk sheet tips in this article (just one teaser: the concatenate function could come in handy), but one step I’ll recommend for your QA is to compile a summary of the elements you expect to be included in your bulk sheet. 

I generally build a table in the first sheet of my workbook, such as the one that you see below. For the sake of this example, there are two things I want to highlight.

  • First is that there will be exactly 5 keywords in each ad group.
  • Secondly, Ad Group #1 across all campaigns drives to the final URL with Page=A, Ad Group #2 drives to page=B, and Ad Group #3 will click to page=C. 

In the screenshot, you’ll notice I included the formula bar, which contains a formula for how to count distinct values in a data set.

Rather than discuss the nuts and bolts of how it works, just know that the referenced cells (D4:D18 in this example) need to be identical across the match functions and you should get the correct results. 

Bulk Summary Table.png

Once you’ve built out your bulk sheet, it’s time to create the pivot table.

The key here is to make sure you are highlighting all rows/columns that comprise the bulk sheet before you create the pivot table.

Now that we have our pivot table created, we can use the count feature to ensure that the bulk sheet is accurately created.

When you drag non-numeric fields into the Values area, the output will automatically become a count, instead of a sum. It’s important to note that the pivot table will not reflect just the unique values.

This is illustrated in the example below, where you can see that the count of all campaign elements is 75, which reflects the total number of keywords we expect in the bulk sheet. 

Pivot vs Summary Table

It’s important to recognize this, as it has an impact on how you should design your pivot table for accurate QA.

The best practice I recommend is to focus the count on the most granular element of the campaign. Move the campaigns and ad groups to the Rows area of the pivot table.

One final transformation to make, which is more stylistic than anything. If you right-click on the Campaigns field and navigate to field settings, you can adjust the view of your pivot table.

By making the selections highlighted in the view below, you can make the pivot table less vertical. 

The screenshot below shows the differences in pivot table formats, with the corresponding field settings underneath.

Again, more of a stylistic tip than anything; however, this will format the pivot table in a way that is more friendly for copy/pasting into the Editor.

Differing Pivot Formats

With these pivot table views, we’ve completed the first part of our QA. We’ve also confirmed that we have 5 keywords in each of the 15 ad groups.

If you wanted to audit the keyword text for accuracy, you would just move Keywords into the rows column below Campaign and Ad Group. 

In the second part of our QA, we want to make sure that the ad groups in each campaign are driving to the correct landing page.

One of the beautiful things about pivot tables is that there are multiple ways to get to the same conclusion.

Below I’ve highlighted two ways you can use pivot tables to confirm we’ve trafficked the bulk sheet correctly.

Options for QA Approach

The first option is similar to how we QA’d the count of keywords in each ad group. All I did was remove Keywords from the pivot table and added Landing Page underneath Ad Groups in the row. This will create a view that’s very easy to compare to our summary table. 

The second option flips things on its head a bit. Since we know that all Ad Group #1s should drive to page=a, we can put Landing Page at the top rows area in our pivot table. By doing this, we will see all the Ad Groups within the bulk sheet that are driving to Page=A. A different view, yet one I would argue is more effective for QA’ing. 

I’m only highlighting a few different views that I like. I challenge you to attempt leveraging a pivot table in your next bulk sheet QA and don’t be confined to the examples I’ve included here.

One of the greatest advantages of pivot tables is their flexibility. Play around and figure out what methods/approaches make the most sense for you. 


Get the daily newsletter search marketers rely on.


4 tips and tricks for pivot table analysis

To reiterate, the most common way that pivot tables are used in search marketing is for performance-based reporting.

In order to optimize the quality of your analysis, I want to highlight a few key tips.

1. Use custom calculations for maximum accuracy

I can’t stress this one enough. Accuracy is crucial for any analysis you are conducting.

To be honest, I don’t even export data sets with metrics such as CTR, CPC, or CVR, as I am a proponent of creating these as custom fields in the pivot table to ensure these metrics are accurately reflected. 

It is surprisingly easy to create these metrics in a pivot table.

Once you’ve created your pivot table, navigate to the pivot table Analyze menu, go to Fields, Items, & Sets, and finally Calculated Field.

Here, you can name and create custom fields that will automatically update with any changes you make to the filters/contents of the pivot table. 

Although it defaults to a “Sum of” label, you can see in the screenshot it is not a Sum. I typically just find and replace “Sum of” once I’ve finished creating my calculated fields to avoid any confusion. 

To illustrate the difference, I’ve included the average platform CTRs in my dataset in the screenshot below. You can then see how I get to the calculated fields menu and how I create the calculated field. 

Notice how the average of CTRs does not accurately represent the true CTR for this data set. However, our Custom CTR is spot on. (Feel free to check the calculation yourself!)

Custom Fields

2. Pull data at the most granular level 

The beauty of Excel and pivot tables is that it is prepared to handle relatively large data sets (about 1M rows). Pull your data at a keyword or ad level, add segments (i.e., device) and always pull by day if looking at a time period. 

In doing so, you will ensure that you can drill down to the main drivers of impact. Refer to my first Excel article for tips on adding additional filters, such as transforming dates to a weekly view or how VLOOKUP can help create filters.

3. Build reports for the long term 

PivotTable data can be refreshed and updated easily using the refresh feature (see screenshot below). Think about how you can design your report for the long term so that all you need to do is update the back-end data to create an updated view of performance. 

This means maximizing the use of formulas in data manipulation (such as adding filters) and designing the data source in a way that those formulas won’t break when you paste in the updated data. 

While this may seem like a heavy lift upfront, your end goal is a simple button click to refresh your performance report. The squeeze is worth the juice, trust me!

Menu for PivotTable

A quick comment on the difference between Refreshing a pivot table and Changing the Data Source. If you click Refresh, it will update the data within the originally defined data source. 

When you change the data source, you are redefining what rows/columns should be included in the pivot table data.

If you expect the number of rows in the data set to vary over time, I recommend becoming familiar with the Change Data Source option, as this will ensure you have always included all rows/columns in the report. It’s an extra step, but one that ensures your data set is comprehensive.

4. Use shortcuts for pivot tables (PC users)

Last but not least, sharing a handful of shortcuts that have improved my speed when manipulating pivot tables. 

These are a bit more complex, but once you get the hang of it, you’ll be flying around your workbook! For those on a Mac, #1 I’m sorry you’re missing out on Excel for a PC, but #2 your shortcuts are different!

  • Alt + N + V + T: This creates a pivot table
  • Alt + J + T: This opens the pivot table Analyze menu, when your cursor is on a cell within the pivot table. Adding a few keystrokes to the end gets you to commonly used features/menus 
    • Alt + J + T + J + F: This opens the Calculated Fields menu
    • Alt + J + T + F + R: This refreshes the pivot table
    • Alt + J + T + I + D: This allows you to change the data source
    • Alt + J + T + C: This opens up the chart creation menu for the contents of your pivot table
    • Alt + J + T + E + C: This clears the contents of your pivot table 

Improving your Excel skills takes practice

Similar to the functions I covered previously, it is going to take practice and time before you see the efficiency benefits that come with these techniques. However, put in the time now and I can assure you that you will see the payoff.

In addition, I encourage you to not limit yourselves to the applications of pivot tables covered here. As shown in the Bulk Sheet QA example, there are multiple ways to get to the same output. 

PivotTables are incredibly powerful tools that you can use to ensure you have both the 30,000-foot view of performance, as well as the more granular shifts that show your mastery of the funnel.

Use the Calculated Fields to create metrics specific to your business and think about how the QA techniques can be applied to other parts of your role. 

The applications of these techniques are far-reaching.

Want to learn more Excel tips and tricks from me? Sign up for SMX Next. Check out my session on how to level up your analytical skills with Excel, plus you’ll hear from plenty of other amazing speakers. 


Opinions expressed in this article are those of the guest author and not necessarily Search Engine Land. Staff authors are listed here.


Related Stories

New on Search Engine Land

@media screen and (min-width: 800px) { #div-gpt-ad-3191538-7 { display: flex !important; justify-content: center !important; align-items: center !important; min-width:770px; min-height:260px; } } @media screen and (min-width: 1279px) { #div-gpt-ad-3191538-7 { display: flex !important; justify-content: center !important; align-items: center !important; min-width:800px!important; min-height:440px!important; } }

About The Author

Anthony Tedesco

Anthony Tedesco is a search engine marketing professional based in Boston, Massachusetts. He started his career at Red Ventures in Charlotte, North Carolina, where he learned the impact of data-driven performance optimization and full-funnel marketing strategies. He then returned to his native Boston, where he joined DWA/Merkle B2B, working with Fortune 100 brands to maximize the value of their SEM investments. In 2021, Anthony joined the global paid media team at Cisco Systems, Inc., where he orchestrates high-impact tactics at scale and helps solve the complex challenges marketers face in the evolving digital landscape. Anthony is an avid Tar Heel and Boston sports fan. If not watching his favorite teams, he enjoys traveling to New England with family and friends or catching up on old seasons of Survivor.

https://searchengineland.com/excel-pivot-table-best-practices-for-search-marketers-389254


Apple could be building an ad network for live TV

Apple is currently holding discussions with advertising partners and MLS sponsors with the plan to launch next February.

The push for more ad space. Apple has been pushing aggressively lately to generate more demand and ad space for advertisers.

A deal with the MLS. Apple recently closed a 10-year deal to air MLS games in a new subscription service, as well as Apple TV+ streaming platform. They will also stream a portion of games for free to users of the Apple TV app. They’ll offer three different tiers: the dedicated package, paid TV+ subscriptions and the free TV app. 

The contract has been estimated to cost $250 million per season or $2.5 billion over the next decade. 

Why we care. New ad space is a good thing for advertisers who may be struggling to find their place in a crowded ad landscape. Stay tuned for more information when Apple makes an official announcement.


Related Stories

New on Search Engine Land

@media screen and (min-width: 800px) { #div-gpt-ad-3191538-7 { display: flex !important; justify-content: center !important; align-items: center !important; min-width:770px; min-height:260px; } } @media screen and (min-width: 1279px) { #div-gpt-ad-3191538-7 { display: flex !important; justify-content: center !important; align-items: center !important; min-width:800px!important; min-height:440px!important; } }

About The Author

Nicole Farley

Nicole Farley is an editor for Search Engine Land covering all things PPC. In addition to being a Marine Corps veteran, she has an extensive background in digital marketing, an MBA and a penchant for true crime, podcasts, travel, and snacks.

https://searchengineland.com/apple-could-be-building-an-ad-network-for-live-tv-389387


Amazon holiday shopping outlook: A guide for advertisers

With Amazon’s October Prime Early Access Sale in the books, Amazon advertisers need to fine-tune their strategy for the core stretch of Q4. 

Part of that planning revolves around:

  • Mapping out how budgets will be spent over the final month and a half of the year.
  • Which days to push the pedal most on.

We dug deep into the more than $400 million in Amazon ad spend under management annually at Tinuiti (my employer) to: 

  • Quantify what we’ve seen in the past and better estimate what might happen this go around.
  • Help brands better understand how performance for Amazon ads shifts over the course of the holiday shopping season.

Let’s dive in.

Looking back at the 2020 vs. 2021 holiday seasons

It may be tough to remember at this point, but way back in 2020 the holiday shopping season looked very different than any previous year for Amazon vendors and sellers.

First, there was the Oct. 13-14, 2020 Prime Day event, which was delayed from its typical mid-year timing. As a result of the surge in ecommerce demand pushing Amazon’s fulfillment capabilities to the limits in the early months of the pandemic, the change created a new Q4 “holiday.” 

The sales per click of sponsored products ads soared relative to what would typically be expected in the middle of October. We saw a sequel of this with the Prime Early Access Sale this year.

Much of Amazon’s and other retailers’ efforts to kickstart the Q4 2020 shopping season earlier than usual were intended to pull demand earlier in the quarter as:

  • Shipping delays were causing huge headaches at the time.
  • Last-minute shoppers wouldn’t be able to reliably get packages as quickly late in the season. 

This also led to much earlier shipping cutoff dates in order to get packages in time for Christmas, and our second key divergence for Q4 2020 ad performance compared to other years – a meaningful drop in sales per click in the third week of December compared to 2019.

Amazon U.S. sponsored products YoY sales per click growth by day.

By 2021, shipping delays were much less obstructive than in 2020, and cutoff dates to receive packages in time for Christmas returned to a more typical schedule. 

In turn, advertisers saw sales per click in the third week of December soar relative to 2020, the exact opposite of the trend a year prior.

Looking ahead to this year’s holiday season, we expect shipping cutoffs to be more in line with 2021 than 2020, such that advertisers should see the sales per click of ads hold up later in the shopping season.

Now, let’s take a look at how total sales volume trended on key days during the holiday season last year.

Black Friday and Cyber Monday are tops in volume for most brands

When it comes to the sheer volume of sales attributed to ads during the holiday shopping season, Black Friday and Cyber Monday (BFCM) continue to be pivotal parts of overall success. 

In 2021, the median advertiser saw sales attributed to Sponsored Products ads rise 45% on both Black Friday and Cyber Monday compared to average daily sales for the first half of November.

Amazon U.S. sponsored products sales volume relative to first half of November average daily sales.

While we’re using median here to convey how big these two days are for middle-of-the-pack advertisers, the surge in sales was certainly much larger for some brands than others. 

35% of sponsored products advertisers saw Black Friday sales more than double compared to the first half of November, and 37% saw the same for Cyber Monday.

In terms of pure volume, no other day between mid-November and late December comes close to the sales attributed to ads on BFCM for most brands. 

It’s possible that the Prime Early Access Sale in October pulled forward some of the volume that would otherwise happen in November and December. 

That said, it’s unclear how that might play out in terms of impacting specific days. It’s very likely we’ll still see Black Friday and Cyber Monday come out on top compared to other days over the last month and a half of the year.

However, total sales volume is only one measure of the opportunity available to brands. Sales-per-click trends show how incredibly valuable other days can be as well.


Get the daily newsletter search marketers rely on.


The value of ad clicks in late December last year neared Cyber Monday highs

Consumers are certainly ready to convert when it comes to sales holidays like Cyber Monday and Black Friday. 

But urgency also builds toward the end of the season, when consumers are down to the wire and need gifts in time for Christmas and other holidays. 

This is clear when looking at the share of total sales attributed to sponsored products using a 30-day window that occurred within the first 24 hours of the ad click. This can be used as an indicator of how compelled shoppers felt to convert at any given time.

As you can see, the share of purchases that occurred quickly after an ad click went up significantly on Black Friday and Cyber Monday, falling thereafter before rising throughout the rest of the shopping season until shipping cutoffs for Christmas delivery came into effect.

Share of 30-day Amazon sponsored products sales that occur within 24 hours of the ad click.

A similar trend unfolds when looking at how sales per click changed over the course of the holiday season last year. 

The value of ad clicks peaked on Cyber Monday for the median advertiser, but several days in late December neared this high as the value of ad clicks rose with shoppers’ sense of urgency.

Amazon U.S. sponsored products sales per click

But here’s the catch! Some of the conversions that are attributed to ads on BFCM or to days just before the shipping cutoff can be partially attributed to marketing efforts that occurred before those key stretches. 

For example, search formats like sponsored products often get a boost in performance from display campaigns that build awareness on and off Amazon prior to the final ad interaction and conversion.

When evaluating opportunity, advertisers need to look beyond simple volume metrics to guide strategy, especially in setting bid adjustments to account for changes in the expected value of ad clicks. 

But they also need to understand that boosts in sales per click on any given day might be the result of ad interactions on other days that weren’t credited with the sale.

Given different kinds of shoppers carry different lifetime values, brands should also look beyond just the direct sales per click in assessing how much shoppers are worth during different periods of the holiday shopping season. New-to-brand metrics can help advertisers do just that.

New-to-brand customers offer another incentive for brands to be aggressive on big days

New-to-brand sales, defined by Amazon as those sales that come from customers who have not purchased from a brand in at least a year, allow advertisers to get a better sense of what kinds of customers their sponsored brands and Amazon demand-side platform (DSP) campaigns are attracting.

Looking at the share of total sales attributed to sponsored brands that came from new-to-brand customers during the holiday shopping season last year, advertisers found the highest share days between the beginning of November and the end of the year came on Black Friday and Cyber Monday, which both saw 76% of sales attributed as new to brand.

New-to-brand share of sales attributed to Amazon sponsored brands

A close third place went to Dec. 21 at 75% new-to-brand share, as shoppers appeared more willing to purchase from new brands as they secured last-minute gifts. 

New-to-brand share was the lowest (62%) during the last two months of the year on Nov. 20, the Saturday before Thanksgiving.

These trends vary by the advertiser, and swings can be much more significant for some brands than others. 

Looking at how new-to-brand share has trended during past holiday seasons should help inform when brands should adjust strategy this go around.

Holiday sales takeaways for Amazon advertisers

There are a lot of unknowns heading into the holiday shopping season in 2022, especially regarding how well the economy as a whole will hold up. 

Even so, brands should still understand how recent performance has trended during the core weeks of Q4 in the past. 2021 is likely a decent indicator of how different days will compare to one another in 2022.

Key days like Cyber Monday and Black Friday still play a meaningful role, with sales volume for these two days far eclipsing that of other days during the holiday shopping season. 

As such, brands should have a strategy in place for making the most of the surge in shopping intent that comes with these sales holidays.

That said, advertisers can find gold in the form of higher sales per click and elevated new-to-brand customer share at other points in Q4.

Amazon marketers should look into 2021 data as soon as possible to get a sense of when to hit the gas on advertising. 


Opinions expressed in this article are those of the guest author and not necessarily Search Engine Land. Staff authors are listed here.


Related Stories

New on Search Engine Land

@media screen and (min-width: 800px) { #div-gpt-ad-3191538-7 { display: flex !important; justify-content: center !important; align-items: center !important; min-width:770px; min-height:260px; } } @media screen and (min-width: 1279px) { #div-gpt-ad-3191538-7 { display: flex !important; justify-content: center !important; align-items: center !important; min-width:800px!important; min-height:440px!important; } }

About The Author

Andy Taylor

Andy Taylor is vice president of research at Tinuiti, focused on creating unique views into digital marketing performance based on $3 billion in annual ad spend under management. In addition to Search Engine Land, his work has been featured in major publications such as The Wall Street Journal, Bloomberg and The New York Times, among many others.

https://searchengineland.com/amazon-advertising-most-valuable-holiday-shopping-days-389296


How organizational structure can hurt PPC campaign performance

In my 20 years of experience, I’ve seen the inner workings of countless marketing teams. I’ve observed what works and what doesn’t.

Most importantly, I’ve witnessed how an organization’s structure and culture can immediately impact campaign performance.

And I’ll admit, it’s frustrating sometimes to watch companies trip over themselves based on the team structure they’ve put in place. 

As an agency leader, we see the impact on campaign performance. Campaigns flounder because of competing goals, miscommunications, siloed budgets and fragmented resources. 

If your campaign performance is lackluster or your growth has stagnated, it’s time to look inward.

Here are three of the most common ways your organizational structure is killing campaign performance. 

1. Brand advertising is separated from demand generation

It’s common in many organizations to separate teams based on a traditional marketing funnel.

In these cases, brand advertising is often separated from demand generation resulting in some key issues. 

Measuring the revenue impact of awareness advertising 

Measuring the impact of awareness advertising requires a plan which looks at lift metrics in channels typically handled by demand gen teams, including:

  • Organic search.
  • Brand search.
  • Social engagement.
  • Direct traffic. 

Careful planning must happen before, during and after the campaigns.

Yet, the siloes between these teams make this coordination extremely difficult.

Alignment of media plans

There’s a multiplier effect when awareness and demand generation teams are combined. 

Sponsorship campaigns often contain demand generation placements which, if left to a brand advertising team, may not be used to their full potential. 

Demand generation teams can easily mold their campaigns to support in-person events, large campaign initiatives and seasonal activities that the awareness team may drive.

Reactivating audiences from awareness campaigns

About 95% of buyers are not in-market currently and only 5% are, according to the B2B Institute. 

By coordinating efforts, 95% of buyers not in-market can be reactivated by demand generation teams through careful nurture and remarketing campaigns. 

Again, this type of synergy happens best when teams are combined, allowing planning and execution to happen seamlessly. 

With brand and demand generation teams combined, organizations can align measurement strategies, configure tracking across the entire lifecycle and motivate the entire team to “generate demand.” 

Advertisers that have integrated the team quickly see that it’s much easier to prove the success of “awareness” advertising and much easier to optimize top-of-funnel spend. 

Thankfully, we’re seeing this shift, and more companies are bringing these two functions together. 

As a result, they experience a compound effect as the impact of awareness advertising is felt throughout the sales funnel. 


Get the daily newsletter search marketers rely on.


2. IT is responsible for integrating data with ad platforms

Data is the lifeblood of modern advertising. 

Campaigns thrive when machine learning algorithms get enough data to tap into the right audiences. And savvy advertisers know that feeding the right data into ad platforms is the most effective way to fuel performance. 

But getting the right data back into the ad platforms is much easier said than done. 

Solutions like Google’s offline conversion tracking and Facebook’s Conversions API make it relatively easy for advertisers to push CRM data into the ad platforms. 

That data is then used in bid algorithms to serve ads to the audiences that will ultimately convert in lower parts of the funnel or offline completely. 

With the pending deprecation of third-party cookies, data integration is critical for all advertisers.

However, companies struggle to determine who’s responsible for configuring these critical data integrations. 

  • Is it the marketing team? 
  • Does IT handle these tasks? 
  • Could it be web development? 

What we typically see is that because no one “owns” this process, it gets deprioritized and often doesn’t happen at all. 

Companies need to prioritize data integration and define who is ultimately accountable.

In our experience, this is best led by the marketing team. 

Yes, there may be a need to pull on IT or web development expertise. However, the group using the data must understand how it’s flowing and what is being passed back.

Here’s how to structure this.

  • Responsible: Marketing or martech team
  • Accountable: Marketing team
  • Consulted: IT or martech
  • Informed: Information security

Pro tip: If you don’t have a marketing team that can implement this directly, consider the use of Zapier or manual integration.

Similar to the siloes that happen when brand and demand generation are separated, splitting up your paid media between agencies is a surefire way to hurt your overall campaign performance.

We often see this with advertisers trying to either have different agencies compete or when they’ve chosen an agency that does one channel well but not the others.

But there are many reasons why housing all your paid media within one agency is the smarter choice:

  • A strong agency will work as an extension of your team. Giving them full transparency into your marketing portfolio will equip them with the insight they need to make strong recommendations that align with your end goals. 
  • Budget is much more easily passed between channels and campaigns when a single entity manages it. A strong agency will see the overall portfolio and help you to make the best decisions toward optimizing your budget.
  • The learnings from one channel will impact the other channels. For example, messaging that resonates best, audiences that are strong performers and filling gaps in channels that may be too expensive. 
  • Cross-channel targeting and nurture streams can easily be set up to target audiences across channels and through the funnel. 

Separating paid media across multiple entities makes it extremely difficult to optimize budget, share learnings between channels, set up nurture streams and provide holistic advice.


Opinions expressed in this article are those of the guest author and not necessarily Search Engine Land. Staff authors are listed here.


Related Stories

New on Search Engine Land

@media screen and (min-width: 800px) { #div-gpt-ad-3191538-7 { display: flex !important; justify-content: center !important; align-items: center !important; min-width:770px; min-height:260px; } } @media screen and (min-width: 1279px) { #div-gpt-ad-3191538-7 { display: flex !important; justify-content: center !important; align-items: center !important; min-width:800px!important; min-height:440px!important; } }

About The Author

Amanda Evans

Amanda has developed digital advertising strategies and paid media campaigns for companies across multiple industries for more than 20 years. She is data-driven and passionate about advancements in tracking technologies to ensure clients maintain a competitive advantage. Her specialties include large-scale SEM campaigns, web analytics and crafting comprehensive, easy-to-use dashboards to empower account performance. Amanda holds an MBA from San Jose State University and a BSC from Santa Clara University. Before serving as President of Closed Loop, a paid media agency, Amanda founded and led a comprehensive digital marketing consulting agency for seven years.

https://searchengineland.com/organizational-structure-ppc-campaign-performance-389222


Hour and date dimensions now available in GA4

Google has just added hour and date dimensions for Google Analytics 4.

A dimension is an attribute of your data. It describes your data and it’s usually text as opposed to numbers. An example of a dimension is Event name, which shows the name of an event that someone triggers on your website or application (such as “click”). 

The new dimensions. An explanation of the new dimensions is below:

  • Hour is the hour when an event was collected.
  • Nth hour is the number of hours since the start of a specified date range.
  • Date + hour is the date and hour when an event was collected.
  • Week is the week of the event, a two-digit number from 01 to 53. Each week starts on Sunday, and January 1st is always in Week 1.
  • Month is the month of the event, a two-digit integer from 01 to 12.

What the dimensions do. Google says you can use these dimensions to quickly answer questions like:

  • How did my online sales data trend, hourly, after our Superbowl commercial aired?
  • What months do I see the most traffic on my website?
  • Are users of my app more likely to convert in the evening hours, or during the day? What about users of my website?

Get the daily newsletter search marketers rely on.


Add custom dimensions and metrics as primary dimensions in saved reports. Google just announced that you can now add custom dimensions and metrics to your custom reports as primary dimensions, enabling you to more easily report on custom information that’s important to your business.

Additionally, the dimensions and metrics pickers in the Reports Builder have been updated to allow for easier navigation to help you find dimensions and metrics quickly. 

Dig deeper. Learn more about analytics dimensions here.

Why we care. Advertisers will be able to see more information about their events so they can better optimize their campaigns. Use the dimensions to see the date and hour your event received clicks, conversions, or any other event name that’s specified.


Related Stories

New on Search Engine Land

@media screen and (min-width: 800px) { #div-gpt-ad-3191538-7 { display: flex !important; justify-content: center !important; align-items: center !important; min-width:770px; min-height:260px; } } @media screen and (min-width: 1279px) { #div-gpt-ad-3191538-7 { display: flex !important; justify-content: center !important; align-items: center !important; min-width:800px!important; min-height:440px!important; } }

About The Author

Nicole Farley

Nicole Farley is an editor for Search Engine Land covering all things PPC. In addition to being a Marine Corps veteran, she has an extensive background in digital marketing, an MBA and a penchant for true crime, podcasts, travel, and snacks.

https://searchengineland.com/hour-and-date-dimensions-now-available-in-ga4-389339


Meta earns MRC accreditation for content-level brand safety on Facebook

The Media Rating Council (MRC), has just given Facebook’s parent company Meta accreditation for their brand-safety efforts on Facebook In-Stream Video and Instant Articles in desktop, mobile web and mobile in-app. 

This accreditation is of Meta’s Partner Monetization Policies, Content Monetization Policies and associated content-level brand safety and suitability controls for the placements mentioned above.

What is the MRC. Meta says “The MRC is a nonprofit industry organization whose goal is to ensure metrics and measurement across the media industry are valid, reliable and effective. The MRC also works with the Global Alliance for Responsible Media (GARM) in developing MRC’s industry standards around brand safety and suitability, which aim to ensure harmful content is not monetized.”

MRC requirements. Meta says they conducted in-depth preparation prior to the external audit, during which they provided data and evidence for the auditors to test their systems and conduct their assessment. Meta says that through the external audit, they demonstrated to the MRC that their processes and systems meet its rigorous requirements across several areas, including:

  • Enforcement of Content and Partner Monetization Policies through machine learning and human review
  • Quality assurance of business partners and performance measurement
  • The controls made available to advertisers on the platforms
  • Brand safety reporting and disclosures

Testing further brand suitability. Meta also announced in March that they were testing a content-based inventory filter for Facebook Feed and Instagram Feed. “We will continue to iterate on the brand safety and suitability solutions we make available to businesses and plan to extend the MRC audit to the content-based inventory filter controls for Feed once they are generally available,” Meta says.

Dig deeper. Read the announcement from Meta here.

Why we care. Normally Meta wouldn’t be at the top of my mind when I think of brand safety. But I think it deserves a little credit. In addition to the numerous safety measures implemented, they also reinstated their political ad restrictions for the week leading up to the general election, just like they did in 2020.

Meta seems to be working hard to regain its reputation. This is more than I can say for some other brands in the news this week. Meta may not be the most popular ad platform for advertisers anymore, but it’s climbing the ranks again as far as giving marketers more control over their brand safety options. 


Related Stories

New on Search Engine Land

@media screen and (min-width: 800px) { #div-gpt-ad-3191538-7 { display: flex !important; justify-content: center !important; align-items: center !important; min-width:770px; min-height:260px; } } @media screen and (min-width: 1279px) { #div-gpt-ad-3191538-7 { display: flex !important; justify-content: center !important; align-items: center !important; min-width:800px!important; min-height:440px!important; } }

About The Author

Nicole Farley

Nicole Farley is an editor for Search Engine Land covering all things PPC. In addition to being a Marine Corps veteran, she has an extensive background in digital marketing, an MBA and a penchant for true crime, podcasts, travel, and snacks.

https://searchengineland.com/meta-earns-mrc-accreditation-for-content-level-brand-safety-on-facebook-389278


Google is getting rid of similar audiences segments

Starting in May 2023, similar audiences segments will stop being generated, and existing similar audiences segments will no longer be added to campaigns and ad groups on Google Ads and Display & Video 360.

In August 2023, similar audiences segments will be removed from all ad groups and campaigns.

What this means. More automation. Google says that similar audiences segments will transition to “more powerful, tested, privacy-centric automated solutions. These solutions help advertisers connect with relevant audiences, all while meeting people’s expectations for privacy.”

“We are committed to creating durable, resilient solutions for our advertisers to help them reach an engaged and relevant audience, even as fewer third-party cookies are available. Automation is a big part of this commitment.”

Enter Optimized Targeting and Audience Expansion

Replacing similar audiences segments is Optimized Targeting (for video, display discovery and performance campaigns) and Audience Expansion (for brand campaigns).

Optimized Targeting. For Discovery, Display and Video action campaigns on Google Ads and Display & Video 360, optimized targeting will help businesses find new and relevant audiences that are likely to convert without relying on third-party cookies.

Google says. Advertisers who use optimized targeting on Display and Video 360 can see, on average, 55% improvement while using first-party audiences.

Audience Expansion. For Awareness and Reach video or Consideration video campaigns, audience expansion makes it easier for businesses to reach more people likely to convert.

Availability. This solution is already available in Google Ads and will be launched for Display & Video 360 in the first half of 2023.

Things to know. Keep in mind the following features and best practices when creating or updating your Smart Bidding and Optimized Targeting settings.

  • Advertisers can still use Customer Match lists for Smart Bidding or Optimized Targeting.
  • Use Smart Bidding for store sales and offline conversions.
  • You can (and should) adjust Smart Bidding conversion values.

Dig deeper. To understand how these automated solutions work towards advertisers’ marketing objectives, they can use Audience Insights – a new feature on the Insights Page that helps businesses learn more about their customers’ interests and how they engage with their ads.

You can read more info about these changes on the Google Help Center post.

Why we care. Similar Audiences segments will be available for (at least) the next 6 months. If your campaigns are using these segments, you can continue to do so until after the holiday season. However, you should still plan and test your transition to Smart Bidding and Optimized Targeting so the impact will be less harmful.


Related Stories

New on Search Engine Land

@media screen and (min-width: 800px) { #div-gpt-ad-3191538-7 { display: flex !important; justify-content: center !important; align-items: center !important; min-width:770px; min-height:260px; } } @media screen and (min-width: 1279px) { #div-gpt-ad-3191538-7 { display: flex !important; justify-content: center !important; align-items: center !important; min-width:800px!important; min-height:440px!important; } }

About The Author

Nicole Farley

Nicole Farley is an editor for Search Engine Land covering all things PPC. In addition to being a Marine Corps veteran, she has an extensive background in digital marketing, an MBA and a penchant for true crime, podcasts, travel, and snacks.

https://searchengineland.com/google-is-getting-rid-of-similar-audiences-segments-389234


Microsoft credit card ads are now available globally, plus 11 other new product updates

Microsoft has just announced a slew of new product updates, including the global adoption of credit card ads.

Let’s dive in.

1. Credit card ads

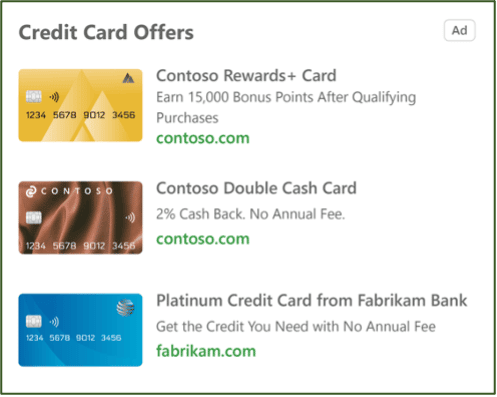
Credit card ads were launched last year to advertisers in the US and Canada. Now, they’re available globally.

Credit card ads appear on the right rail of Bing search results and run alongside mainline text ad placements. These ads can trigger for queries like brand name, card category and credit level.

2. Performance Max import

Microsoft just announced that the Performance Max import tool is now available with or without a Merchant Center feed.

3. No-code conversion setup wizard beta

A beta is now available to advertisers to let you set up conversion tracking via Clarity. By having Microsoft Clarity insights for Microsoft Advertising enabled within your Universal Event Tracking (UET) tag setup, you can now set up conversion tracking by event, as well as measure performance.

4. New UET tag dashboard

There is a new UET tag dashboard that can help you monitor tag data and fix issues. The dashboard includes real-time insights into the data that gets sent via UET tags and troubleshooting action recommendations. 

5. RSA recommendations through the API

Microsoft ETAs are going away on February 1, 2023. You can now upload RSA recommendations to your accounts using the bulk API. This is to help advertisers migrate top-performing content to RSAs and ensure all ad groups have RSA before February. 

6. PrestaShop partnership

PrestaShop is a freemium, open-source e-commerce platform that’s an alternative to Shopify. PrestaShop merchants can now connect natively to the Microsoft Advertising platform module within the PrestaShop experience.

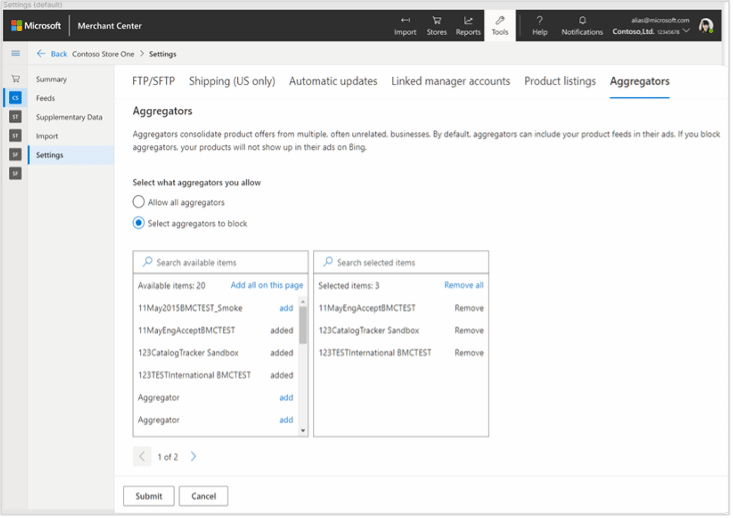
7. Aggregator partner options

Directly from the Microsoft blog, “For retailers working with aggregators, we’ve removed the “all-or-nothing” choice for direct retailers, and they can now choose to block only specific aggregators from paid listings (Product Ads). Now available in all Shopping Campaigns global markets.”

8. Audience Ads management in Microsoft Editor

Advertisers can now manage Audience Ads with multiple assets from within the Microsoft Editor tool. Support for Multimedia Ads was also added to the editor tool in September.

9. In-market audience targeting for soccer fans

Microsoft has developed an easy-to-use In-market Audience specifically designed for the Word Cup, starting on November 20, which will allow you to target high-value customers across the Microsoft Search and Audience Networks. 

How to use it. Microsoft says, “Apply our “Qatar 2022 football” audience to your campaigns. On search campaigns, associate these audiences to your existing top-performing ad groups with “bid only” targeting and a bid boost of 20% to begin, then adjust as you evaluate performance. On your audience campaigns, add these lists in “target and bid” to your existing campaigns that use In-market Audiences, or create a separate campaign to target these sports enthusiasts.” 


Get the daily newsletter search marketers rely on.


10. Customer Match availability

Customer Match is now available in all Microsoft Advertising markets (excluding China). To get started with this feature, either directly upload your customer lists to Microsoft Advertising or connect your customer data platform (CDP) to import the data. 

Microsoft says “We’ve recently expanded the CDPs that can connect to Microsoft Advertising and have integrations with Lytics new, Amperity, Adobe Advertising Cloud, and Skai. For more information on how to connect your CDP to Microsoft Advertising, work with your account team or our support team.” 

11. Similar Audiences available in more markets

While Google is doing away with Similar Audiences segments, Microsoft is embracing them. Similar Audiences can be used in the US and Canada, and now, they’re now generally available in more markets. You can see the full list of markets on the Microsoft blog announcement.

12. Audience Network CPM pricing

For advertisers who run image ads on the Microsoft Audience Network, the manual bidding options have been expanded- with the addition of CPM pricing. With this pricing model, you specify a maximum amount you are willing to pay for 1,000 impressions. This pricing model is now available in all markets where the Microsoft Audience Network is available!

if you don’t want to use CPM, you can use the manual cost-per-click (CPC) pricing model or choose Enhanced CPC.

Honorable mention: Netflix’s ad-supported tier

Don’t forget that Netflix has partnered with Microsoft to deliver an ad-supported subscription plan to the streaming platform. That ad-supported tier is set to launch on November 3.

Why we care. In my opinion, Microsoft is worth testing, if you haven’t done so already. Whereas Google is leaning toward full automation, Microsoft is still keeping and allowing the use of many of the manual bidding and audience segments that Google is getting rid of.

The addition and updates of these features should be good news to advertisers looking for alternative search and audience options, as well as more control over their ad campaigns.


Related Stories

New on Search Engine Land

@media screen and (min-width: 800px) { #div-gpt-ad-3191538-7 { display: flex !important; justify-content: center !important; align-items: center !important; min-width:770px; min-height:260px; } } @media screen and (min-width: 1279px) { #div-gpt-ad-3191538-7 { display: flex !important; justify-content: center !important; align-items: center !important; min-width:800px!important; min-height:440px!important; } }

About The Author

Nicole Farley

Nicole Farley is an editor for Search Engine Land covering all things PPC. In addition to being a Marine Corps veteran, she has an extensive background in digital marketing, an MBA and a penchant for true crime, podcasts, travel, and snacks.

https://searchengineland.com/microsoft-credit-card-ads-are-now-available-globally-plus-11-other-new-product-updates-389235