Google introduces Ads Data Hub for Marketers and Measurement Partners
Google’s Ads Data Hub helps advertisers do customized analyses for their business objectives while maintaining user privacy. Because marketers and measurement partners have different needs, Google has created two different solutions: Ads data Hub for Marketers and Ads Data Hub for Measurement Partners.
Ads Data Hub for Marketers
The Ads Data Hub for Marketers is a way for advertisers to analyze their data, get access to insights, and be better informed when they buy media.
Publisher Advertiser Identity Reconciliation. Publisher Advertiser Identity Reconciliation (PAIR) is a solution that gives publishers and advertisers the option to securely and privately reconcile their first-party data for audiences who have visited both an advertiser’s and a publisher’s site.
New query templates, automated workflows, and reporting updates will reduce the time needed to generate insights. With the implementation of PAIR, marketers will be able to activate their audience segments on new inventory, including YouTube.
Ads Data Hub for Measurement Partners
The Ads Data Hub for Measurement Partners gives partners the ability to provide YouTube insights and measurement services on behalf of marketers, advertisers, agencies, or publishers.
The launch of Ads Data Hub for Measurement Partners means that it’ll be easier for partners to offer accurate measurements and deliver real-time insights. For marketers, it means they can work with independent, third-party partners to calculate and report on YouTube ad performance across devices, formats, and metrics.
Additional information
Google offered the following information in addition to the recent announcement on the blog:
The tailored experiences allow us to focus on expanding our current features for marketers who already use ADH to make the most of their first-party data and build audiences in a privacy-centric way, and focus on feature development that brings the most value to our Measurement Partners.
For example, we’ve now reduced enablement for Measurement Partners from more than 10 hours to just 60 seconds for advertisers to share their YouTube data via ADH, maximizing reporting coverage and near-real-time reporting.
We also just expanded YouTube for masthead and In-feed Video for Consideration for both Measurement Partners and Marketers, which provides a more comprehensive and holistic look at their YouTube measurement.
When Ads Data Hub was first launched, it supported mobile and desktop, but we’ve since introduced CTV measurement. It is now a holistic, cross-device measurement solution that allows for richer insights in a way that doesn’t sacrifice user privacy.
Other key features for Ads Data Hub:
MRC Accreditation: For the past two years, Ads Data Hub has received MRC accreditation, underscoring our commitment to creating a solution that meets industry standards and needs.
Cross-media measurement: Through a number of our measurement partners, we have expanded measurement services on Ads Data Hub to enable cross-media solutions for YouTube. Customers are able to analyze the performance of YouTube campaigns relative to other media channels (including linear TV, streaming TV, or online video sources).
Co-viewing: As the way consumers watch TV content shifts, it’s become more complex to measure impact. Over the past year, we have introduced co-viewing with some of our reach measurement partners, allowing advertisers to measure when multiple viewers are watching YouTube TV and YouTube on CTV.
Why we care. Different measurement solutions will help advertisers and partners measure insights for YouTube and CTV campaigns to analyze the performance across multiple platforms, in real-time. The new privacy-centric measurement tools protect the data of users online while still providing advertisers, agencies, and partners with comprehensive analytics.
Related Stories
New on Search Engine Land
@media screen and (min-width: 800px) { #div-gpt-ad-3191538-7 { display: flex !important; justify-content: center !important; align-items: center !important; min-width:770px; min-height:260px; }
}
@media screen and (min-width: 1279px) { #div-gpt-ad-3191538-7 { display: flex !important; justify-content: center !important; align-items: center !important; min-width:800px!important; min-height:440px!important; }
}
About The Author
Nicole Farley is an editor for Search Engine Land covering all things PPC. In addition to being a Marine Corps veteran, she has an extensive background in digital marketing, an MBA and a penchant for true crime, podcasts, travel, and snacks.
3 new tools to measure Google app performance and privacy
Google has just announced three new tools to measure cross-platform app conversions, strengthen performance with privacy-focused measurement, and adapt to iOS and Android standards.
Cross-platform conversion measurement. Without cross-platform conversion tracking, google says advertisers will have measurement gaps and optimization limitations across web and app campaigns.
To solve this issue, and help advertisers set up conversion tracking, Google is testing alpha testing Web to App Connect, a toolkit that guides advertisers through the process step by step.
Deep linking. Google is also prioritizing a frictionless web-to-app experience through deep linking. Deep linking connects the mobile web experience to the company’s app to ensure a smoother, faster, checkout experience.
Web to App Connect will be available in beta early next year.
Privacy-focused measurement. Google Analytics for Firebase, Google’s privacy-forward measurement solution, provides advertisers with cross-platform measurement capabilities to understand how users engage with your app and optimize your App campaign attribution, reach and performance.
Google says when you implement Analytics for Firebase you’ll unlock additional benefits such as audience management and tROAS bidding for app campaigns, and:
Maximized performance: Additional consented, signed-in data to automatically improve App campaign ramp up and modeling to more efficiently reach consumers.
Expanded inventory: By early next year, advertisers will get access to connected TV and the ability to measure performance across devices.
New audience lists: You’ll have the ability to more easily engage existing app users who have not been reached with push notifications.
Adapting to shifts in platform standards on iOS and Android. Google is now supporting solutions that help advertisers navigate changes to rollout of the AppTrackingTransparency (ATT) framework on iOS, including the new version 4.0 updates to SKAdNetwork, Apple’s measurement API.
Next year, Google will also release tools for advertisers using the Google Analytics for Firebase SDK, which streamline setting up SKAdNetwork conversion values and help better optimize their campaigns for in-app actions.
Why we care. Measuring cross-device app conversions, enhancing reporting accuracy, and preserving privacy are essential for app advertisers to accurately optimize and scale campaigns in 2023 and beyond.
Advertisers can start setting up SKAdNetwork conversion values themselves or work with a measurement partner.
Related Stories
New on Search Engine Land
About The Author
Nicole Farley is an editor for Search Engine Land covering all things PPC. In addition to being a Marine Corps veteran, she has an extensive background in digital marketing, an MBA and a penchant for true crime, podcasts, travel, and snacks.
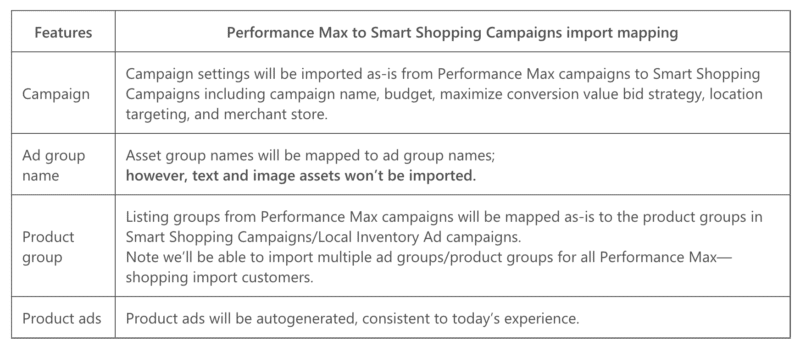
Microsoft Ads has just launched a solution within the Google Import tool to simplify duplicating your Performance Max campaigns across platforms.
They’ve also started a pilot program for importing Performance max campaigns that aren’t using a Merchant Center. The new experience will import these campaigns as Search campaigns and create Dynamic Search Ads (DSA).
Best practices. Microsoft outlines the following best practices for importing Performance Max campaigns using the Merchant Center.
The following are best practices for importing Performance Max campaigns without Merchant Center.
Use the Google Import Tool. You can access the Google Import Tool here.
Dig deeper. Read the Microsoft blog announcement and access the setup checklist here.
Why we care. Microsoft users can now easily import their PMax campaigns from Google, with or without a Merchant Center account. Make sure to follow best practices when importing to ensure your ads don’t get disapproved.
Advertisers who want to import their campaigns before the holidays should start now so they have more time to adjust to the new platform.
Related Stories
New on Search Engine Land
About The Author
Nicole Farley is an editor for Search Engine Land covering all things PPC. In addition to being a Marine Corps veteran, she has an extensive background in digital marketing, an MBA and a penchant for true crime, podcasts, travel, and snacks.
You get your data source connected, open up a new file, and you have no idea what to do next.
There are no instructions. No guide rails. Just you and an empty page to fill.
And while you can start with a template (Google Looker Studio Report Gallery has several), it’s still tough to know how to customize it to perfectly fit your needs.
Here are some tried-and-true elements to include in PPC dashboards and reports that will banish blank-page syndrome and give your stakeholders the insights they crave.
1. Titles, subheads and context
When you add a chart in Google Looker Studio, you select the data source, dimensions, metrics and date range from the Data Panel to populate your visualization.
But your reader doesn’t see the Data Panel and won’t know what your chart is about unless you take an extra step to include it in your dashboard.
The two graphs below show identical data visualizations. Figure A includes only the chart, while Figure B includes written titles and context.
Figure A leaves questions in your reader’s mind that Figure B answers.
You can make your graphs and tables easier to understand at a glance with these tips:
Give your data visualizations a title.
Use subheadings and microcopy for additional context.
Use legends.
State the date range if it’s not included in the chart. (Note: “auto” date range defaults to last 28 days.)
If multiple data sources are used throughout your dashboard, clarify which is used in specific charts.
How to do it:
Add a text box and write out your titles and descriptions.
This will open up a “Text Properties” panel to edit fonts, text size, and styling elements.
It’s worth the small manual effort it takes to add a text box and include context!
2. KPI scorecards
You don’t need an article to tell you that your dashboard should include your key performance indicators (KPIs).
But while you’re planning out your dashboard, pay special attention to where to include them.
Your KPIs matter most in your report and deserve top billing.
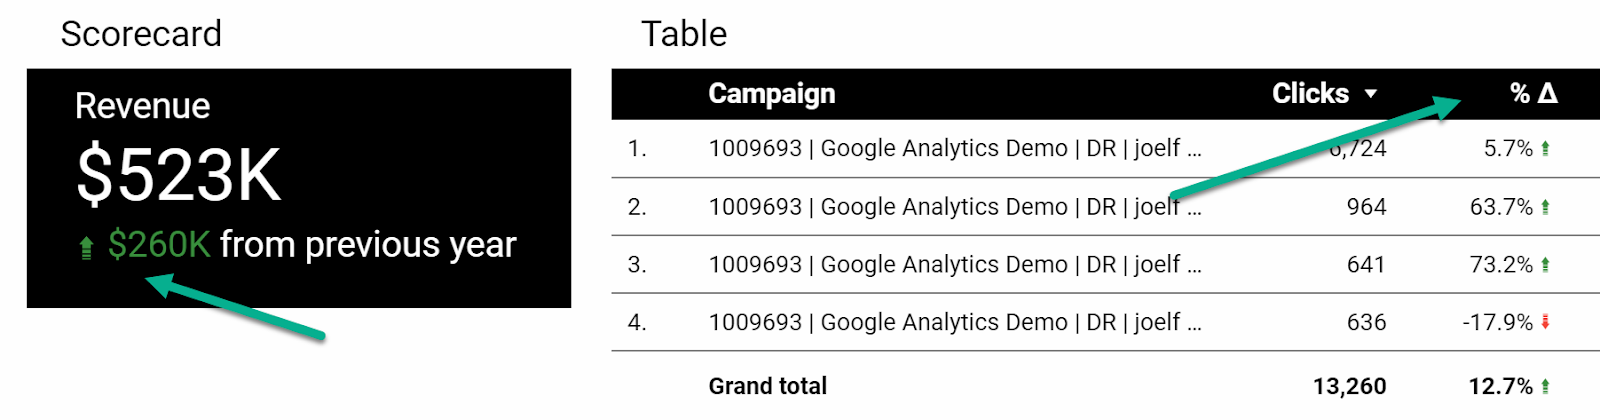
That means showcasing your KPIs with scorecards like so:
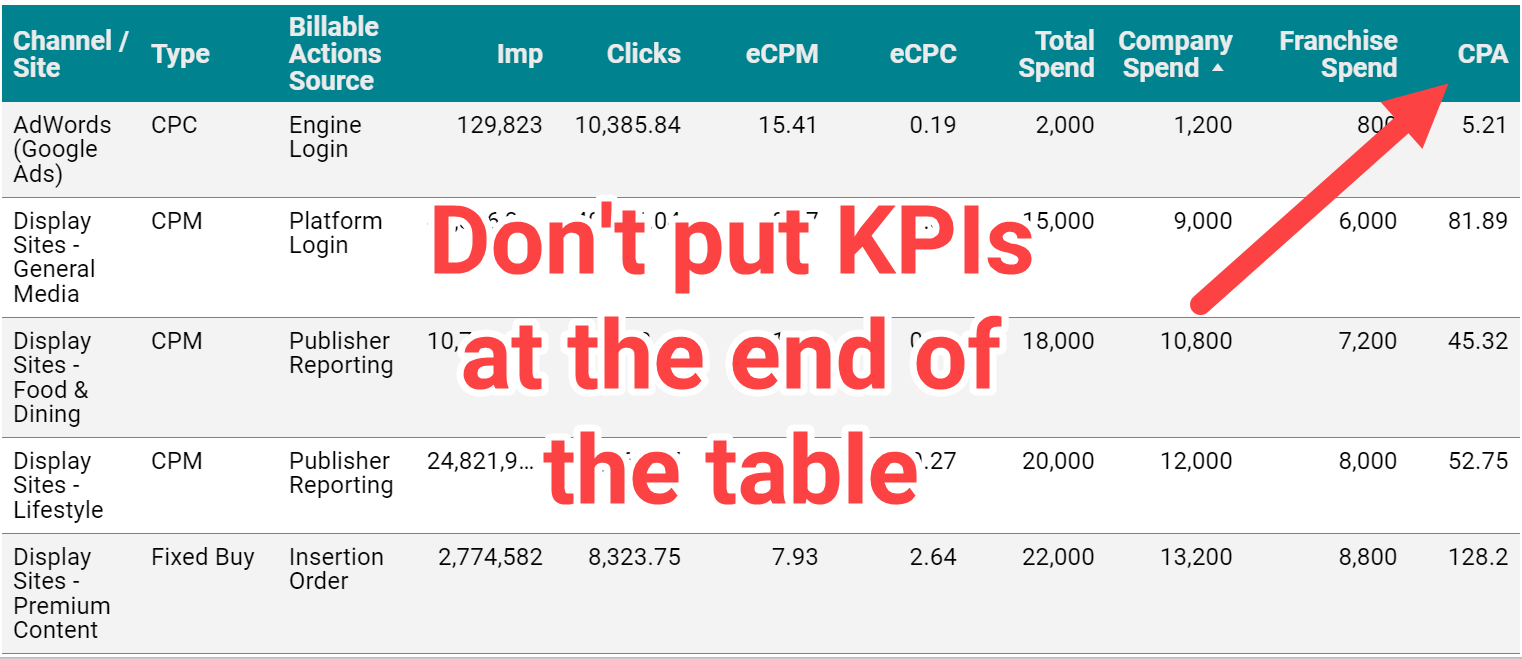
Not as afterthoughts at the end of a table:
Not only do tables make it hard to identify KPIs, for languages that are read left to right, tucking KPIs on the far right of the table tells your reader these metrics are low priority.
Keep your reader focused on your key growth metrics like lead volume, revenue, or return on ad spend (ROAS), rather than vanity and traffic metrics like impressions and clicks.
How to do it:
Use Chart > Scorecard.
In the “metric” section of the Data Panel, add your KPI. Repeat as needed.
Control format and size in the Style Panel.
Having KPIs appear in tables and other charts isn’t a problem, but give them added attention by using scorecards.
3. Goal pacing
Some advertisers use fixed monthly or annual marketing budgets with no room for adjustments.
Others have sales or efficiency goals they need to hit with flexible budgets.
No matter what the approach, your dashboard should answer the question:
Are we meeting our objectives, and how do we know?
Account objectives aren’t standardized, and neither is the approach for including goal pacing in your dashboard.
Fortunately, Looker Studio gives you many options for adding objectives and pacing, from literally charting against a goal to adding a written description of the target.
Here are some examples of how you might anchor performance to a goal:
How to do it:
Option: Add a header that states the objective
Option: Use a pacing chart such as bullet or gauge
Option: Add a calculated field with progress to goal (metric/target)
Including goal pacing gives your reader confidence in how to interpret performance data.
4. Trends and historical comparisons
Trends and historical comparisons let your reader know if things are improving – or need improvement – over time.
Maybe you fell short of the goal, but you always miss it because it’s unrealistic.
Maybe you hit your goal, but you’re down compared to last year, and you need to take corrective action.
Don’t make your reader wonder whether current performance is average, down or “best month ever.”
Snapshot (single-metric) comparisons
Tables and scorecards give you an easy way to show your reader how performance for this period compares to another, using color-coded arrows to indicate the direction of the change (delta).
How to do it:
Under “Date range,” select your comparison date range:
Fixed
Previous period
Previous year
Advanced
In the Style Panel:
Control the color of positive or negative change arrows
For Scorecards only, you can select whether to show absolute or percentage change and whether to include a description of the previous time period (comparison label).
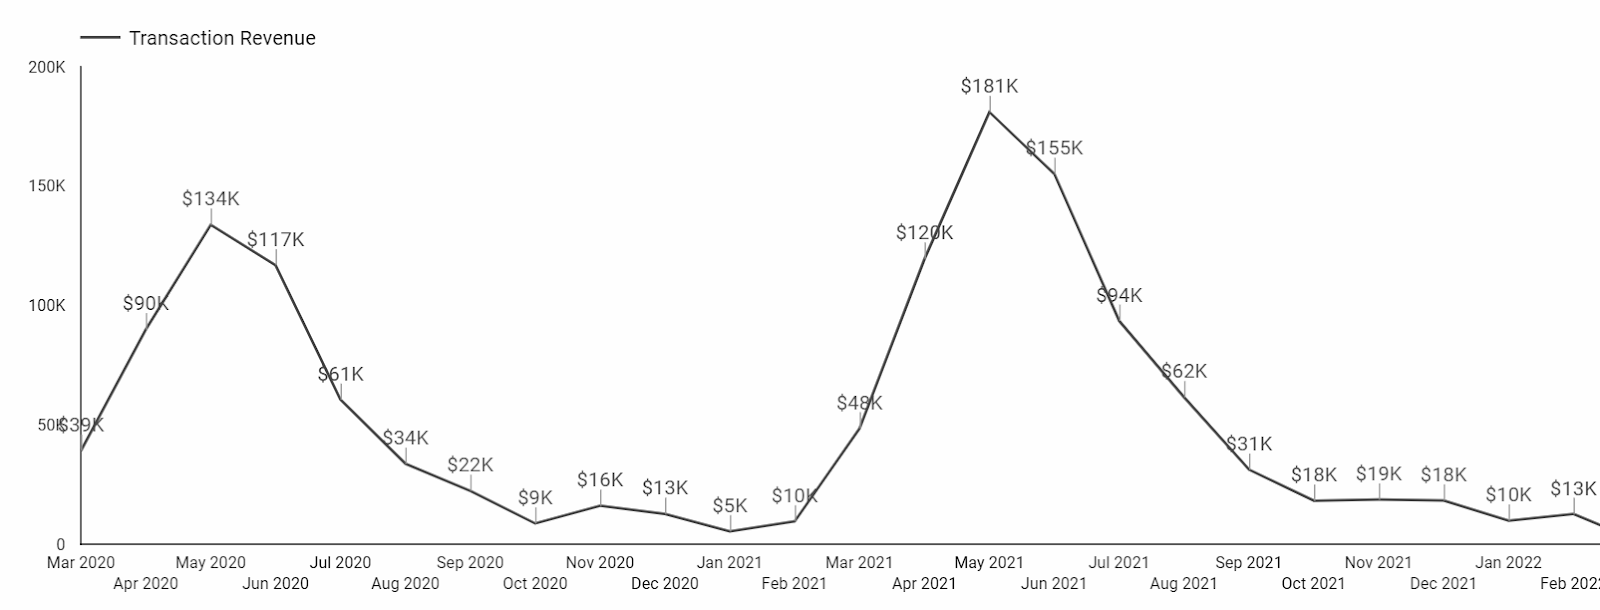
You can get a complete picture of performance trends using time series charts.
Rather than just comparing this period to the last period, you’ve got an entire history revealing trends in seasonality, market impact and more.
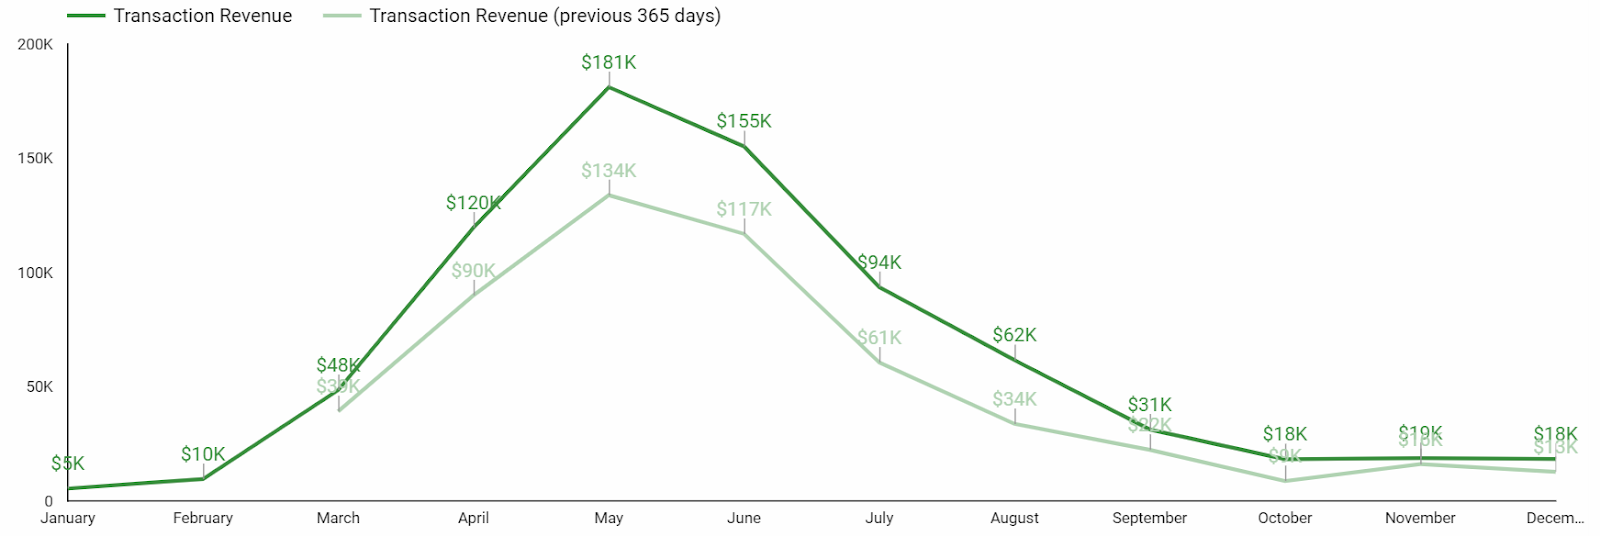
You can use a continuous Time series chart (shown above) or designate a comparison time period.
Here’s how that same data looks as a Year over Year (YoY) Time series chart. Note that the comparison year will show as a lighter shade of this period’s line:
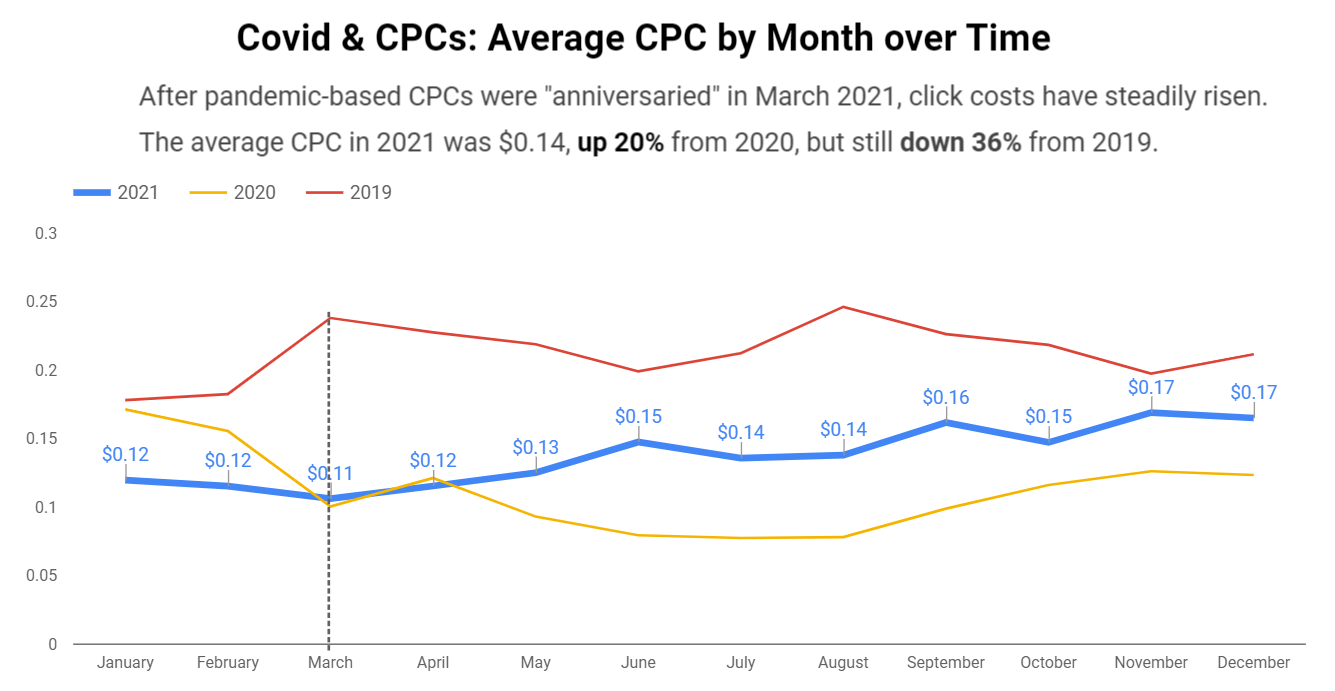
Another way to show historical performance is with a line chart that uses a time period as a breakdown dimension.
This Line chart is from a report comparing CPCs before and during the Covid-19 pandemic:
How to do it:
To compare two time periods: Use a Time series chart and select a comparison date range.
To compare three or more time periods (shown here for years):
Select a Line chart
Set the “Dimension” to Month
Set the “Breakdown Dimension” to Year
Set the “Sort” to Month
Set the “Secondary sort” to Year
A few important notes for trends and historical comparisons –
Only use these for your KPIs or metrics that directly contribute to your KPIs. Don’t add a CTR trend chart just for the sake of including a trend chart.
There’s almost never a reason to show daily granularity in these charts. Zoomed in that closely, you’ll miss the signal for the day-to-day noise. Look for trends at a monthly level.
5. Categorical tables
Okay, so tables aren’t that glamorous.
But if your Looker Studio dashboard doesn’t have a table, something’s probably missing.
Why? Because there are times when your audience needs to compare multiple categories across multiple metrics. And nothing does that more efficiently than a table.
Tables are great for comparing default categories like:
Campaigns
Ad groups
Keywords
Search terms
Final URLs
And depending on the complexity of your PPC dashboard, you can create tables for:
Engines and platforms
Channels and networks
Funnels / intent / stages of awareness
Brand vs. nonbrand
Pivots of time segments, conversion types, and other categories
How to do it:
Chart > Table (or Pivot table)
Dimension(s): the category or categories you want to compare
Metrics: your KPIs and supporting metrics
From the Style Panel, you can format your table to include heatmaps, bars and targets
It’s easy to build tables and add metrics, and it’s easy to get carried away. Exercise some restraint and limit the number of metrics in your table, so it remains useful to your reader.
Bonus: Shiny charts
Our list constrained us to five categories, but here’s one bonus for making it to the end:
Shiny charts.
What are shiny charts?
Shiny charts are visualizations that your audience loves and gets excited about, even if they’re not super actionable.
Your readers may not learn anything new, but they’ll feel like they learned something new.
Maps are a great example.
Many dataviz experts say not to use map charts; there are better ways to communicate location data.
But try to find a client or stakeholder who doesn’t love to see performance data on a map. Go ahead. I’ll wait.
Sure it’s a bit counterintuitive when you’re trying to build out an actionable dashboard. Maybe even a bit controversial. And you don’t have to do it. But a chart that makes your audience feel good just for seeing it has its own merit.
Putting it all together
While your Looker Studio dashboard can technically include whatever you want, it should at a minimum include:
Title and context
KPI scorecards
Goal pacing
Historical comparisons
Categorical tables
These don’t need to (and can’t) all be discrete sections. One scorecard can include a title, KPI, pacing, and time comparison.
There are many other charts and visualizations that can take your PPC dashboard from good to great. Getting started with this list will set you up for success and give you a dashboard worth the time it took to build.
Opinions expressed in this article are those of the guest author and not necessarily Search Engine Land. Staff authors are listed here.
Related Stories
New on Search Engine Land
About The Author
Amy Hebdon is a Google Ads conversion expert and the founder and managing director of the Google Partner agency Paid Search Magic. Since 2004, she’s managed Google Ads for clients ranging from Fortune 10 to SMBs at agencies, in-house, and freelancing. Her articles have been published in Search Engine Journal, Unbounce, PPC Hero, Supermetrics, Copy Hackers and CXL. Together with her husband James, she also runs the Facebook group Google Ads for Savvy Digital Marketers.
How to make the most of Performance Max this holiday shopping season
Performance Max is one of the biggest shifts to automation that we’ve seen from Google. How do we make it work this holiday shopping season?
Ideally, you should’ve prepared everything in advance.
Black Friday is in ~30 days! If you’re just starting now, you’re already behind.
Below are some ways you can still get ahead.
1. Audience signals
This is the most underrated part of Performance Max, but likely the most important.
Google gives you the ability to input signals on who the system should target. Upload your customer and email lists, compile top keywords, use interests etc.
We’ve found success with the following audience signals:
Customer match
High-value customers
2021 holiday shoppers
Email subscribers
Custom intent
Competitor names and URLs
High-intent (bottom-funnel) keywords
Tip: Use the Klaviyo and Google Ads integration.
2. Asset groups
With PMax, it’s important not to shock the system by making drastic changes. It’s better to make smaller and more incremental changes.
You can use these approaches:
Create a new asset group for promotional items.
Layer new promo creative and extensions.
If you’re creating a new asset group, do it within the same campaign so that the product-level historical performance will be utilized.
Be patient and give it some time to collect data and ramp up. It can take time!
Keep in mind: Creating new Performance Max campaigns for BFCM is not recommended because the learning period takes too long to ramp up.
You’re best off adding new asset groups to existing Performance Max campaigns or layering on promotional assets with the current asset groups.
Get the daily newsletter search marketers rely on.
3. Datafeed
The datafeed is important all year round, but especially important now!
Google Shopping and Performance Max do not allow you to target based on keywords.
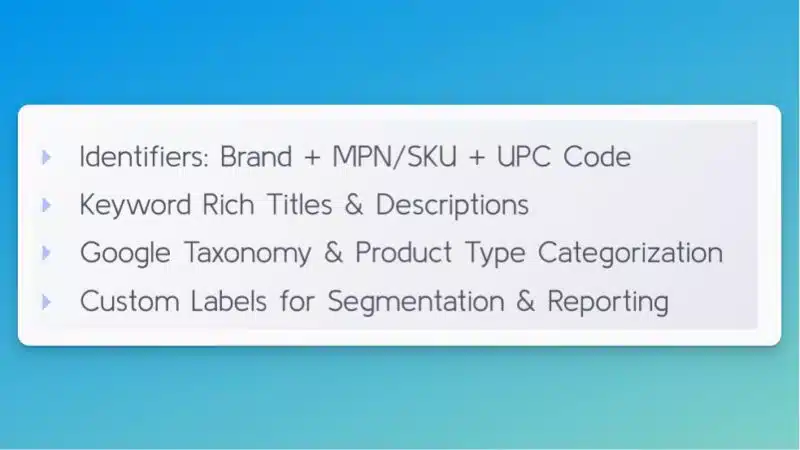
The system uses your product information to understand what search queries should show your ads.
4. Ad extensions
Ad extensions (assets) are an easy way to launch promos without making campaign changes that can throw off the system.
You can and should add promo extensions in two places:
Google Merchant Center for Shopping
Google Ads for Search, YouTube, etc.
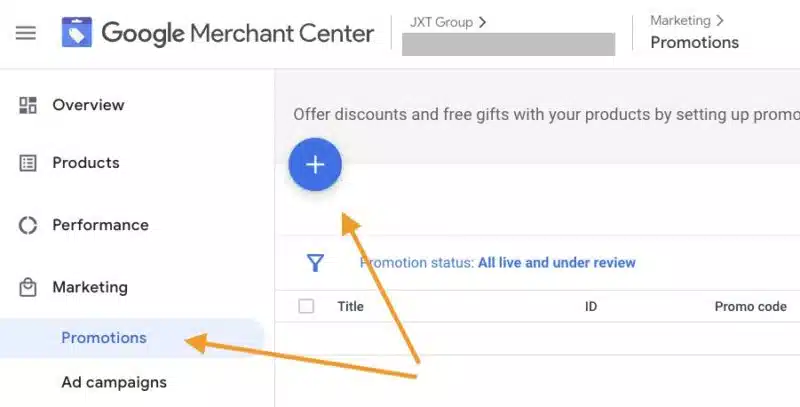
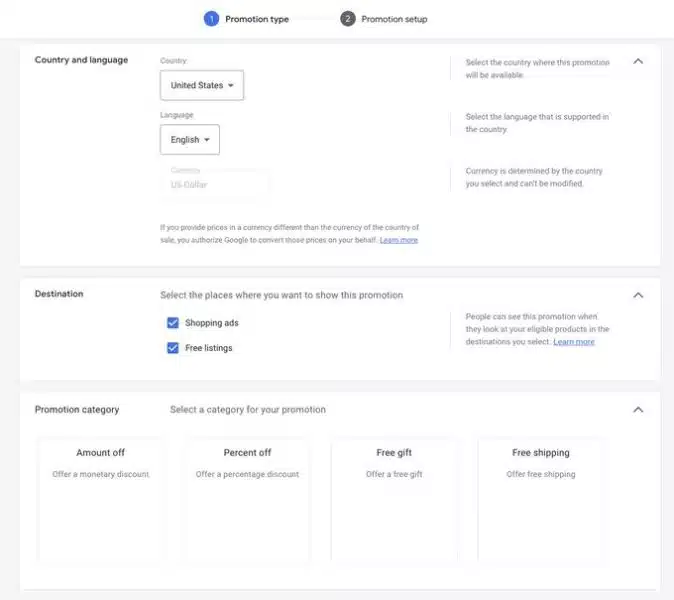
In Google Merchant Center (GMC), you’ll want to make sure you have Promotions enabled under Growth > Manage Programs.
Once you have the option to create promos, go to Marketing > Promotions, then click the big blue button to submit your promotion info.
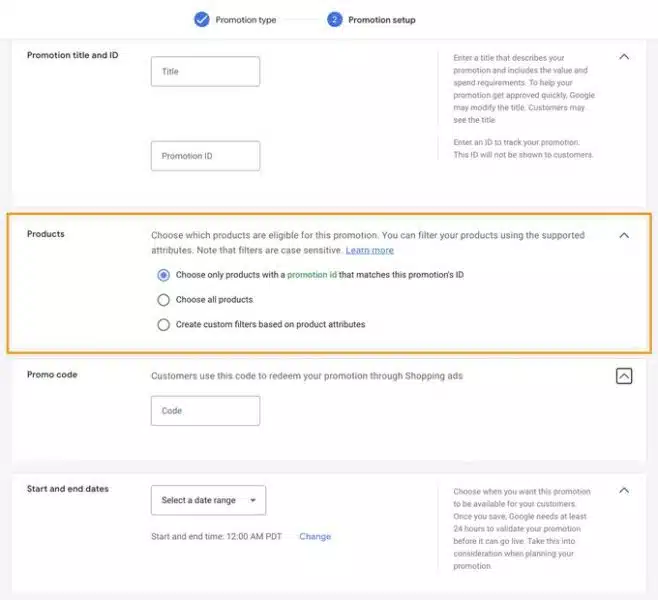
Note: GMC promos are very finicky and subject to manual approval so make sure to set this up correctly. It’s especially important to get the product selection right. (Step 2 below.)
Give yourself time and submit all promos in advance, just in case.
Step 1: Promotion type
Step 2: Promotion setup
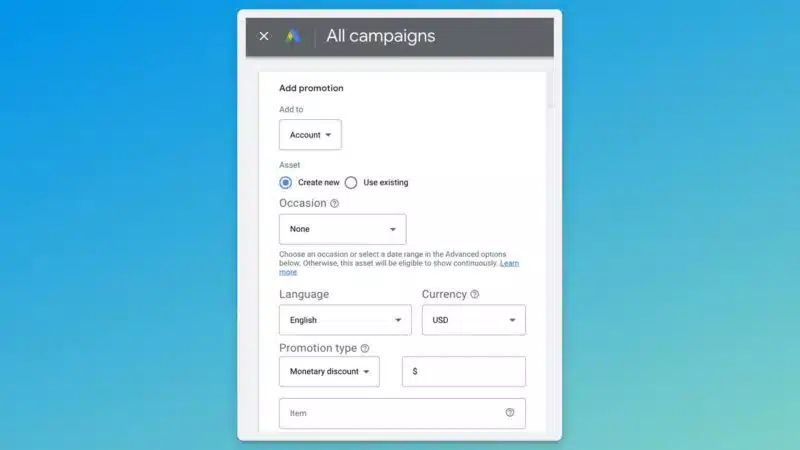
In Google Ads, promotion extensions (assets) can be added on the account level or campaign level. Just click the Assets tab and add new.
5. Bids and budget
Give the system space to perform but don’t make super-drastic changes.
We recommend increasing budgets and decreasing tROAS targets incrementally. Again, don’t shock the system.
Anytime you increase the budget, you force the system to find new audiences. It can take time for the algorithm to find a new audience that’ll perform well.
Also, keep in mind that as you increase your budget, you’ll likely see your ad costs increase as well.
6. Smart Shopping style
You can run Performance Max without any assets, only using your product datafeed. This forces the system to run in a similar manner to Smart Shopping with more placements available.
This is a great way to capture high-intent traffic at scale.
7. Paid social style
Additionally, you can run Performance Max without a datafeed which will exclude the Shopping placements and run display ads only.
If you see success with Facebook, Instagram, and TikTok, this can work very well for you.
And make sure you’ve got the setup, reporting and optimization basics of PMax covered by reading the following articles:
Opinions expressed in this article are those of the guest author and not necessarily Search Engine Land. Staff authors are listed here.
Related Stories
New on Search Engine Land
About The Author
Menachem Ani, Founder of JXT Group, is a digital advertising expert with over a decade of success developing high-impact marketing strategies for online retailers and lead-generation clients.
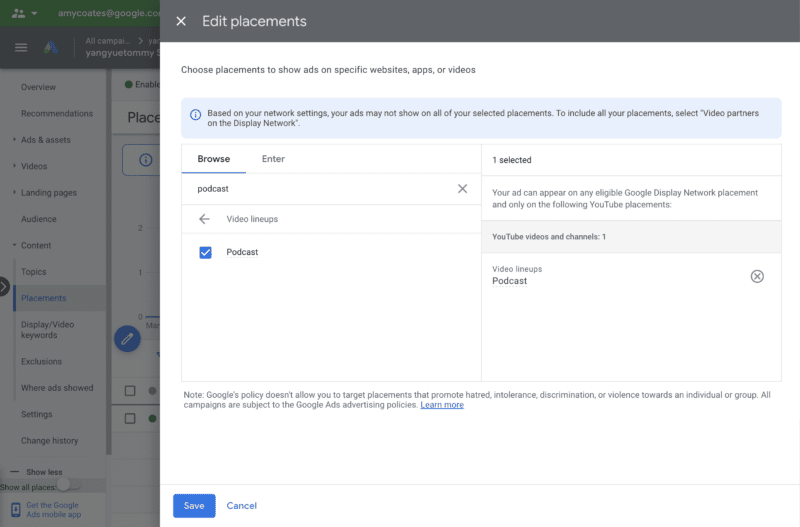
Yep, announced today, “advertisers can now align their ads with podcast content globally. Simply create an audio or video campaign and select “Podcast” as a placement.”
Why we care. Last month we reported on three new audio, shopping, and streaming features available to YouTube advertisers. Today advertisers can officially select “podcast” as their preferred placement.
Related Stories
New on Search Engine Land
About The Author
Nicole Farley is an editor for Search Engine Land covering all things PPC. In addition to being a Marine Corps veteran, she has an extensive background in digital marketing, an MBA and a penchant for true crime, podcasts, travel, and snacks.
Licensed healthcare providers eligible to apply for new YouTube product features
YouTube has just announced that licensed healthcare providers can now apply to make their channels eligible for new health product features – a suite of information resources released last year.
What this means. The health product features previously launched include health source information panels to help viewers identify videos from authoritative sources and health content shelves that highlight videos from these sources when you search for health topics, so people can more easily navigate and evaluate health information online.
Previously, those features have only been available to educational institutions, public health departments, hospitals, and government entities. The new guidelines will make the features available to a wider group of healthcare providers.
How to apply. Eligible healthcare providers can apply starting today using the guidelines below, taken directly from the YouTube blog announcement.
Applicants must have proof of their license, follow best practices for health information sharing as set out by the Council of Medical Specialty Societies, the National Academy of Medicine and the World Health Organization, and have a channel in good standing on YouTube. Full details on eligibility requirements are here.
All channels that apply will be reviewed against these guidelines, and the license of the applying healthcare professional will be verified. In the coming months, eligible channels that have applied through this process will be given a health source information panel that identifies them as a licensed healthcare professional and their videos will appear in relevant search results in health content shelves. Health creators in the US can apply starting October 27th at health.youtube, and we’ll continue to expand availability to other markets and additional medical specialties in the future.
Why we care. YouTube is trying to help people become more informed, engaged and empowered about their health by attempting to create a space where they can find reliable, factual, and informative content from legitimate healthcare providers.
However, not every licensed healthcare provider shares safe, proven, harmless content. Users should still do their due diligence to ensure that the content they are consuming is high quality.
Additionally, advertisers who work with licensed providers should apply for the new features today to ensure their channels have added visibility.
Related Stories
New on Search Engine Land
About The Author
Nicole Farley is an editor for Search Engine Land covering all things PPC. In addition to being a Marine Corps veteran, she has an extensive background in digital marketing, an MBA and a penchant for true crime, podcasts, travel, and snacks.
Reddit is building an Ads API, first 4 partners announced
Reddit is working on a new Ads API and have just announced their first four alpha partners. The partners will be integrated into the API and are helping build solution that will inevitably help advertisers build, scale, and optimize campaigns.
Who are the partners. The four partners involved in Reddit’s new venture are:
Vidmob
Sprinklr
adMixt
PMG
Who will benefit. Reddit’s API will benefit advertisers spending at scale, as well as self-serve advertisers who are using Reddit ads for the first time.
Release date. The API is still in development and there is no release date published at this time. Reddit says they are looking to “bring more strategic developers on board in the coming months.”
What Reddit says. “We have long had the aspiration to build an ecosystem of partners via our API that enables more effective and efficient campaign management on our platform. The Reddit Ads API will allow a global, diverse set of partners and clients to access all the capabilities we have built and continue to develop to drive performance,” said Reddit COO, Jen Wong. “These foundational alpha partners represent some of the best and brightest across the industry in terms of innovation, creativity and adtech. Having them join our developer ecosystem is tremendously exciting.”
Why we care. The new API will help advertisers discover new audiences, trends, and additional data they need to optimize their campaigns for conversions.
Related Stories
New on Search Engine Land
About The Author
Nicole Farley is an editor for Search Engine Land covering all things PPC. In addition to being a Marine Corps veteran, she has an extensive background in digital marketing, an MBA and a penchant for true crime, podcasts, travel, and snacks.
Google has just unveiled several new Google Analytics 4 (GA4) updates, including a new homepage experience, real-time behavioral modeling reports, and custom channel grouping.
Insights through machine learning
Behavioral modeling. Behavior modeling with real time reporting will give advertisers a complete picture of user behavior as it happens, in a privacy-centric way.
Behavior modeling uses machine learning to fill in the gaps of your understanding of customer behavior when cookies and other identifiers aren’t available.
Real-time updates will be available in the near future to give advertisers a complete view of the customer journey as it’s happening.
The new home page experience. Originally previewed at Google Marketing Live and available to all advertisers as of today, is personalized for customers, highlighting key top-line trends, real-time behavior and their most viewed reports. Additionally, it uses machine learning to look for trends and insights and surfaces them directly to advertisers on the home page.
Integrations and solutions to power better ROI
Data-driven attribution (DDA). DDA was introduced into GA4 earlier this year, after becoming the default for all ads conversions last fall. Soon, Google will launch custom channel grouping, a feature that lets advertisers combine different channels to compare cost-per-acquisition and return-on-ad-spend based on data-driven attribution. For example, businesses will be able to compare the performance of their paid search brand with their non-brand campaigns.
Integration with Campaign Manager 360. With this integration, you’ll be able to see a more complete picture of your campaign performance alongside web and app behavioral metrics.
GA4 Setup Assistant updates
Universal Analytics (UA) is sunsetting in 2023, so to help advertisers complete the transition easily, Google is rolling out an update early next year that will automatically help standard UA users set up their GA4 properties.
Google’s step-by-step guide will help you migrate to GA4 on your own if you choose to opt out of using the Setup Assistant. If you choose to utilize the Setup Assistant, you can access it in the admin section of your UA property.
Beginning early next year, the Setup Assistant will create a new Google Analytics 4 property for each standard UA property that doesn’t already have one. It should also be noted “the new GA4 properties will be connected with the corresponding UA properties to match your privacy and collection settings. They’ll also enable equivalent basic features such as goals and Google Ads links,” Google said.
New migration deadline for 360 customers
Additionally, we acknowledge that this is a complex transition, especially for enterprise customers which is why we’re pushing the migration deadline for 360 customers from October 2023 to July 2024, to ensure a successful setup.
Dig deeper. You can read the full announcement and more details on the features on the Google Marketing Blog.
Why we care. GA4 has been an inconvenient thorn in the garden of marketing. Maybe that’s being dramatic, but most advertisers are putting off implementing the new Analytics property to the very last minute. This is a bad idea.
If you haven’t set up GA4 yet, get started on it asap. Utilize the Setup Assistant to begin collecting data, then go back later and customize your dashboard and create additional views.
These new features are only helpful if you’re actually using the product.
More resources. Check out these additional resources to help you set up and get the most out of GA4:
Related Stories
New on Search Engine Land
About The Author
Nicole Farley is an editor for Search Engine Land covering all things PPC. In addition to being a Marine Corps veteran, she has an extensive background in digital marketing, an MBA and a penchant for true crime, podcasts, travel, and snacks.
YouTube trim video tool turns videos into 6-second bumper ads
The new trim video tool from YouTube turns your videos into 6-second videos that you can use for bumper ads. How convenient!
Machine learning strikes again. The new tool is now available globally in Google Ads, making it easy for advertisers to create bumper ads. The tool is powered by a machine learning model that identifies important scenes and brand elements from the original video and adapts them for shorter formats, Google says.
Not new(s). The tool was first introduced in 2019 as Bumper Machine and Google says that since then it “has helped hundreds of brands drive more reach, frequency and efficiency by effortlessly generating 6-second bumper ads. It improves on the Bumper Machine beta in many ways, with an enhanced machine learning model that can better select clips to adapt into shorter formats and an interface with more intuitive editing capabilities.”
Why we care. The new tool can be used by advertisers to quickly create bumper ads if they don’t have the cutting and editing resources available to larger businesses. The new feature also allows you to test multiple ads much faster, as all of the videos created will be available in the asset library.
Related Stories
New on Search Engine Land
About The Author
Nicole Farley is an editor for Search Engine Land covering all things PPC. In addition to being a Marine Corps veteran, she has an extensive background in digital marketing, an MBA and a penchant for true crime, podcasts, travel, and snacks.