The new Focused View campaign objective allows brands only pay when users have voluntarily watched an ad for at least 6 seconds or when they interacted with the ad within the first 6 seconds (whichever comes first).
What this means. Focused View is the new Video View campaign type. Selecting the Focused View objective means that ads are shown to users who are truly paying attention and voluntarily engaging with the brand.
Focused View allows TikTok to optimize for two different kinds of engagement:
Emotional engagement through content consumption: Targeting users who are most likely to view your ad for at least six seconds
Tangible engagement through interaction: Targeting users who are more likely to actively engage with an ad by liking, sharing, following or clicking
Early adopters. During its Alpha phase, Samsung used Focused View on their Summer of Galaxy campaign, aimed at driving awareness and engagement for their Galaxy products. The 6-second Focused View objective helped to drive:
+11% increase in ad recall
+18% improvement in 2-second CPVs
+53% increase in average watch time per view
2.8x increase in completion rate
Release date. Focused View will be available to advertisers, globally, on October 20.
Dig deeper. You can read the announcement from TikTok here.
Why we care. Advertisers who use TikTok to promote their brands can use the new Focused View campaign objective to show their ads to users they know are paying attention. Ideally, this would increase engagement and conversions. With all new features and products, advertisers should test the new campaign objective when it is released.
Related Stories
New on Search Engine Land
About The Author
Nicole Farley is an editor for Search Engine Land covering all things PPC. In addition to being a Marine Corps veteran, she has an extensive background in digital marketing, an MBA and a penchant for true crime, podcasts, travel, and snacks.
The Pinterest Trends Tool is expanding with a new API for Conversions
The new Pinterest API for Conversions gives advertisers a full view of their campaign performance as well as actions their audience took on their site, and it will be integrated with tag management partner Google Tag Manager and commerce partner Shopify.
The Pinterest Trends Tool. Pinterest is expanding the capabilities of its Trends Tool which came out in 2019 to help advertisers worldwide gain deeper insights into the behavior of Pinterest users and to use that information in planning their campaigns.
New updates. New Trends Tool updates also announced include three new features:
A widget on the Pinterest Trends homepage that lets advertisers see what has been trending with their engaged users and followers over the past 90 days
Trends filtered by demographic, place, time and topic
And new trend types, including seasonal trends, to help brands better align their content and marketing calendars with times when users are most engaged with those specific topics
Early API adopters. Pinterest also said hundreds of advertisers worldwide have already implemented the tagless, server-to-server solution, and early results included improvements of 14% in CPAs on average for optimized CPM campaigns when using both the API for Conversions and tags, compared with tags only, and a 36% average increase in attributed conversion volume under the same conditions.
Though the new API was most frequently used for lower-funnel actions such as checkouts, they are also seeing success in full-funnel actions like page visits and add to cart.
What Pinterest says.
“Pinterest is uniquely positioned at the intersection of discovery and commerce, where inspiration meets intent. We are investing across our advertising platform to help businesses around the world reach their goals and connect with leaned in consumers at every stage of the campaign lifecycle.”
Pinterest chief revenue officer Bill Watkins
Why we care. The API and new features allow advertisers to view and predict trends, what users engage with, and how their future (and holiday) campaigns will stack up. They also give advertisers a more in-depth look at their conversion data and additional discovery tools for their audience.
Related Stories
New on Search Engine Land
About The Author
Nicole Farley is an editor for Search Engine Land covering all things PPC. In addition to being a Marine Corps veteran, she has an extensive background in digital marketing, an MBA and a penchant for true crime, podcasts, travel, and snacks.
Search Engine Land Awards 2022: And the winners are…
Every year, we are delighted to celebrate the best of search marketing by rewarding the individuals, agencies and in-house teams around the world that deliver exceptional results.
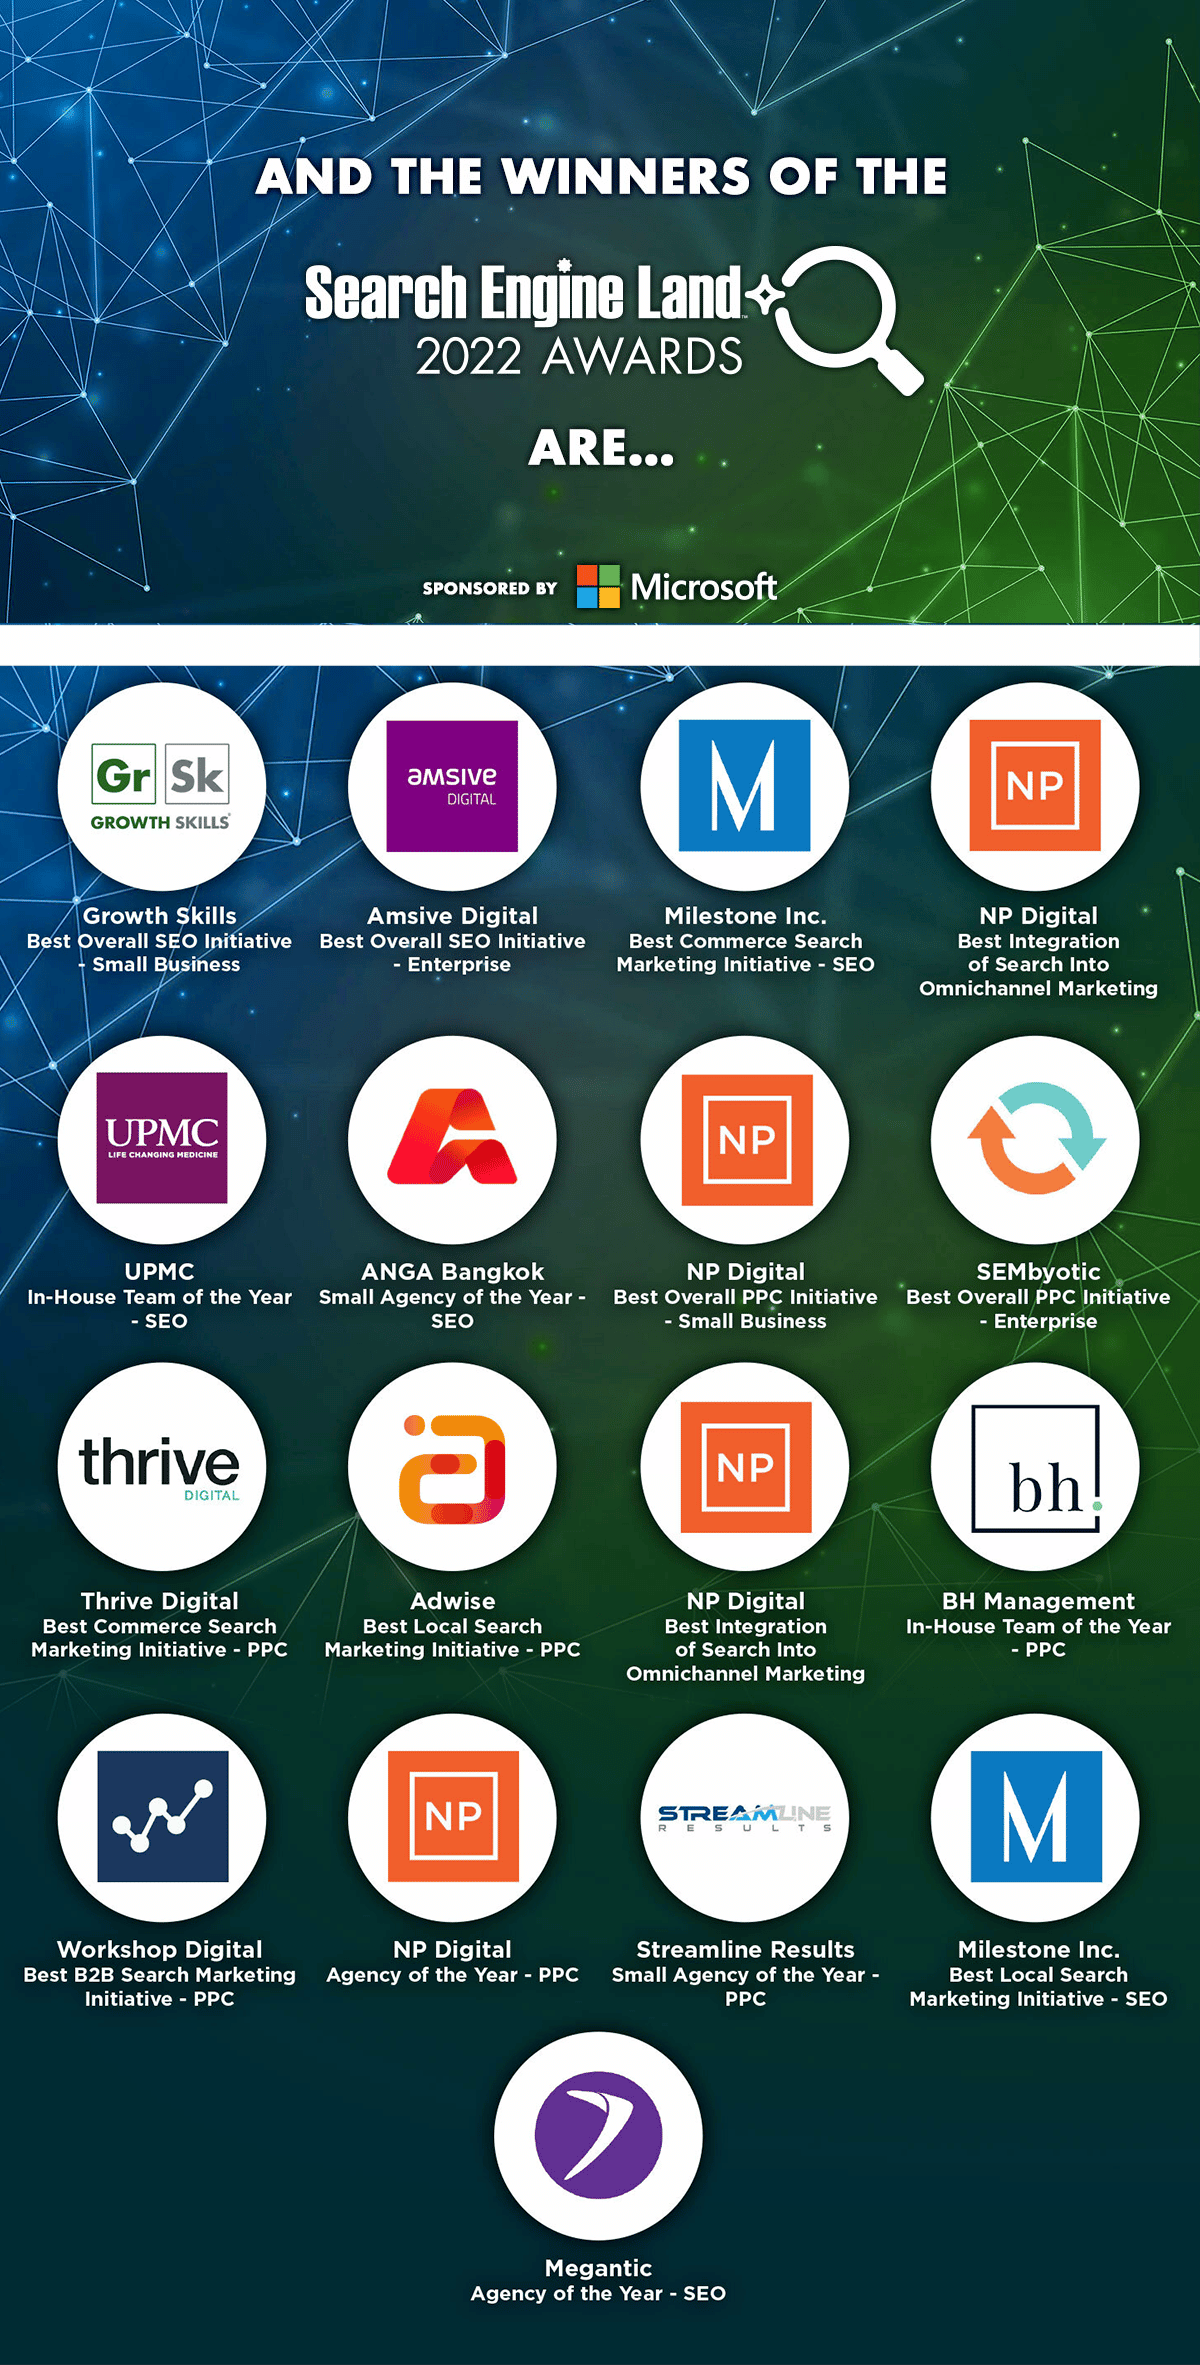
And today, on behalf of Search Engine Land and everyone at Third Door Media, we’re excited to announce the final 16 winners of the 8th annual Search Engine Land Awards.
As a reminder, we already announced the winners of two categories already here – Small Agency of the Year – SEO (ANGA Bangkok Co., Ltd.) and Small Agency of the Year – PPC (Streamline Results).
Here are the 2022 Search Engine Land Awards winners:
The 2022 Search Engine Land Award winners
PPC Campaign Award winners
Best Overall PPC Initiative – Small Business
NP Digital: Enhancing SEM strategy to elevate returns. How Mann Lake and NP Digital increased paid search revenue by 87% YoY.
Best Overall PPC Initiative – Enterprise
SEMbyotic: How SEMbyotic Helped Transform TCS By Growing Revenues 500% During the Pandemic
Best Commerce Search Marketing Initiative – PPC
Thrive Digital: How Thrive Digital bridged the gap in seasonality and restructured the account by prioritizing product profitability based on regions and automated feed-driven product segmentation. As a result, we reached 342% ROAS, exceeding the client’s target of 278%
Best Local Search Marketing Initiative – PPC
Adwise: Adwise & SPAR – 122% uplift in omnichannel ROAS with hyper local digital advertising strategy
Best B2B Search Marketing Initiative – PPC
Workshop Digital: How Workshop Digital Generated 2,400% ROAS for Super Radiator Coils’ with a custom PPC-CRM Feedback Loop
Best Integration of Search Into Omnichannel Marketing
NP Digital: Automation & crypto, a perfect match. How NP Digital drove omni-channel success for FTX.
SEO Campaign Award winners
Best Overall SEO Initiative – Small Business:
Growth Skills: How Growth Skills built the first media platform targeting cannabis, CBD and alcohol, leading to over 475% ROI via SEO & Content Marketing
Best Overall SEO Initiative – Enterprise
Amsive Digital: Livestrong and Amsive Digital Flex Their Expertise to Bulk Up Major Organic Gains
Best Commerce Search Marketing Initiative – SEO
Milestone Inc.: Milestone Inc. Helps Sun Outdoors Triple their Conversions and Online Revenue with a New State-of-the-Art Website that made a significant impact on their visibility on search – locally & organically for their locations
Best Local Search Marketing Initiative – SEO
Milestone Inc: Milestone Inc Helps SpeedPro Drive 93% Increase in Local Listing Views and 39% Increase in Online Leads Revenue with State-of-the-Art Local SEO Strategy
Best B2B Search Marketing Initiative – SEO
NP Digital: Matching WordPress intent.How we increased organic traffic by 514% for a core Nexcess product offering.
Team, Individual & Overall Award winners
Agency of the Year – PPC
NP Digital: Dynamic conversion value integration in paid search. Optimizing for global profitability across Tektronix’s complex sales journey.
Agency of the Year – SEO
Megantic: No Pain, All Gains with Supplement Mart’s Shopify Migration
In-House Team of the Year – PPC
BH: BH Breaks the Industry Mold with In-House Solution, Saving $500k in Management Fees
In-House Team of the Year – SEO
UPMC: Driving SEO Growth with a Little Help from our Friends
Search Marketer of the Year
Melissa Liu, RPA
“I’m going to SMX Next!”
Select winners of the 2022 Search Engine Land Awards will be invited to speak live at SMX Next during our two ask-me-anything-style sessions. Bring your burning SEO and PPC questions to ask this award-winning panel of search marketers!
Congrats again to all the winners. And huge thank yous to everyone who entered the 2022 Search Engine Land Awards, our fantastic panel of judges and our amazing sponsor of this year’s awards, Microsoft.
Related Stories
New on Search Engine Land
About The Author
Danny Goodwin is Managing Editor of Search Engine Land & SMX. In addition to writing daily about SEO, PPC, and more for Search Engine Land, Goodwin also manages Search Engine Land’s roster of subject-matter experts. He also helps program our conference series, SMX – Search Marketing Expo. Prior to joining Search Engine Land, Goodwin was Executive Editor at Search Engine Journal, where he led editorial initiatives for the brand. He also was an editor at Search Engine Watch. He has spoken at many major search conferences and virtual events, and has been sourced for his expertise by a wide range of publications and podcasts.
Google Ads label is now a bold black text Sponsored label
Google is rolling out a new search ad label, replacing the black “Ad” label with a new bold black text “Sponsored” label. This is rolling out in conjunction with the new site names and larger favicons in the mobile search results, Google announced.
What is looks like. Here is a screenshot of the new bold black “Sponsored” text ad label for the Google Ads:
Why the change. Google said this is to help “make sense of the information you see is ensuring that ads are clearly labeled.” A more prominent ad label, should do that, the search company said.
The new ad label, labeled “Sponsored,” is now featured on its own line in the top-left corner of Google Search ads.
Some ad label history. We will be updating our visual history of Google ad labels at some point, but for a quick refresher, Google rolled out a new treatment for labeling text ads in mobile search results in May 2019. In January 2020, Google extended that ad labeling and favicon treatment to desktop and quickly faced broad backlash over the further blurring of ads and organic listings, which Google hadn’t seen with the change to mobile. The company almost immediately backtracked and began experimenting with several treatment variations on desktop.
In 2007, Google changed the long-standing shaded background indicating the ads section of the page from blue to yellow. In 2008, it then briefly tried a green background before reverting back to yellow. Google continued to test variations of background colors including bright blue and a light violet. In 2010, violet officially replaced the yellow, but only lasted about a year before yellow reappeared in 2011. In 2013, Google tweaked the yellow to a paler shade, which would close out the era of background shading.
At the end of 2013, Google removed the background shading and began testing a yellow ad label next to each text ad. The yellow “Ad” label rolled out globally in 2014 in a much smaller size than first appeared in the initial testing. In 2016, a new green label marked the first time the color of an ad demarcation matched the color of an element in both the ads and organic listings: the display URL. A year later, Google kept the green, but inverted the treatments so that the font was green with a thin green border on a white background. This past year’s update to the black label does away with the border altogether, further, the display URL is now black to match the “Ad” label.
Why we care. Google said “this new label and its prominent position continues to meet our high standards for being distinguishable from search results and builds on our existing efforts to make information about paid content clear.”
A more distinguishable ad label may result in changes to your click through rates on your ads, so take notice and track to see if clicks go up or down over a period of time.
Related Stories
New on Search Engine Land
About The Author
Barry Schwartz a Contributing Editor to Search Engine Land and a member of the programming team for SMX events. He owns RustyBrick, a NY based web consulting firm. He also runs Search Engine Roundtable, a popular search blog on very advanced SEM topics. Barry can be followed on Twitter here.
Revenue optimization: 3 ways to get your advertising efforts right
Marketing departments once believed it was a sales issue if the sales team couldn’t work the leads from marketing.
Today, this is no longer the case.
Optimizing for leads or marketing qualified leads (MQLs) is great, but optimizing for what drives pipeline and revenue is better.
Marketers exist in a new age where it’s no longer satisfactory only to drive leads alone.
With the available technology and data today, we can do much more than identify hand-raisers to help companies spend their marketing dollars more efficiently and drive revenue.
Just because a channel generates leads doesn’t mean those leads bring value later in your sales funnel.
When you understand where customers are bringing in revenue vs. where they may need more nurturing before converting, you can create a more holistic media strategy to generate qualified leads that will churn out more income than lead volume alone.
Below are three must-haves for revenue optimization.
1. Tight-knit tracking
Tracking is essential for reasons that go well beyond reporting.
In this new age of artificial intelligence, it’s vital to feed machine learning the data that will make it do what you desire.
Platforms like Google optimize the data you provide, making it a powerful tool or your worst nightmare.
Accurately tracking your efforts plays a significant role in your advertising strategy’s success.
Integrating third-party data sources, like Snowflake and Salesforce, with your paid media reporting helps decrease the optimization time against a deeper funnel event, such as MQL, sales accepted lead (SAL) and revenue.
Nonetheless, offline conversion tracking in Google is great for seeing what campaigns drive down-funnel metrics like SALs and closed/won leads. If you’re attributing revenue to these conversions, that’s even better.
If your B2B advertising team is doing lead generation in Google without visibility into where they are going down funnel with offline conversion tracking, they are doing it wrong.
Get the daily newsletter search marketers rely on.
2. Understand the customer base
Marketers should know how users from different channels perform once they are in your sales funnel.
For example, if your average Google search lead value is 4x higher than a lead out of Facebook, how can you use that to prioritize your spending and channel goals?
Understanding your average time to close or how long it takes the lead to turn into revenue will help you only to further optimize toward revenue.
With that said, marketers should avoid reactivity with a down day or week if it can take up to a couple of months for a user to move through the sales funnel.
For example, if it takes two months for a lead to close, you need to give a new campaign or channel at least that long before making abrupt cuts if you aren’t seeing initial revenue.
Seasonality is also a critical factor to consider. Understand and prioritize the best time of year to capture your high-value users.
Create a plan to warm up those audiences earlier in the year and then nurture them post-initial conversion to move them along the sales funnel.
Targeting the right audience also helps you assign pipeline value to optimize revenue. Having an ideal customer profile (ICP) in mind for your targeting is an underrated piece of the puzzle.
Knowing what kind of people will be buying your product is paramount to getting your advertising efforts right.
For B2B, you should know their job titles, pain points, tasks and anything that will indicate if your product would make their lives easier. You should also be aware of your sales team’s lead disqualification criteria.
Will your sales team throw out leads from businesses that don’t meet a revenue threshold?
If so, don’t waste your marketing dollars on those disqualified leads when you can target revenue on other strong advertising channels.
3. Understand the lifetime value of customers
Teams optimizing for revenue should understand the value of their customers through customer lifetime value.
How can you optimize for revenue if you don’t know who your most valuable customers are?
Understanding the lifetime value (LTV) of your customer base and your customer acquisition cost (CAC) allows you to perform an LTV:CAC ratio analysis to get the complete picture of how your channel mix is affecting your advertising efforts.
Say Google is driving significant lead volume but at a .5 LTV:CAC. It might be time to dig a little deeper into Google to see how you can improve Google’s revenue-generating efficiency.
Generally, you’d like to see at least a 3:1 LTV:CAC when measuring this.
If you are having trouble calculating the LTV of your customers, Hubspot has a great article that can help you with this initial step.
The takeaway
CMOs are asked to demonstrate the value of every dollar put into marketing.
Leads are quickly becoming a metric of a bygone age where marketers could simply pat themselves on the back for a well-done job.
Today, any metric outside of revenue is a vanity metric to senior and executive leadership outside of marketing, making every dollar to customer acquisition and improving the bottom line.
Give the platforms the data they need to find the highest-value customers.
By doing so, you’ll empower the optimization of every effort for the success and growth of your organization, giving your CMO a few extra hours of sleep at night.
Opinions expressed in this article are those of the guest author and not necessarily Search Engine Land. Staff authors are listed here.
Related Stories
New on Search Engine Land
About The Author
Madalyn McConnell began her career in paid social campaigns in 2011 when Facebook only offered Page Like ads. Over the years, she’s worked for some of the world’s largest advertising and public relations agencies and managed paid social campaigns for various clients, including eBay, iRobot, GODIVA and TD Ameritrade. Madalyn now serves as a director of digital advertising at Closed Loop, empowering clients with her data-driven approach and expertise in paid media algorithms. Madalyn currently lives in Virginia with her family.
5 ways you’re hurting account performance when it comes to RSAs
After years of perfecting ad optimization strategies for expanded text ads (ETAs), advertisers must now re-learn optimization for responsive search ads (RSAs), the new default ad text format on Google since July 2022. Due to their newness, a strong consensus about optimization best practices for RSAs has yet to emerge. But there are known pitfalls we already know to avoid.
Read on if you’d like to learn some of the most common mistakes advertisers make when working with RSAs and how to use PPC management tools like the Google Ads UI or Optmyzr to prevent or fix them.
Automation layering puts humans in charge of improving PPC performance
RSA optimization follows a now familiar pattern where the best results are achieved by leaning into automation rather than fighting it. Here’s the formula for success in the age of PPC automation which Optmyzr’s co-founder Fred Vallaeys shared in his book “Unlevel the Playing Field”:
Machines + humans > machines alone
But with a looming recession and more scrutiny on the performance of digital ads, the humans of PPC are about to become even busier than they already are, and organizations might consider foregoing the significant benefits humans can bring to results and rely on just the automations from the ad engines. But for advertisers who want more results, more profits, and less wasted ad spend, technology can come to the rescue in the form of automation layering.
In automation layering, humans create lightweight automations to regain control of ad engine automations. Automation layers can set safeguards and boundaries or feed first-party data into the sophisticated Google AI that now controls much of what humans used to manage. Together this makes PPC perform better and faster while making fewer costly mistakes. The formula becomes:
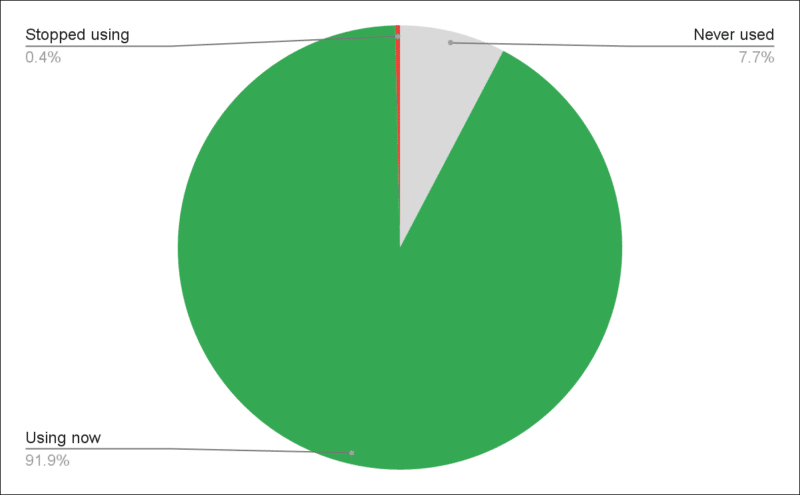
Percentage of accounts that contain responsive search ads. Source: 2022 Optmyzr study of RSA performance of 13,671 randomly chosen Google Ads accounts.
Having only ETAs is risky because once they stop performing as expected, they can’t be optimized. They also can’t be edited to reflect new promotions, something you’ll likely need to do as Q4 promotions ramp up across the industry.
Part of the reason some advertisers still rely on uneditable ETAs is that it can be hard to find ad groups that haven’t made the transition to RSAs yet. Those ad groups simply continue to run and may look fine in reports, obscuring the fact they’re running on outdated ad formats.
To transition your final ad groups to RSAs, scripts can come in handy. Optmyzr has an RSA migration script that downloads all ad groups without RSAs and prefills a bulk sheet with suggested ads. Because they’re in a spreadsheet format, it’s much easier to go through it quickly to make edits before posting them back to Google.
2. Ignoring your history of high-performing campaigns
If you ran search campaigns in Google Ads before RSAs became the default ad type, you’re already ahead of everyone starting now, especially if you also followed a few other best-practice guidelines:
Use of automated bidding or Smart Bidding
Proper use of seasonality adjustments
Offline conversion imports
Older accounts also have a leg up because they have more data, and machines thrive on data to learn patterns.
Advertisers transitioning existing accounts can use their best-performing ETA headlines and descriptions to start new RSAs. This action offers on average a 7% lift in conversions at a similar cost per conversion. This migration can easily be achieved with our RSA migration utility for Google and Microsoft.
3. Testing responsive search ads by conversion rate
The single largest mistake, short of ignoring RSAs completely, is when advertisers treat their RSAs like ETAs during testing. RSAs have the unique ability to adapt what they show to boost their relevance to any search query that comes in. Because they are built to increase relevance on the fly, they have better quality scores and get far more impressions than ETAs.
We found that ad groups with RSAs got 2.1 times more impressions than those with no RSAs. These additional impressions are the reason why modern ad optimization strategies must be revised and brought up-to-date as we’ll illustrate next.
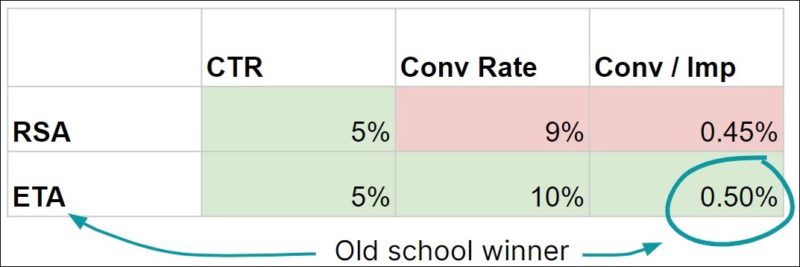
The old way of ad optimization favors the ad that delivers the most conversions per impression. But now that the ads, and not just the keywords, play a large role in determining the potential impressions, impressions themselves must also be factored into the analysis.
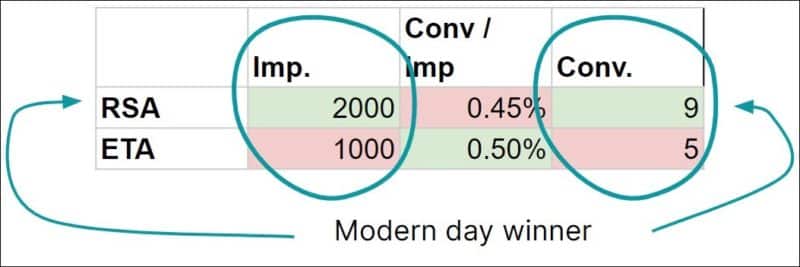
Look at the example below, where the ETA ad has a roughly 10% better conversions-per-impression ratio but gets only half the impressions as the RSA. The bottom line is the ETA ad delivers fewer conversions, primarily because it gets so many fewer impressions.
Old way: Focused on conversion rates or conversions per impression
New way: Focused on conversions within CPA or ROAS limits
In Optmyzr, advertisers control the algorithm that decides how A/B ad tests are decided. For example, you can limit the analysis to only compare ads that have similar impression volume. By enabling this power-user feature, you avoid pausing ads with lower conversions per impression that would have gotten more conversions due to their outsize impression volume.
4. Not experimenting with pinning
As we said before, we believe that humans + machines > machines alone. In addition to writing good assets, pinning is another easy way for humans to control the machines.
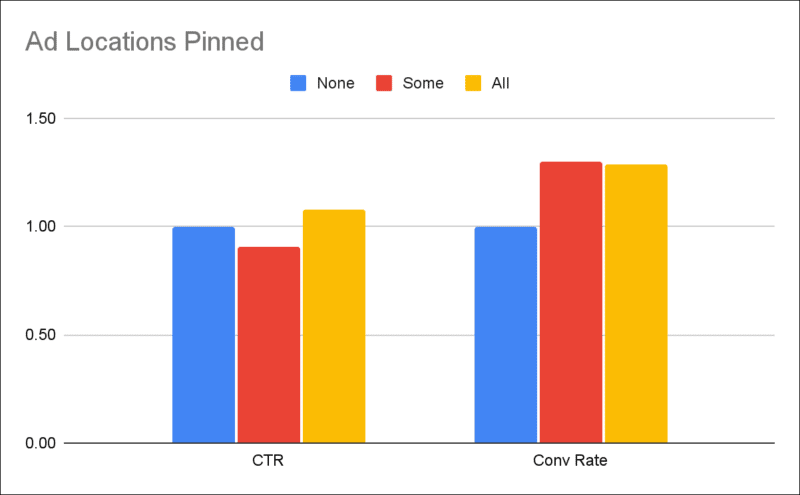
When pinning is taken to the extreme and one asset is pinned to every location, our study found the highest CTRs and conversion rates.
But before you go pin every part of your RSAs, don’t forget that high CTRs and high conversion rates are useless without impressions. The same pinning that produced better CTR and conversion rate is unfortunately responsible for limiting the impressions these ads get.
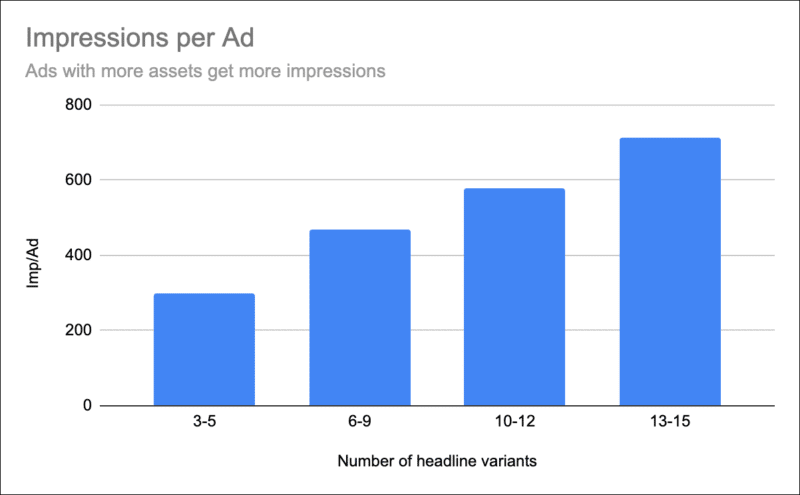
Google’s machines prefer when you allow them flexibility. In terms of RSAs, we found that the impressions per ad increase as you give the machines more options by adding more assets.
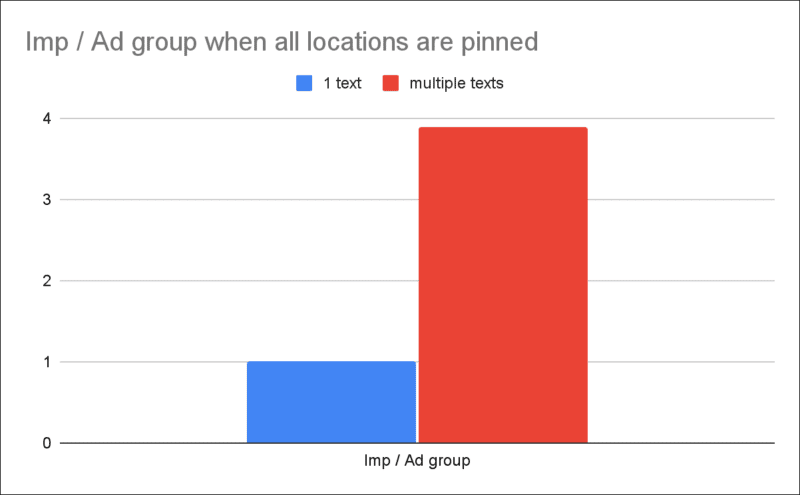
As for the impact of pinning just one asset per location, this leads to significantly fewer impressions for the RSA than when multiple assets are pinned to each location.
Pinning helps you control the machines, so use it to test ways to balance volume with quality. The best way to get statistically meaningful results is by using Google’s built-in ad variations tool which is part of their experiments framework. Optmyzr users can accelerate their own experimentation by using our Campaign Experiments dashboard to stay on top of all the experiments you run across the many accounts and campaigns you manage.
5. Not pairing RSAs with Smart Bidding and Broad Match
Automation likes it when advertisers remove constraints. We saw this in the data above when impressions soar by simply adding more ad text variations to an RSA. This also holds true for removing other constraints. So when you want more conversions, cautiously loosen up the match types to allow RSAs to show your ads for even more queries.
We’re not recommending a wholesale shift to broad match. Instead, test it while paying close attention to the query data and adding negative keywords as needed. This even works for Performance Max campaigns which can have negative keywords, either by asking your Google rep to add them to the campaign or by adding them to a shared negative list that is associated with the Performance Max campaign.
But loosening the reigns is only effective when you combine multiple tools for an effective automation layering strategy. Specifically, RSAs should be used in conjunction with automated bidding. Automated bidding can lower bids when it shows an RSA for a query with a more tenuous relevance to whatever your business sells.
Let’s illustrate this with an example. With a static $5 max CPC bid, the machine will bid $5 regardless of whether it believes the user is 20% or 80% likely to convert. In the case of the 20% probability, a $5 click means a $25 CPA ($5 / 0.20), whereas with the 80% probability, it’ll be a $6.25 CPA ($5 / 0.8). Smart bidding can account for the difference in conversion probability between different queries and help achieve a more consistent ROAS or CPA.
Conclusion
Google is adding more automations all the time and RSAs can drive incremental conversions at a reasonable cost, especially when complemented by other machine learning capabilities like Smart Bidding.
Optmyzr’s PPC optimization suite is evolving right alongside Google and now offers a full range of capabilities for creating, testing, and optimizing RSA assets and the ad groups/campaigns they run in. If you’d like to try it, take advantage of our free 14-day trial.
To learn more about modern ad optimization, sign up for UnLevel to get access to free RSA-focused content from Anne Bui (Puffer), Zenia Johnson (Outside Inc), Jyll Saskin Gales (Jyll.ca) and many more.
Related Stories
New on Search Engine Land
About The Author
Optmyzr’s PPC management platform provides intelligent optimization suggestions that help advertisers across the world manage their online advertising more effectively. Optmyzr connects with Google Ads, Microsoft Ads, Amazon Ads, Facebook Ads, Google Analytics, Google Merchant Center, Google Sheets, and SA360. The company was founded by former Google AdWords executives. The Optmyzr PPC suite includes over 30 tools to improve Quality Score, manage manual and automated bids, find new keywords, A/B test ads, build new campaigns, manage placements, automate budgets, and automate reports. Optmyzr was named best PPC management software at the 2020 US, UK, and Global Search Awards.
Search Engine Land Awards 2022: Complete finalists list
NP Digital leads the way in the 8th annual Search Engine Land Awards – the U.S. agency is a finalist in a whopping seven categories.
Two other agencies earning finalist status three times are Rocket Agency (Australia) and Logical Position (U.S.).
Meanwhile, 10 agencies are 2022 Search Engine Land Awards finalists two times (AEK Media, Amsive Digital, DAC, GA Agency, Megantic, Milestone Marketing, SEMbyotic, Thrive Digital, VMLY&R, Wpromote).
Small Agency of the Year – SEO and PPC
The competition was fierce in most of our categories – but in these two, the winners were clear. So we couldn’t think of a reason to wait to announce them:
The winner of the Small Agency of the Year – PPC is … Streamline Results.
The winner of the Small Agency of the Year – SEO is … ANGA Bangkok Co., Ltd.
Congrats to both agencies!
All the other winners of the 2022 Search Engine Land Awards will be revealed this Monday, Oct. 17.
Meet Search Engine Land 2022 award winners at SMX Next
We will be inviting some of the winners of this year’s awards to join us on Day 1 of SMX Next (Nov. 15). We’ll have two Ask Me Anything-style “Ask the Search Engine Land Award winners” panels – one on the SEO side, moderated by me, and one on the PPC side, moderated by Editor Nicole Farley.
NP Digital: Leveraging SEO & content to help build a brand. How we increased organic search traffic by 561% for Lantern.
Best Commerce Search Marketing Initiative – SEO
Click Intelligence & Anthem Branding – The Journey from Unranked to Page 1
GA Agency: 12 Countries, 4 Fashion Brands: Skyrocketing SEO
How Logical Position Helped Palouse Ranches Increase New Organic Traffic by 211% with Just 4 Keywords
Milestone Inc Helps Sun Outdoors Triple their Conversions and Online Revenue with a New State-of-the-Art Website that made a significant impact on their visibility on search – locally & organically for their locations
VMLY&R: Driving Visibility and Conversions Across a Diverse Ecommerce Portfolio
Best Local Search Marketing Initiative – SEO
How 3Q/DEPT increased leads by 330% for Source Capital Funding via Organic Search
Comrade Digital Marketing Agency: LASIK Goes Local: Growing Organic Traffic by 400+% for Elective Surgical Practice
Lastmile Retail: Transforming The Digital Local Customer Experience: T-Mobile x Lastmile Retail
How Logical Position Married Offsite and Onsite SEO To Increase NV Landscape’s Local Organic Traffic by 150% YOY
Milestone Inc Helps SpeedPro Drive 93% Increase in Local Listing Views and 39% Increase in Online Leads Revenue with State-of-the-Art Local SEO Strategy
Best B2B Search Marketing Initiative – SEO
How Advarra Outranked Third Party Reviews For Their Software Category
Finn Partners: Boosting organic traffic and rankings in a saturated in-car technology market
How LOCALiQ Increased Its Organic Search Traffic by 289% In Just 8 Months With SEO
NP Digital: Matching WordPress intent.How we increased organic traffic by 514% for a core Nexcess product offering.
How Tacomi utilised SEO to gain a 1,930% ROI for BMJ Careers
Agency of the Year – SEO
Dreamscape Marketing: Enterprise Scale Enterprise Outcomes: Performing a website and digital marketing conversion with speed to meet enterprise needs without sacrificing operations and supporting their rapid growth.
Megantic: No Pain, All Gains with Supplement Mart’s Shopify Migration
NP Digital: Leveraging SEO & content to help build a brand. How we increased organic search traffic by 561% for Lantern.
How Sherlock Communications Delivered a 193% Organic Visitor Increase for Betfair Colombia in a Competitive Industry Sector Using a Content First Strategy
Wpromote: Flying High: How Wpromote Grew Organic Revenue by 550% for Travelpro
In-House Team of the Year – SEO
How Razorfish exceeded a client target that others considered impossible
How the T-Mobile SEO team recruited top in-house talent, accelerating innovation and driving business growth
UPMC: Driving SEO Growth with a Little Help from our Friends
Best Overall PPC Initiative – Small Business
How Brandastic established our client as the #1 DTG Printer Brand in North America 2021
NP Digital: Enhancing SEM strategy to elevate returns. How Mann Lake and NP Digital increased paid search revenue by 87% YoY.
Primal Malaysia Delivered 323% ROI for Easy Consulting
How Rise Interactive Scaled Cross-Channel Results with Performance Marketing & Closed Loop Reporting
How Our Agency Vivid Candi Increased Leads by 800% and Sold Out a 6-Figure Housing Product In 3 Months
Best Overall PPC Initiative – Enterprise
Healthy Paws & Amsive Digital Making it Rain Search Lift (or cats & dogs)
Bayer Consumer Health: Increasing In-Store ROAS driven by Search Media by 2-3x for a CPG/OTC Brand!
How Rocket Delivered 331% leads above target for Noggin via Google Ads
How SEMbyotic Helped Transform TCS By Growing Revenues 500% During the Pandemic
VMLY&R: United Rentals: Localization Strategy Increases Yearly Revenue by 71% to $18.6 Million
Best Commerce Search Marketing Initiative – PPC
Beeby, Clark+Meyler: How The Parking Spot paid search program drove a 39% increase in reservations over pre-pandemic Q2 2019
Katté & Co and SPOKE – quadrupling non-brand revenue for a fast-growing British men’s clothing brand
How Mad Fish Digital Leveraged Full-Funnel Strategy and Google’s AI to Deliver a 1,058% ROAS for Schoolhouse Electric
How Thrive Digital bridged the gap in seasonality and restructured the account by prioritizing product profitability based on regions and automated feed-driven product segmentation. As a result, we reached 342% ROAS, exceeding the client’s target of 278%
Thrive Digital: How Smith Optics scaled revenue from Google channels 120% YoY by expanding tactics and implementing best practices.
Best Local Search Marketing Initiative – PPC
Adwise & SPAR – 122% uplift in omnichannel ROAS with hyper local digital advertising strategy
How DAC helped Aqua-tots drive a 300% increase in store visits
DAC & StorageMart: Driving occupancy with paid media
Ovative Group: Local Campaigns Drove over 60% of Duluth Trading’s Store Visit Growth YoY
How Stella Rising SEM Helped Big Y Pivot to Online Grocery Amidst Consumer Behavior Changes
Best B2B Search Marketing Initiative – PPC
A mid-funnel mindshift. How ConnectWise and NP Digital increased ROAS of paid search by 100%.
How SEMbyotic Helped Transform TCS By Growing Revenues 500% During the Pandemic
How Statwax Scaled a B2B SaaS Unicorn’s Search Ad Spend 20X While Improving Profitability & Customer Growth
The Media Image & LSEG – Doing More with Less at a Global Scale
How Workshop Digital Generated 2,400% ROAS for Super Radiator Coils’ with a custom PPC-CRM Feedback Loop
Best Integration of Search Into Omnichannel Marketing
AEK Media: How an Omnichannel Approach led to 130% Month-on-month Sales Growth in Their First Year Online | Tasman Eco
Automation & crypto, a perfect match. How NP Digital drove omni-channel success for FTX.
Rakuten Advertising x Vans Omnichannel Bidding
Rocket & Rezdy | Scaling Software Sales Globally with Digital
UPMC: Building upon our Health and Wellness Brand to Deliver Timely Content during COVID-19 Pandemic
Agency of the Year – PPC
How Adviso Delivered a 50% increase in revenue for SAIL via Search
Horizon Media: Beating the Headwinds with Localized Profitability
NP Digital: Dynamic conversion value integration in paid search. Optimizing for global profitability across Tektronix’s complex sales journey.
Rocket & Rezdy | Scaling Software Sales Globally with Digital
Wpromote & Intuit QuickBooks: Harnessing First-Party Data to Drive Paid Search Success
In-House Team of the Year – PPC
BH Breaks the Industry Mold with In-House Solution, Saving $500k in Management Fees
HSBC UK: How an Newly In-Housed Team Delivered Record-Breaking Growth Within a Year’
Wiley University Services: In-House Media Team Outperforms Industry Trends by Increasing Leads and Enrollment for University Partners
Search Marketer of the Year
David Grow, Goodway Group
Heath Hamilton, Megantic
Melissa Liu, RPA
Nicolas Villeneuve, Adviso
Vandana Kumar, Megantic
A huge thank you to our judges
A much-deserved thank you to our awesome group of judges for the 2022 Search Engine Land Awards. Our panel of judges had the difficult assignment of selecting the best of the best from a large number of submissions. Thank you:
Amanda Jordan
Brad Geddes
Brett Bodofsky
Mordy Oberstein
Tess Voecks
Thom Craver
Barry Schwartz
Nicole Farley
Anu Adegbola
Benu Aggarwal
Crystal Carter
Greg Finn
John Lee
Vani Chopra
Related Stories
New on Search Engine Land
About The Author
Danny Goodwin is Managing Editor of Search Engine Land & SMX. In addition to writing daily about SEO, PPC, and more for Search Engine Land, Goodwin also manages Search Engine Land’s roster of subject-matter experts. He also helps program our conference series, SMX – Search Marketing Expo. Prior to joining Search Engine Land, Goodwin was Executive Editor at Search Engine Journal, where he led editorial initiatives for the brand. He also was an editor at Search Engine Watch. He has spoken at many major search conferences and virtual events, and has been sourced for his expertise by a wide range of publications and podcasts.
Google launches new content suitability center in Google Ads
Google has launched a new content suitability center in Google Ads where you can manage your suitability settings for all campaigns on YouTube and the Google Display Network.
Google wrote, “previously, managing suitability settings was done in multiple, segregated sections of Google Ads and the experience differed across Google platforms.” “This led to a time-consuming and cumbersome implementation process, along with misconceptions and misuse of the controls. While exclusions can be helpful tools, brands also want to be mindful of the types of content they choose to exclude. Over-exclusion can negatively impact your cost and reach. It can also unintentionally exclude great, brand-safe content or content relevant to diverse communities,” Google added.
New suitability center. The new suitability center in Google Ads allows you to manage the suitability controls under a single point-of-entry. You can use the content suitability center to easily set your suitability preferences for inventory modes and exclusions across YouTube and the Google Display Network.
Here is a screenshot of it:
More details. When you enter the new suitability center in Google Ads, you can now select one of the three inventory modes. Inventory modes “cater to your preferences for various sensitive themes, such as profanity, sexual suggestiveness and violence,” Google explained. You can fine-tune additional exclusions from that point. Once you have designated your preferences at the account level, Google Ads will now automatically apply these settings to your future campaigns.
Why we care. This should save you time, reduce errors and improve the management of these controls in a more central place. Google added the company will share more “in the coming months to help you continue to align with what works best for your brand identity and navigate the growing landscape of content.”
Related Stories
New on Search Engine Land
About The Author
Barry Schwartz a Contributing Editor to Search Engine Land and a member of the programming team for SMX events. He owns RustyBrick, a NY based web consulting firm. He also runs Search Engine Roundtable, a popular search blog on very advanced SEM topics. Barry can be followed on Twitter here.
Nowadays, conversion is usually preceded not just by one but several interactions with a website or an app.
Attribution determines the role of each touchpoint in driving conversions and assigns credit for sales to interactions in conversion paths.
As Google’s deprecation of Universal Analytics (UA) nears, it’s crucial to understand attribution in Google Analytics 4 (GA4) – including what is new, what is missing, and what the differences mean for search marketers.
Universal Analytics reports attributed the entire credit for the conversion to the last click. A direct visit is not considered a click, but for the avoidance of doubt, this attribution model was also called the last non-direct click model. Other attribution models were only available in the Model Comparison Tool in the Multi-Channel Funnels (MCF) reports section.
GA4 offers a wider availability of different attribution models, but it depends on the scope of the report – whether it is the user acquisition source, session source or event source.
In Universal Analytics, the source dimensions had session scope solely. The MCF reports made it possible to analyze the sources of all sessions on the conversion path. The three scopes of source dimension in GA4 (user, session, event) are the most important and fundamental changes in the attribution area.
This guide will use the term “source” in a broader meaning as any dimension that indicates the origin of a visit, e.g., channel grouping, source, medium, ad content, campaign, ad group, keyword, search term, etc.
Session source
Session-scope attribution – unsurprisingly – determines the source of the session. It is used, among others, in the Traffic acquisition reports in the Reports section. It works similarly to Universal Analytics in always using the last non-direct click model.
The session source is the source that started the session (e.g., social media referral or organic search result). However, if a direct visit started a session, the session source will be attributed to the source of the previous session (if there was any).
Quick reminder: A direct visit means that Analytics does not know where the user came from because the click does not pass the referrer, gclid, or UTM parameter.
Therefore, exactly as it was in Universal Analytics, the session source will be direct only if Analytics cannot see any other source of visit for the given user within the lookback window. The default lookback window in GA4 is 90 days, while in Universal Analytics, it was six months by default. We will return to the lookback window matter later in this article.
By the way, what is a session?
A Google Analytics session is not the same as a browser session.
In GA4, a session begins when a user visits the website or app and ends after the user’s inactivity for a specified time (30 minutes by default – see this Analytics help article).
Closing the browser window does not end the session. If the browser window is closed, another visit to the website within the time limit would still belong to the same session – unless the browser deletes cookies and browser data after closing the browser window, for example in incognito mode.
In Universal Analytics, when a user re-visits the website from a new source during an existing session, the existing session is terminated, and a new session starts with that new source.
In GA4, it is no longer the case. If a visit from a new source occurs during a session, a new session will not start, and the source of the current session will remain unchanged.
It does not mean that the visit from the new source is ignored. GA4 records the source of this visit, and the event-scope attribution reports (more on that later in this article) will take into account all sources of all sessions. (See this Analytics help article.)
A new visit during an existing session may happen, for example, if a user returns from a payment gateway or a webmail site after password recovery or registration confirmation. In GA4, these visits will not artificially inflate the number of sessions, as in Universal Analytics.
In GA4, these visits are de facto ignored because the session source and the session count remain unchanged. The non-direct attribution modeling in GA4 will assign no credit to this (direct) source (as described later in this article).
In Universal Analytics, the session (regardless of duration) ends at midnight, which is no longer the case in GA4.
First user source
First user source (source of the first visit) is new to GA4. It shows where the user came from to the website or app for the first time.
It is a part of Google’s new approach to measurement in online marketing, which no longer focuses only on the classic ROAS (revenues vs. costs), but also analyzes the CAC vs. LTV (customer acquisition cost vs. lifetime value).
This approach reflects the app logic: we have to acquire the app user first, and after the app is installed, further marketing efforts engage and monetize the user. However, for the web traffic, it also makes more sense.
In GA4, the first user visit is recorded by the first_visit event for the website or the first_open event for the app. The naming is self-explanatory.
Therefore, the source of the first visit is a user attribute and indicates where this user’s first visit to the website or application came from.
The first visit source is attributed using the last non-direct click model. Of course, this attribution applies only to interactions before the first website visit or the first open of the app (interactions following the first visit or first open are not taken into account).
Once assigned, the source of the first visit remains unchanged – of course, as long as Google Analytics can technically link the user’s activity on the website and in the app with the same user.
The first user source will be reset if the tracking of the user is lost, for example, if the user does not visit the website for a period longer than the Analytics cookie expiration date.
We will return to the Analytics cookie expiration period and other data collection limitations in GA4 later in this article.
Event scope attribution
In GA4, events replaced sessions as the fundament of data collection and reporting. GA4 makes it possible to report attribution using a selected attribution model for any event (not only for conversions).
The model is set in the Attribution Settings of the GA4 property. There are several pre-defined models to choose from (see the screen below).
The default data-driven model can be changed at any time. This change is retroactive (i.e., it will also change the historical data).
A common belief is that Google Analytics 4 no longer uses the last-click attribution model. But is that the case?
In practice, it applies only to customized reports that use event-scope dimensions and metrics, for example, Medium – Conversions.
The default traffic and user acquisition reports use session source and first user source, respectively, and these dimensions use the last click model. It is indicated in the dimension name (e.g., Session – Campaign or First User – Medium).
Remember: source, session source and first user source are three different dimensions where different attribution models apply.
Scope
Attribution Model
Where available
Session
Last click
E.g., traffic acquisition reports
User (first user source)
Last click
E.g., user acquisition report
Event
Model set in the GA4 property settings (data-driven by default)
E.g., in the Explore section
Attribution settings
The attribution model set in the property settings applies to all reports in the property.
There are several attribution models, known from Universal Analytics (described in the earlier mentioned Analytics help article), to choose from. However:
All the models do not assign value to direct visits unless there is no other choice because there is no other interaction on the path. In other words, they all use the non-direct principle, which was not the case in the Universal Analytics pre-defined attribution models, except for the last non-direct click model.
The Ads-preferred models assign the entire conversion value to Google Ads interactions if they occur in the funnel. At the moment, there is only one Ads-preferred model available – the last click model, which is the equivalent of the “last Google Ads click” known from Universal Analytics. In the absence of Google Ads interactions on the funnel, this model works like a regular last-click model.
In addition to clicks, models take into account “engaged views” of YouTube ads, that is, watching the ad for 30 seconds (or until the end if the ad is shorter) and other clicks associated with that ad (see this Google Analytics help article for more details).
Again, a change of the attribution model settings works retroactively (i.e., it applies to the historical data before the change). Saved explorations will be recalculated when viewing them.
Lookback window
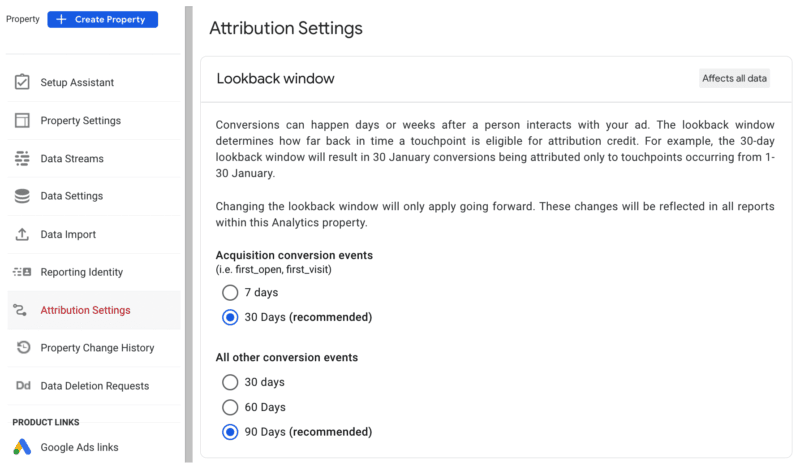
Google Analytics property settings determine the length of the lookback window. The lookback window determines how far back in time a touchpoint is eligible for attribution credit. The default lookback window is 90 days, but you can change it to 60 or 30 days.
According to Analytics documentation, the lookback window settings apply to all attribution models and all conversion types in Google Analytics 4 (i.e., it also applies to session-level attribution and attribution model comparisons).
The lookback window of the first user source has a separate setting (30 days by default, and it can be changed to 7 days). Are you wondering why it is defined differently?
Well, first of all, it is worth considering why there is any lookback window for the first visit at all.
Moreover, why are we talking about the first user attribution model, which is always the last (non-direct) click?
After all, GA4 knows the source of the first visit when this visit happens. As it is the first visit, there are no previous visits, and thus no other sources to consider.
So, what is the point of looking deeper in time than the first interaction with a website or app?
The answer is Google Signals. If this option is enabled for the GA4 property in the Data Collection settings, GA4 will enrich the data collected by the tracking code with, among others, information known by Google about logged-in users.
For example, Google may know that the user had an engaged interaction with our YouTube ad on a different device before the first visit.
Similarly, the user may use the app for the first time (first_open) during a direct session, but the install itself may result from a mobile app install campaign in Google Ads, clicked a few days earlier.
Therefore, if the source of the first visit session is unknown (it is a direct visit), Google Analytics may try to assign the source of the first visit to the earlier known interaction if it occurred during the lookback window period.
In other words, thanks to Google Signals, GA4 may record ad interactions before the first user visit.
Lookback window changes do not work retroactively. It means that they only apply from the moment of the change.
The engaged views of YouTube ads, however, always have three days lookback window, regardless of the property settings.
Get the daily newsletter search marketers rely on.
Bye to cookie logic?
It is a nuance but worth noting. Universal Analytics’s default lookback window for the acquisition reports was six months, and any change to this period was also non-retroactive.
Such a change, however, did not apply to conversions but to interactions that had taken place after the change. It reflected the logic of the _utmz cookie, which was responsible for storing the source information.
Its expiration time was set when the cookie was created or updated (i.e., upon a visit from a given source). Universal Analytics no longer uses the _utmz cookie (it was used in earlier versions), but the logic was maintained for data consistency.
For example, changing the lookback window in Universal Analytics from 30 to 90 days did not immediately include interactions from 90 days ago in the acquisition reports for the visits since the date of the change because the virtual “source cookie” for interactions older than 30 days has already “expired.”
There was a transition period (in this example, 90 days), after which all conversions were fully reported under the new lookback window.
Google Analytics 4 uses a different data model, with no continuity with the UA data. They could therefore break with this past and stop using the cookie logic.
For example, they could apply changes to all conversions that have taken place since the change, as it is now in Google Ads. Interpreting such would be much easier. They could, but they did not.
In GA4, the change applies to interactions still in the lookback window.
For example, if the lookback window is increased from 30 to 90 days, the conversions will not immediately be reported in the new, 90 days lookback window. It will be reflected in the reports after 60 days from the date of change (the interactions from the initial 30-day lookback window will be remembered).
Reducing the lookback window (e.g., from 90 to 30 days) will apply the change immediately (i.e., all conversions will be reported in the shorter, 30 days window).
Yes, it sounds exotic. Fortunately, in practice, the analysts do not change the lookback window often.
Cookie expiration and data retention
The Google Analytics 4 cookie has a standard expiration time of 24 months, but it can be changed to a period between one hour and 25 months (or the cookie may be set as a session cookie and expire after the browser session end).
Subsequent visits may renew this time limit. This will be the period in which Analytics will be able to recognize a returning user and remember the source of the first visit – see this GA4 help article).
However, it does not automatically mean that GA4 will “remember” user data that long.
In addition to the cookie expiration, we also have to deal with the GA4 data retention period. It is set by default to only two months, but you can (and basically, you should) change this setting to 14 months. (In the paid version, Google Analytics 360, it can be up to 50 months.)
After this time, Google deletes user-level data from Analytics servers. To keep this data, you must export it to BigQuery (see this GA4 help article).
It means that reports in the Explore section can only be made within the data retention period (please note that in the Explore section, you cannot select a date range beyond this period).
These restrictions do not apply to standard reports in the Reports section that use aggregated data. GA4 will store this data “forever.”
In the unpaid version of GA4, the first user source data are deleted after 14 months of inactivity. After that, this user will be recorded as a new user.
Therefore, there is no point in, for example, changing the cookie expiration time from default 24 months to a longer period, unless you use Google Analytics 360.
Conversion export to Google Ads
Exporting conversions to Google Ads is often used as an alternative to the native Google Ads conversion tracking, as the fastest and most convenient way to implement conversion tracking in Google Ads.
However, this time-saving seems illusory in the era of Google Tag Manager. Moreover, this solution has many disadvantages.
There are several arguments against using imported conversions from Google Analytics to optimize Google Ads. It:
Reduces the number of conversions observed in Google Ads.
Uses exotic attribution.
Is vulnerable to unforeseen Google Analytics configuration and link tagging errors, such as unwanted referrals or redundant UTM parameters.
Therefore, while importing conversions from Analytics may provide interesting data that cannot be collected in Google Ads, using them as goals for optimizing Google Ads campaigns may not be optimal.
If you import conversions from GA4 to Google Ads, regardless of the GA4 attribution settings, the conversions will be imported using the GA4 last non-direct click model.
This means you will only import conversions whose Google Ads source has not been overwritten by subsequent clicks (e.g., organic search results or social media ads).
Regardless of the property-level attribution settings, Google Analytics allows comparisons of different attribution models in the Advertising section.
Currently, the available models are the same as those available in the property settings, and it is impossible to create custom models.
Interestingly, GA4 allows reporting in two conversion attribution time methods – interaction time and conversion time (only the latter option was available in Universal Analytics).
The interaction time method is typical for advertising systems, where conversions are attributed to clicks and, thus – costs. It allows a correct match between costs and revenues.
Otherwise, the reports might include conversions after the end of the campaign, in a period when there is no ad spend.
On the other hand, the interaction time method may cause the total number of conversions to change depending on the attribution model, as different models may attribute conversions or their fractions to clicks outside the reporting period.
Moreover, the conversion count and revenue for a given reporting period may grow over time until the lookback window closes.
In other words, we may observe more conversions for the recent period if we look at the same report in the future – which is not the case when conversions are reported in the conversion time.
Both approaches have advantages and disadvantages, so it is good that we can now use both.
Conversion paths report
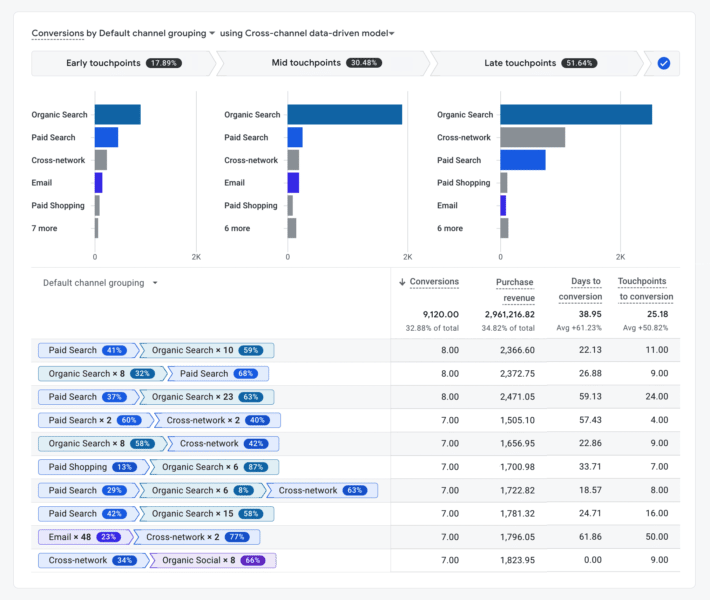
Compared to Universal Analytics, the GA4 conversion paths report is enriched with additional data: time to conversion and the number of interactions for a given path.
It partly compensates for the lack of time lag and path length reports, which were separate reports in Universal Analytics.
The ability to choose an attribution model for this report may be surprising at first sight.
The attribution model does not affect conversion paths. They remain the same, and their length and time to conversion do not change.
In GA4, the path visualization also includes the fraction of conversion assigned to a given interaction or their series in the selected attribution model.
In the last click model, the last interaction always has a 100% share in the conversion, but in the other models, the distribution will be different.
This feature also allows a better understanding of how the data-driven model worked for the interactions in this report.
Additional bar graphs are placed above the funnel report, visualizing how the selected attribution model assigned a value to channels at the beginning, middle and end of the funnel.
The early touchpoints are the first 25% of the interactions along the path, while the late touchpoints include the last 25%. The middle touchpoints are the remaining 50% of the interactions.
If you feel that the distribution between early, middle, and late touchpoints does not look as expected for the multi-touch models, please note that if there are only two interactions, there is one early, one late, and no middle interactions.
If there is only one interaction, for the multi-touch models, it will be reported as late interaction – which distorts these reports the most.
Probably, it would be better if the only interaction was considered as 33.3% early, 33.3% middle, and 33.3% late interaction.
Thus, the attribution model will only affect the bar charts at the top of the report and the percentages shown in the funnel visualization.
The table figures (funnel interactions, conversions, revenue, funnel length, and time to conversion) will remain the same, regardless of the attribution model.
By default, the conversion paths and model comparison reports include all conversions in the GA4 property. Therefore, it is worth remembering to select the desired conversion first.
Use of scopes in the reports
Again, the source dimensions in GA4 can have one of three scopes: session, user, and event.
In the case of the event scope, the attribution model specified in the property attribution settings is used.
The session source (session scope) is assigned to the last non-direct interaction at the session start and remains unchanged for a given session, even if there is a visit from another source during the session. It’s the “first source” of the session, although assigned in the last-click model.
Similarly, the first user source (user scope) is assigned to the last non-direct interaction before the first visit and remains unchanged.
In Google Analytics, all dimensions and metrics operate within their own scope. For example, the Landing page dimension has the session scope, and the Page dimension has the event scope.
Although technically possible, using dimensions and metrics of different scopes can sometimes lead to confusing or difficult-to-interpret reports.
For example, the Page dimension should be matched with Page views, not Sessions. If we combine Pages with Sessions, Universal Analytics will show the number of sessions similar to Landing page vs. Sessions report.
In GA4, this will be the number of sessions during which a given Page has been visited, and therefore, the sum of sessions for all Pages will be greater than the total number of Sessions.
But if you think about it, there is little point in making such reports – therefore, the uncertain interpretation of these numbers should not worry us too much.
However, some reports using dimensions and metrics of different scopes will make sense. For example, for source dimensions in GA4:
The number of events (event scope) paired with the First user source dimension (user scope) shows how many events were generated by users whose first visit was from a given source.
The number of events (event scope) paired with the session source dimension (session scope) shows how many events were generated by users during sessions with a given source.
The GA4 documentation fails to indicate how to interpret the number of sessions or users matched with the event scope. Such explorations, although possible, often contain many not set values.
However, creating such reports doesn’t make sense. (See the previously mentioned GA4 help article on scopes.)
Modeled data
Finally, it is worth emphasizing the fundamental change in Google Analytics 4, where reports include data collected by the tracking code enriched with modeled data.
The modeled data uses information collected in the cookieless consent mode for users who have not given consent to tracking and Google Signals data for users logged in to Google. This data is fragmentary, but Google can fill in the missing data using extrapolations and mathematical modeling.
Thanks to Google Signals, in GA4, we can see an approximate but more complete picture of the user’s journey.
For example, Universal Analytics recorded an iPhone user who visited the website from a YouTube ad using Safari and never returned.
Universal Analytics also saw a conversion made by another user who came from a direct visit on the Chrome browser for Windows.
Google knows these events belong to the same user because this user was logged into Gmail and YouTube.
This is how Google Analytics 4, using Signals, can model the cross-device users’ behavior. It makes the reported number of users more real (reduces it) and improves the attribution accuracy.
In the example above, the conversion from the direct session can be correctly attributed to the YouTube ad.
Not all users are always logged into Google – many do not even have a Google account.
Therefore, to make the picture more complete, Google Analytics will assume that users who are not logged in behave similarly.
Consequently, GA4 sometimes will supplement the missing sources (e.g., assign certain sources to conversions that were previously assigned to direct).
The behavior of users who have not given consent to tracking is estimated similarly.
Analytics knows the number of page views and conversions from the non-consented users and can model how many users generated these pageviews and conservatively attribute conversions to sources.
Enriching Analytics data with Google Signals may take up to a week. Therefore, the recent data may change in the future.
Please note that we also dealt with delays in Universal Analytics, where most reports could have delays of up to 48 hours.
Various privacy-oriented technology solutions, such as PCM by Apple or similar solutions proposed by Google (the Privacy Sandbox), randomly delay conversion reporting by 24-48 hours.
Therefore, we must get used to the fact that the full view of analytical data will only be available after some time.
In GA4, we can also enhance the reports using the 1st party data, namely the User-ID.
This feature was also available in Universal Analytics, but the separate “User-ID View” included the “logged-in” sessions with User-ID solely and, honestly, wasn’t that useful.
GA4 reports combine the User-ID data with the Client-ID (the Analytics cookie identifier) and Google Signals, which makes the data more complete, especially in the cross-device aspect and LTV measurement.
The complexity of these processes may cause greater or lesser discrepancies between the data in different reports.
We should get used to it, but hopefully, as GA4 recovers from childhood illnesses, these discrepancies will become less and less significant.
It is worth remembering that Google Analytics is not accounting software.
Its objective is not to record every event with 100% precision but to indicate trends and support decision-making – for which approximate data is sufficient.
Author’s note: This article was written using Google help articles, answers given by Analytics support and results from my experiments.
Opinions expressed in this article are those of the guest author and not necessarily Search Engine Land. Staff authors are listed here.
Related Stories
New on Search Engine Land
About The Author
Founder and CEO of Adequate Interactive Boutique, awards-winning marketing consultancy. Certified Google Ads and Analytics specialist since 2007. Author of numerous publications, conference speaker, and university lecturer. Expert in measurement, attribution, and profit-driven media optimization.
Alexa users claim Amazon is using voice recordings to target ads
Alexa users are suing Amazon over claims that the voice assistant app is targeting users with ads relevant to private recordings of users’ conversations.
The central complaint. The main complaint of Alexa users is that the voice assistant is wrongly using voice recordings captured by Alexa to target ads.
“The central theory of this lawsuit is that Amazon uses Alexa voice recordings (i.e., the captured sound of a user’s voice) to serve interest-based ads to that user. In their complaint, plaintiffs conspicuously never allege facts showing that Amazon uses Alexa recordings to serve interest-based ads (because they have no good-faith basis for that allegation),” the company adds. “The complaint instead uses the intentionally vague term ‘voice data’ for the notion that certain transaction data resulting from Alexa interactions is sometimes used for advertising. Yes, it is, and Amazon widely and clearly discloses that fact.”
U.S. District Court Judge Barbara Rothstein
The plaintiff’s suit. Ohio resident James Gray and Massachusetts resident Scott Horton brought the class-action complaint against Amazon for allegedly using “Alexa-collected voice data” for ad targeting. They raised several claims, including that Amazon violated users’ privacy, and that it engaged in misleading and unfair conduct.
Get the daily newsletter search marketers rely on.
What Amazon says. Amazon said “it “is not in the business of selling data,” and doesn’t share Alexa requests with ad networks.
The company added: “Similar to what you’d experience if you made a purchase on Amazon.com or requested a song through Amazon Music, if you ask Alexa to order paper towels or to play a song on Amazon Music, the record of that purchase or song play may inform relevant ads shown on Amazon or other sites where Amazon places ads.”
Amazon urged judge Rothstein to dismiss the lawsuit claiming that even if the allegations were true, there wouldn’t be any proof that the company sed voice recordings for ad purposes.
Amazon also said “If a customer buys dog toys from Amazon, that fact can be used to generate interest-based ads, regardless of whether the customer ordered by typing on amazon.com or speaking a voice command to an Alexa-enabled device,” the company wrote. “But records of the customer’s transactions, whatever the input medium, are different from Alexa voice recordings or transcripts themselves.”
They added “When a customer uses a physical keyboard to make a purchase on amazon.com, the data from that transaction is not ‘derived from’ the customer’s typing, nor would anyone argue that Amazon is ‘using’ that person’s keystrokes,” Amazon argues. “Similarly, if someone types a purchase command into the Alexa app, the transaction data associated with that command is captured and might be used for advertising (as Amazon widely discloses).”
Why we care. With cookies disappearing in 2024, privacy is at the forefront of ad platforms and advertisers’ strategies to deliver relevant ads to an audience that may or may not become harder to reach. But Amazon’s blatant disregard for users’ personal space and private conversations goes beyond cookies and into a realm that’s just plain invasive.
I’ll be curious to see if Amazon is held liable for these claims and what the company does to remedy the situation as users become more aware, and intolerant of privacy abuse.
Related Stories
New on Search Engine Land
About The Author
Nicole Farley is an editor for Search Engine Land covering all things PPC. In addition to being a Marine Corps veteran, she has an extensive background in digital marketing, an MBA and a penchant for true crime, podcasts, travel, and snacks.