Income Stock of the Week: Steelcase (SCS)

Welcome to the brand new feature of StockNews.com where investing expert, Jay Soloff, will highlight his Income Stock of the week. To kick things off Jay has selected Steelcase (SCS). Learn why below….

Amazon CEO Andy Jassy recently told employees they needed to be working in the office at least three days a week, or, in his words, “it’s probably not going to work out for you at Amazon.” These were strong words from the nation’s second largest employer, and a clear sign that employer tolerance of the work from home trend is shifting. 

One stock that should benefit from this shifting trend is Steelcase (SCS). Steelcase designs and manufactures office furniture, with 40% of revenue coming from education, healthcare, and small and medium businesses. 

Right now 55% of employees in the United States work three or more days a week in the office. But, while that number continues to grow, per the comments from the Amazon CEO above, that still leaves a large number at home. 

Steelcase works with employers to design office space to encourage workers to want to spend more time in the office. That means retooling office space into what Steelcase calls a hybrid community, welcoming to onsight workers, but built to facilitate efficient teamwork with offsite colleagues as well. 

They do this by combining over a hundred years of design experience, SCS was founded in 1912, with some well known names in the design and fashion world. Who doesn’t want to go to work to sit in their Frank Lloyd Wright inspired chair, or hold a meeting perched on their West Elm couch? Steelcase partners with these entities, as well as several others.

As you know my favorite POWR Rating factor to look at is value. Steelcase has a B Value rating, and ranks ahead of 94.9% of value stocks we look at in the U.S. 

SCS pays a 4.3% dividend, trades at just 10.3x projected earnings, and at only 0.3x sales. While the company took a hit the past few years in earnings growth courtesy of the pandemic, SCS has come roaring back in 2023, clocking EBITDA growth of over 82%. 

With an overall POWR Rating of B, Steelcase should continue to gain ground as the back to work trend accelerates and employers search for incentives to lure back reluctant employees.

What To Do Next?

Above I featured just 1 of my favorite income stocks. My guess is that you’d like to discover even more attractive income stocks. 

All you need to do is check out my POWR Income Insider portfolio. 

This is backed by a proven quant strategy that has produced an average annual return of +24.3%. It even generated surprising gains in 2022 when the bear market came to town. 

If you would like to learn about this consistently successful income stock approach…then just click the link below:

Discover POWR Income Insider now > 


SCS shares were unchanged in after-hours trading Friday. Year-to-date, SCS has gained 22.92%, versus a 17.38% rise in the benchmark S&P 500 index during the same period.


About the Author: Jay Soloff

Jay is the lead Options Portfolio Manager at Investors Alley. He is the editor of Options Floor Trader PRO, an investment advisory bringing you professional options trading strategies. Jay was formerly a professional options market maker on the floor of the CBOE and has been trading options for over two decades.

More…

The post Income Stock of the Week: Steelcase (SCS) appeared first on StockNews.com

https://www.entrepreneur.com/finance/income-stock-of-the-week-steelcase-scs/458801


Why Are Stocks Weak Again?

The fun of the 2023 bull rally is over. Now we are in a more volatile period where what happens next for the S&P 500 (SPY) is not so clear. That is why 43 year investment veteran Steve Reitmeister shares his latest market outlook, trading plan and top picks in this fresh commentary below.

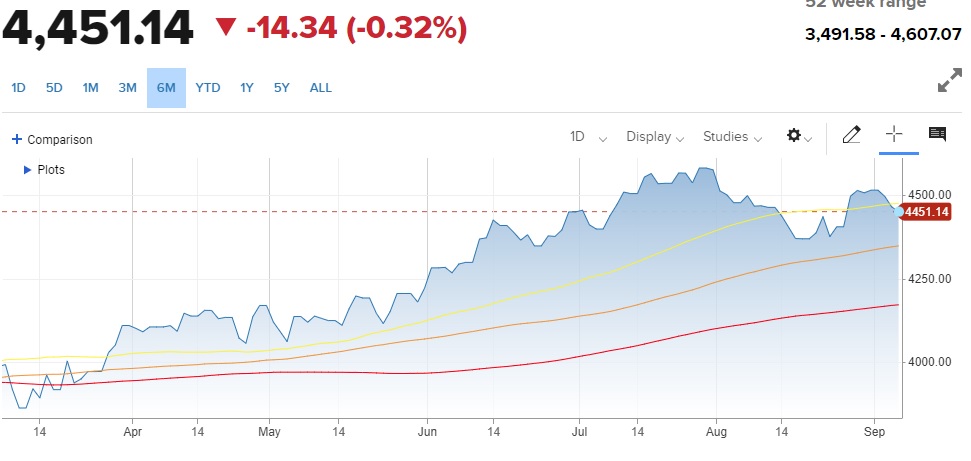
My expectation of a trading range forming is playing out right on schedule. That being where resistance was found at 4,600 for the S&P 500 (SPY) which was simply too high after an overextended bull run.

On the other hand, there was no need for stocks to sell off more than 5%. Thus, support was found just above the 100 day moving average currently at 4,344.

Moving Averages: 50 Day (yellow), 100 Day (orange), 200 Day (red)

In a trading range scenario, the market is overly susceptible to each new headline. One day that blows bearish…and the very next day gloriously bullish.

In short, almost every move inside a trading range is meaningless noise. And thus should mostly be ignored.

That is because the VAST MAJORITY of the time, the market breaks out of the range in the same direction it was going before the range formed. In the current case that means we should break higher out of this range unless there is truly a threat to the bullish thesis.

That would require that the preponderance of the evidence starts to show that the odds of a recession have greatly increased. That is currently not true.

What is true is that we find that the recent economic data is a bit better than expected. Normally that is awesome news that has stocks spiking higher.

Unfortunately, that is not so awesome when the Fed is worried about lingering high inflation not fading away quickly enough. Simply stated…

The more robust the economy looks > the stickier high inflation becomes > the more likely the Fed raises rates even higher > the more they risk creating a recession instead of soft landing

Indeed, the recently improved economic picture has also increased the odds of a Fed rate hike at the November or December meetings. Just a month ago only 28% odds were placed another 25 basis point from the Fed. As for today that is now up to 46%. This again explains the stock market weakness this week.

Let me be clear…The improved data for ISM Services and Jobless Claims this week, that sparked the most recent sell off, does increase the odds of more rate hikes. But as Goldman Sachs predicts, the odds of a new recession forming in the next 12 months is still only around 25%. That means we are much more likely to have a soft landing which keeps the long term bullish thesis in place.

At this stage investors are likely going to react strongly to other upcoming economic events coming into the 9/20 Fed Rate decision. The roll call of reports includes:

9/13 Consumer Price Index

9/14 Producer Price Index, Retail Sales & Jobless Claims

9/20 Fed Rate

Note that right now most investors are expecting the Fed to hit the pause button on rates at this September 20th meeting. The key for investors is focusing on what Powell says at his press conference. That will provide their intentions for future meetings. Again, the odds for a rate increase in November or December is getting ever closer to 50%.

Trading Plan and Next Steps

Nobody knows when this trading range will end. But likely it will be before the holidays when the seasonal good tidings help to create a Santa Claus rally.

Thus, it is important look past the day to day fluctuations to appreciate that the long term picture is still bullish. This makes it wise to use meaningful dips in the range to buy the best looking stocks.

Which stocks are those?

More on that in the next section…

What To Do Next?

Discover my current portfolio of 7 stocks packed to the brim with the outperforming benefits found in our POWR Ratings model.

Plus, I have added 4 ETFs that are all in sectors well positioned to outpace the market in the weeks and months ahead.

This is all based on my 43 years of investing experience seeing bull markets…bear markets…and everything between.

If you are curious to learn more, and want to see these 11 hand selected trades, then please click the link below to get started now.

Steve Reitmeister’s Trading Plan & Top Picks >

Wishing you a world of investment success!


Steve Reitmeister…but everyone calls me Reity (pronounced “Righty”)
CEO, StockNews.com and Editor, Reitmeister Total Return


SPY shares were trading at $444.98 per share on Friday afternoon, up $0.13 (+0.03%). Year-to-date, SPY has gained 17.23%, versus a % rise in the benchmark S&P 500 index during the same period.


About the Author: Steve Reitmeister

Steve is better known to the StockNews audience as “Reity”. Not only is he the CEO of the firm, but he also shares his 40 years of investment experience in the Reitmeister Total Return portfolio. Learn more about Reity’s background, along with links to his most recent articles and stock picks.

More…

The post Why Are Stocks Weak Again? appeared first on StockNews.com

https://www.entrepreneur.com/finance/why-are-stocks-weak-again/458800


How to Play this Stock Market Dip?

Investing was a lot more fun during the non-stop rally between March and July. August has brought a long over due correction to the S&P 500 (SPY). The key for investors is figuring out when to buy this dip, and what are the best picks. Steve Reitmeister shares his thoughts including a preview of the 7 stocks and 4 ETFs he is recommending to investors now.

In my last market commentary, I talked about how stocks were falling short of regaining important ground above 4,400 for the S&P 500 (SPY).

Amazingly Wednesday we broke above with gusto…and then gave it all back and then some on Thursday closing at 4,376.

We will explore why this happened and where we head from here in the commentary below…

Market Commentary

The popular narrative for breaking back above 4,400 on Wednesday is that bond rates finally fell in a meaningful fashion from their recent peak. This improves the value equation for stocks with some hopes that this recent pullback was over.

Flash forward to Thursday. No news to speak of while bond rates were little changed. Stocks even started the session in the plus column. And yet tick by tick the gains frittered away leading to a dreadful -1.35% showing.

Not even beloved NVIDIA providing another breathtaking earnings beat could save the day. This begs the question…what the heck just happened?

The answer is: WELCOME TO THE NEW TRADING RANGE

Meaning 4,600 was too high for stocks. And the recent retreat nearer to 4,300 was too low. So now we are going to bounce around in a trading range for a while. This is not a surprise to anyone reading my recent commentaries citing that 4,600 was a bit too lofty given current fundamental conditions.

Trading ranges = erratic price action

That is because a new equilibrium has been established as investors await more clues that would have them become more or less bullish. But the vast majority of the time, the next move after a trading range is to get back to what you were doing before. In this case that means another leg higher.

The most important thing to appreciate about trading ranges is that pretty much all price moves inside the range are meaningless noise. As in, there may not be a logical reason. Case in point being the 1.35% haircut on Thursday.

Let’s get back to the conversation about government bond rates on the rise

There is a false narrative taking place on this vital topic. Some investment journalists are writing that it’s because investors see more long term inflation on the horizon. Yet most signs say that is not true.

Here is what I believe is taking place.

First, let’s step back to remember that since the Great Recession in 2008/2009 the Fed has used every tool necessary to lower rates. That includes Quantitative Easing that led to building a greater than $5 trillion portfolio of Treasury bonds.

That’s because less bonds on the free market = greater demand for the bonds left in circulation = lower rates on those bonds.

Now the Fed wants higher rates. And beyond the aggressive rate hike cycle for the Fed Funds Rate, they have been steadily selling off their bond portfolio (Quantitative Tightening). That leads to this equation:

More bonds on the free market = less demand for the bonds in circulation = rates need to rise to attract additional buyers.

Let’s also remember that the historical average for the 10 year Treasury rate is a little over 4% when the average inflation rate during those periods were a touch over 2%.

So perhaps all that is happening now with higher rates is that they are less manipulated by the Fed…and that they are returning to a true market rate.

That is also why I don’t think rates will go too much higher because looking out to the future inflation will get back to normal…and Fed funds rate will be lower…and thus bond rates will not need to be much higher than now.

Lastly, once the Fed wins their battle over inflation, they will lower the Fed funds rate which will allow the economy to grow faster. This equates to higher corporate earnings growth which is a much more natural catalyst for share price appreciation.

Putting it altogether, we are still in the midst of a new bull market…but one that got out of the gate a little too hot for the tue state of the economic conditions. This leads to the trading range scenario we are in now.

We will break higher once investors are more convinced that the Fed has tamed inflation without causing a recession (aka Soft Landing). This tells everyone that rates will go lower in the future which is a green light for stock advancement.

Bottom Line: Buy the recent dip…and don’t sweat too much of the day to day volatility inside the trading range.

What To Do Next?

Discover my current portfolio of 7 stocks packed to the brim with the outperforming benefits found in our POWR Ratings model.

Plus I have added 4 ETFs that are all in sectors well positioned to outpace the market in the weeks and months ahead.

This is all based on my 43 years of investing experience seeing bull markets…bear markets…and everything between.

If you are curious to learn more, and want to see these 11 hand selected trades, then please click the link below to get started now.

Steve Reitmeister’s Trading Plan & Top Picks >

Wishing you a world of investment success!


Steve Reitmeister…but everyone calls me Reity (pronounced “Righty”)
CEO, StockNews.com and Editor, Reitmeister Total Return


SPY shares were trading at $441.03 per share on Friday afternoon, up $4.14 (+0.95%). Year-to-date, SPY has gained 16.19%, versus a % rise in the benchmark S&P 500 index during the same period.


About the Author: Steve Reitmeister

Steve is better known to the StockNews audience as “Reity”. Not only is he the CEO of the firm, but he also shares his 40 years of investment experience in the Reitmeister Total Return portfolio. Learn more about Reity’s background, along with links to his most recent articles and stock picks.

More…

The post How to Play this Stock Market Dip? appeared first on StockNews.com

https://www.entrepreneur.com/finance/how-to-play-this-stock-market-dip/458100


How is Anheuser-Busch InBev (BUD) Faring on Wall Street This Week?

Beer-making giant Anheuser-Busch InBev’s (BUD) Bud Light lost its place as America’s best-selling beer, slipping into second place in June. BUD also saw a sharp drop in U.S. revenue in the last reported quarter. So, let’s discuss some of its key metrics to determine whether the stock is worth buying now.

Anheuser-Busch InBev SA/NV (BUD) experienced a pronounced dip in U.S. revenue during the second quarter, primarily due to a social media-fueled boycott of its top-selling Bud Light beer. Moreover, in June, Bud Light relinquished its title of America’s top-selling beer, a position held for more than two decades, succumbing to Mexican lager Modelo Especial.

This sudden turn of events creates an uncertain near-term outlook for BUD, and I think this might not be the optimal entry point in the brewery’s stock.

The brewer’s second-quarter revenue in the U.S. saw a significant 10.5% drop. Concurrently, operating profits took a near 30% hit. Despite these setbacks, BUD managed a surge in global profits owing to price hikes and enhanced sales in markets outside the U.S.

However, the steep 28.1% year-over-year slump in Bud Light volumes in the week ending August 13 raises concerns. “Continued weakness begs the question of whether Anheuser-Busch InBev and/or its distributors will have to make significant structural changes to reduce their cost basis if trends don’t improve over the next few months,” Evercore ISI analyst Robert Ottenstein said.

The stock is currently trading below its 50-day and 200-day moving averages of $56.93 and $59.31, respectively.

Taking this into consideration, it is paramount that we delve deeper into BUD’s key financial trends to comprehend the broader picture.

Anheuser-Busch Inbev: Analyzing Financial Health and Earnings Performance (2020-2023)

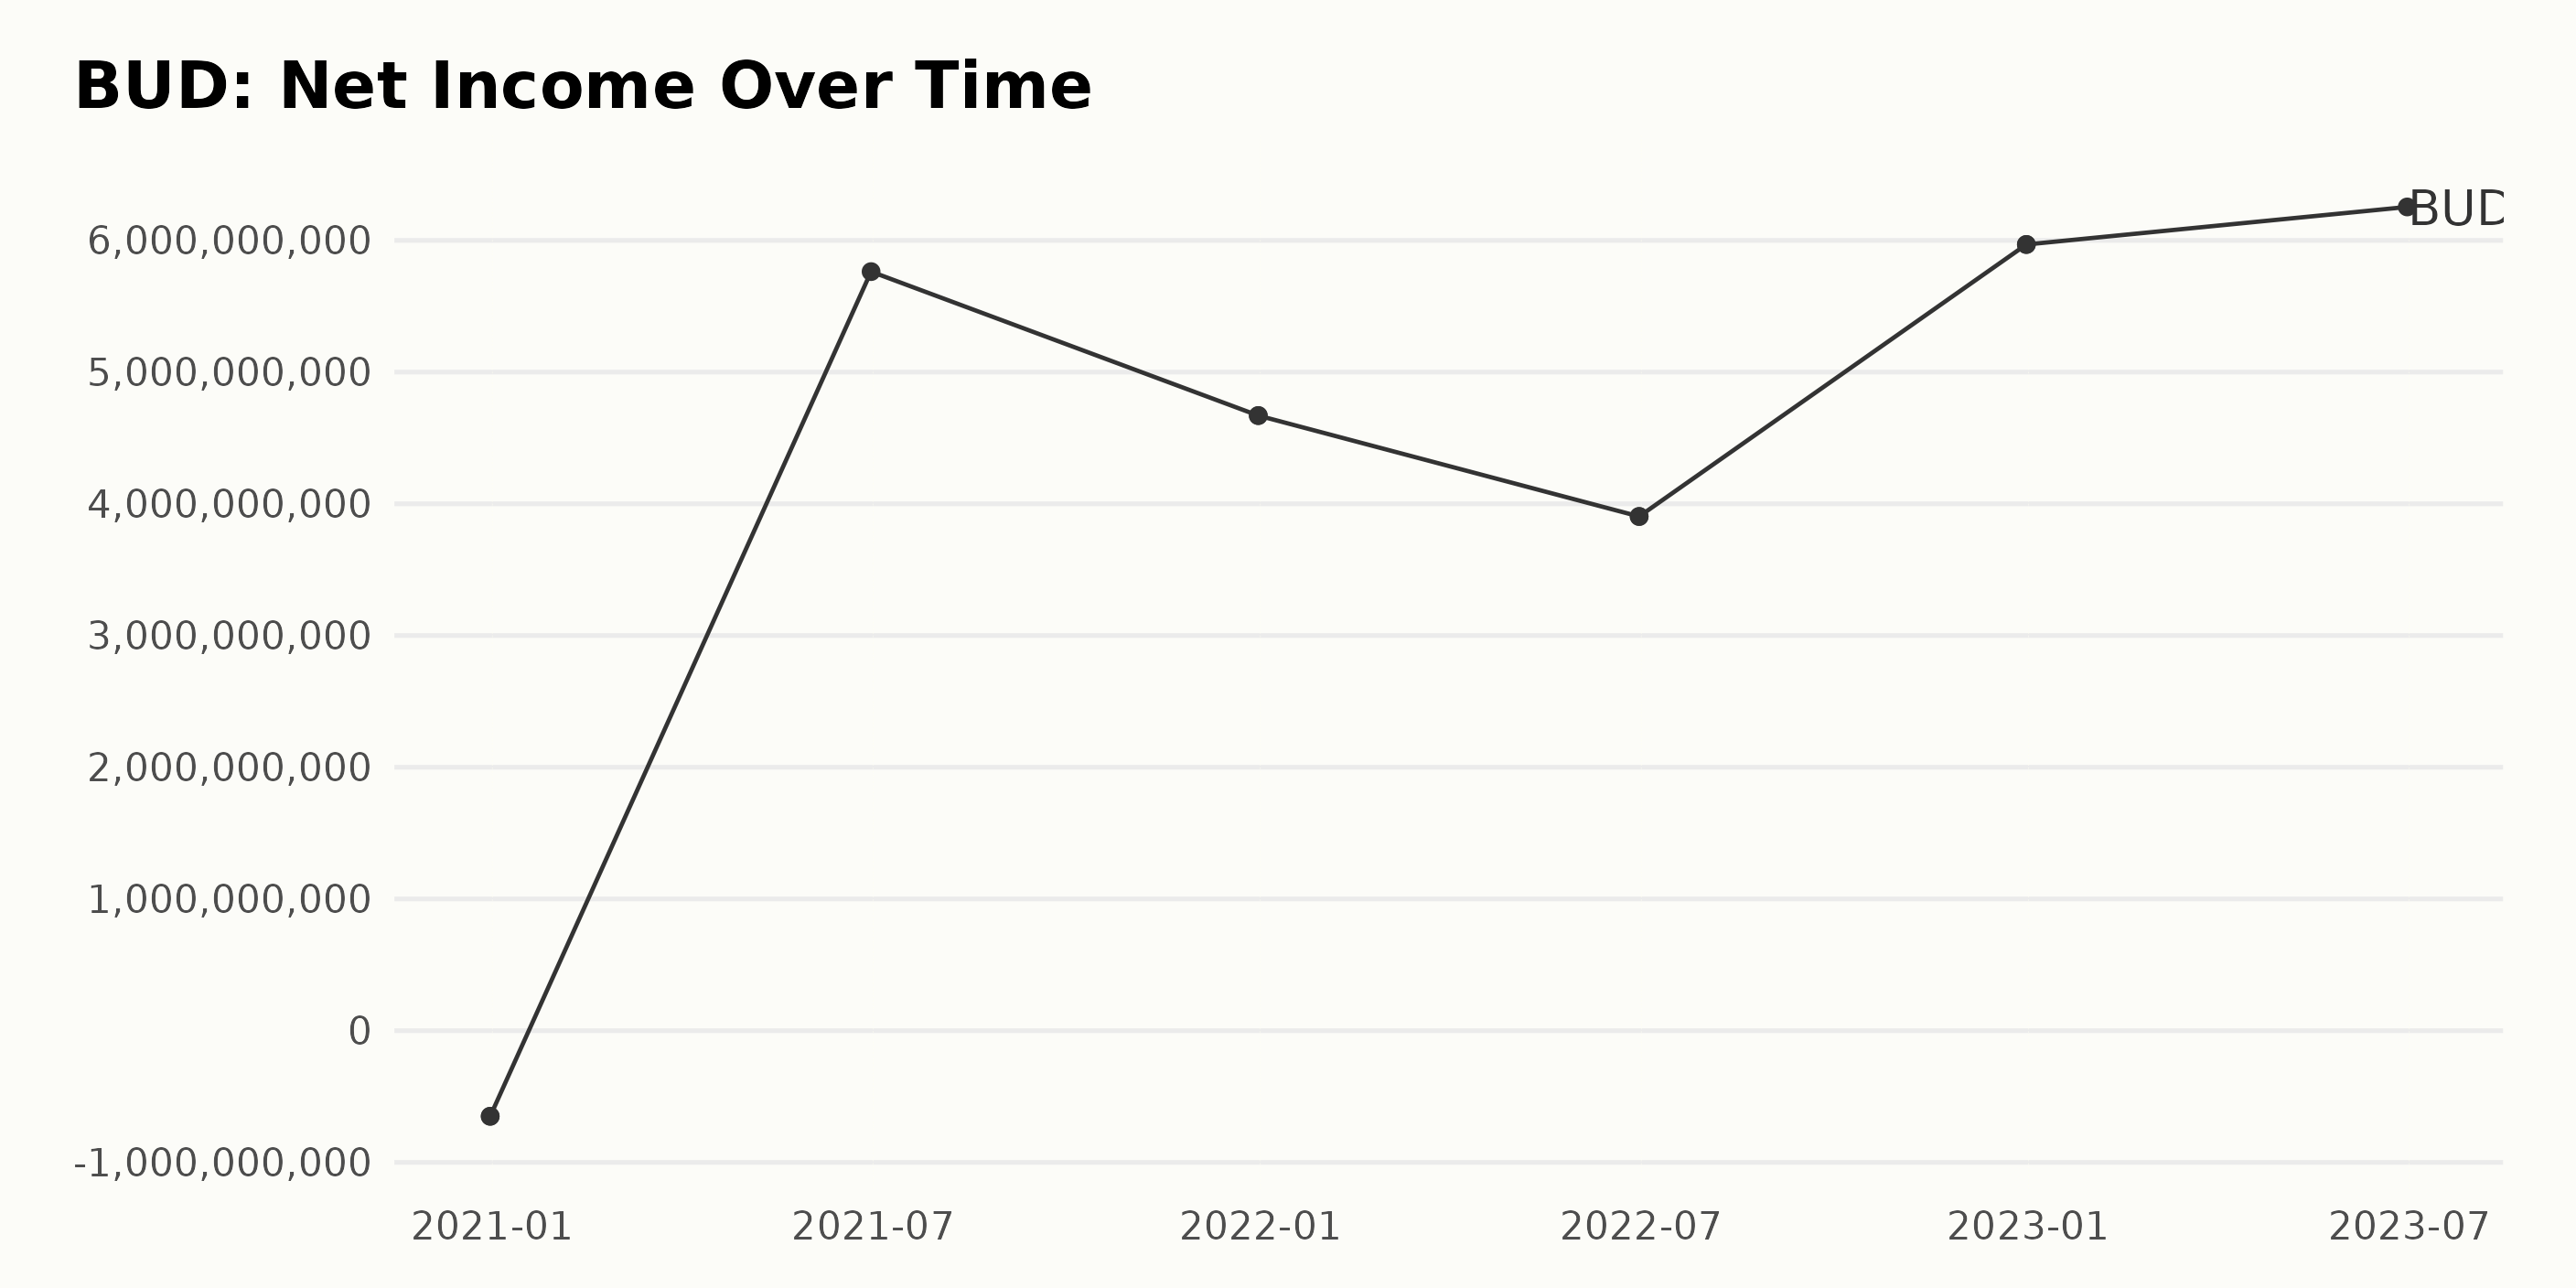
The data represents the fluctuations and trends in the trailing-12-month net income of BUD. Over the observed period, there is a significant change in the company’s net income.

  • At the start of the period on December 31, 2020, the reported net income was a loss of $650 million.
  • By June 30, 2021, there was an impressive recovery as the net income increases dramatically to $5.76 billion.
  • By the end of 2021, on December 31, the net income slightly declined to $4.67 billion.
  • The net income continued to fluctuate, dropping to $3.90 billion by June 30, 2022.
  • However, it proceeded to recover later that year, reaching $5.97 billion by December 31, 2022.
  • The most recent figure from June 30, 2023, shows a continual rise to $6.25 billion, making it the highest figure in the observed period.

Due to this variation, the growth rate from the initial net income loss of $650 million at the end of 2020 to the most recent net income gain of $6.25 billion in mid-2023 represents a substantial increase. This indicates a significant improvement in the company’s financial performance, especially considering the turnaround from an initial net loss. However, there were fluctuations during the period.

The trailing-12-month revenue of BUD shows a steady upward trend over the observed period (2020-2023).

  • At the end of 2020, BUD’s revenue stood at $46.88 billion.
  • By mid-2021, the revenue had grown to $51.42 billion, marking an increase.
  • The company closed 2021 with a reported revenue of $54.30 billion.
  • Mid-2022 saw another significant increase in revenue, which reached $56.50 billion.
  • The last recorded revenue value for 2022 was $57.79 billion.
  • BUD’s revenue by mid-2023 was $59.09 billion.

Comparing the first recorded data point in December 2020 ($46.88 billion) with the last one in June 2023 ($59.09 billion), it can be calculated that the revenue has experienced a growth rate of approximately 26% over this period. This persistent upward trend and high growth rate suggest a positive financial trajectory for BUD.

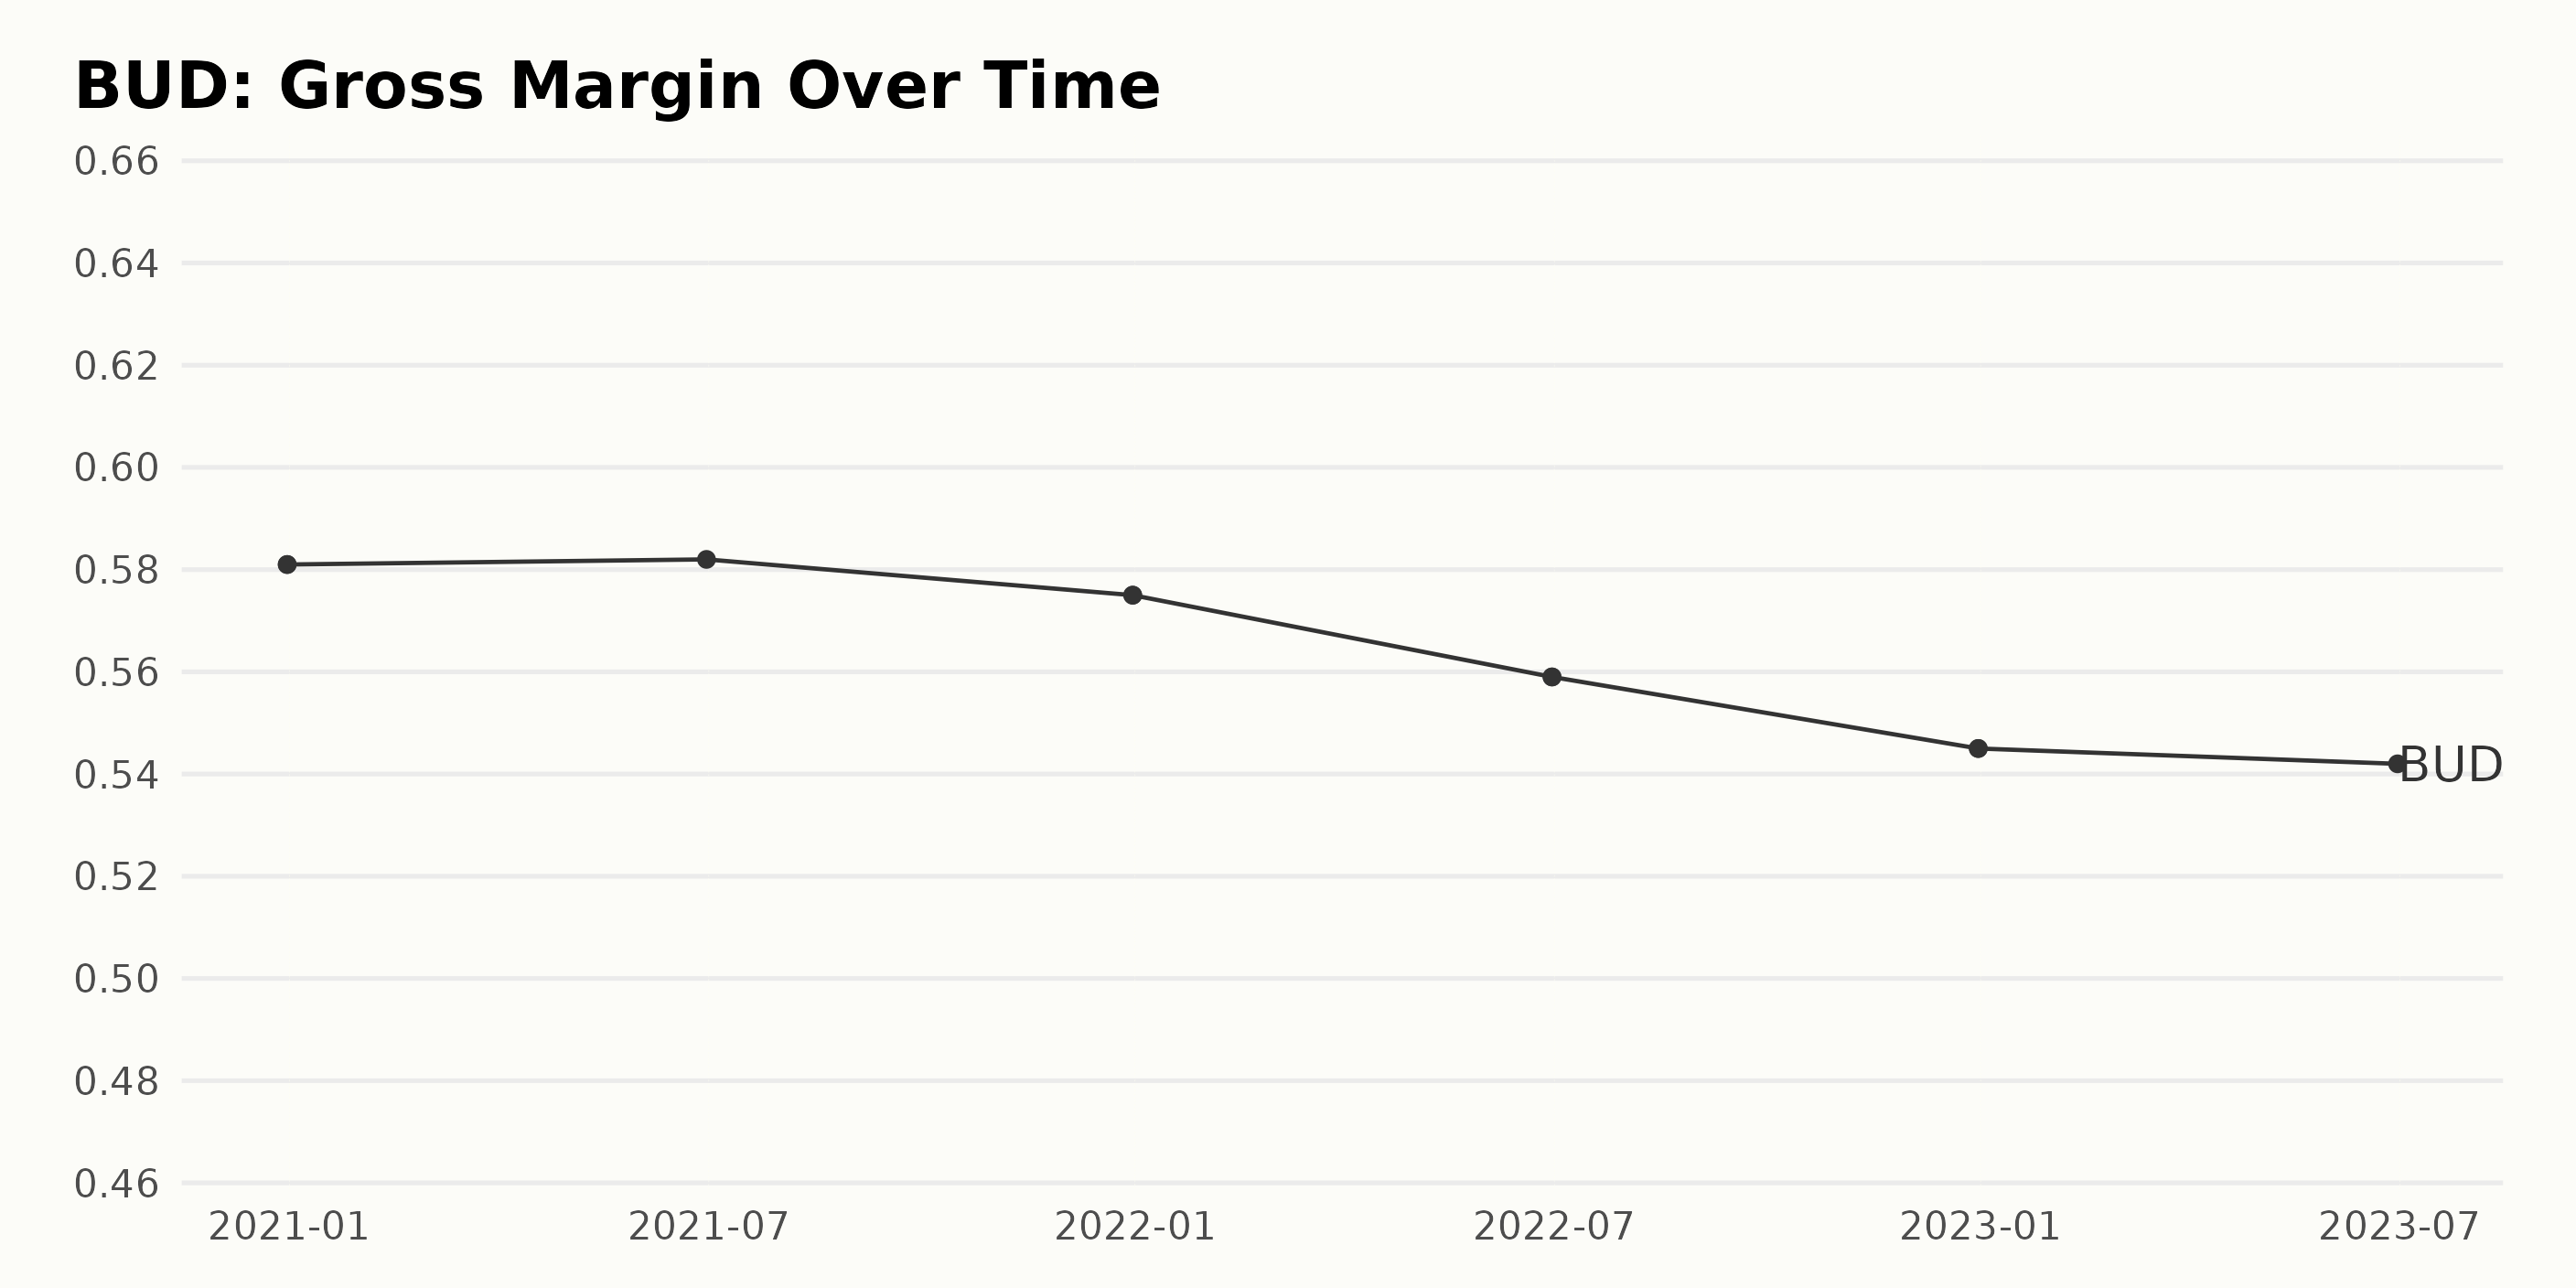
Over the observed period, BUD’s gross margin showed a downward trend with some fluctuations.

  • In December 2020, BUD’s reported gross margin was at 58.1%.
  • The gross margin slightly rose by June 2021, recording a value of 58.2%. However, it eventually decreased to 57.5% in December 2021.
  • In 2022, we see a further reduction in gross margin, with 55.9% recorded in June and a further drop to 54.5% by December.
  • The trend continues into 2023, with the gross margin decreasing slightly to 54.2% by June.

It is evident that from December 2020 to June 2023, there is an overall decline in the gross margin. Calculating from the first to the last value, we observe an absolute decrease of about 3.9%, indicating a downward trend over this period. This emphasizes the need to closely watch the company’s gross margin performance in the future since it seems to be on a declining trajectory.

The Analyst Price Target for BUD has exhibited important fluctuations over the period. Here’s an overall summary based on the data provided:

  • Beginning on November 12, 2021, the Analyst Price Target scored at $64.5 and largely stayed static through December 2021, with a minor rise to $64.56 during the first week of December 2021.
  • There was a steady increase starting in January 2022, peaking at $65.75 by the third week of the month, which held consistent through mid-May of the same year.
  • Following this plateau, a significant downtrend was experienced in late May, declining from $65.75 to $63.25 by mid-May and eventually bottoming to $60 by the end of July.
  • This downward trend intensified from August 2022 through October 2022, when the Price Target plunged to $54.4 on October 7, 2022.
  • From November 2022 onwards, there was a gradual recovery, reaching back to $65 by the end of January 2023.
  • The Price Target then increased markedly to $70 by the third week of June 2023 before a slight decrease to $69.215 by the end of June. Emphasizing the most recent trends, in July 2023, the price target encountered another drop to $68.5, hovering around this value through August 24, 2023.

BUD Shares Experience Fluctuating Trends from March-August 2023

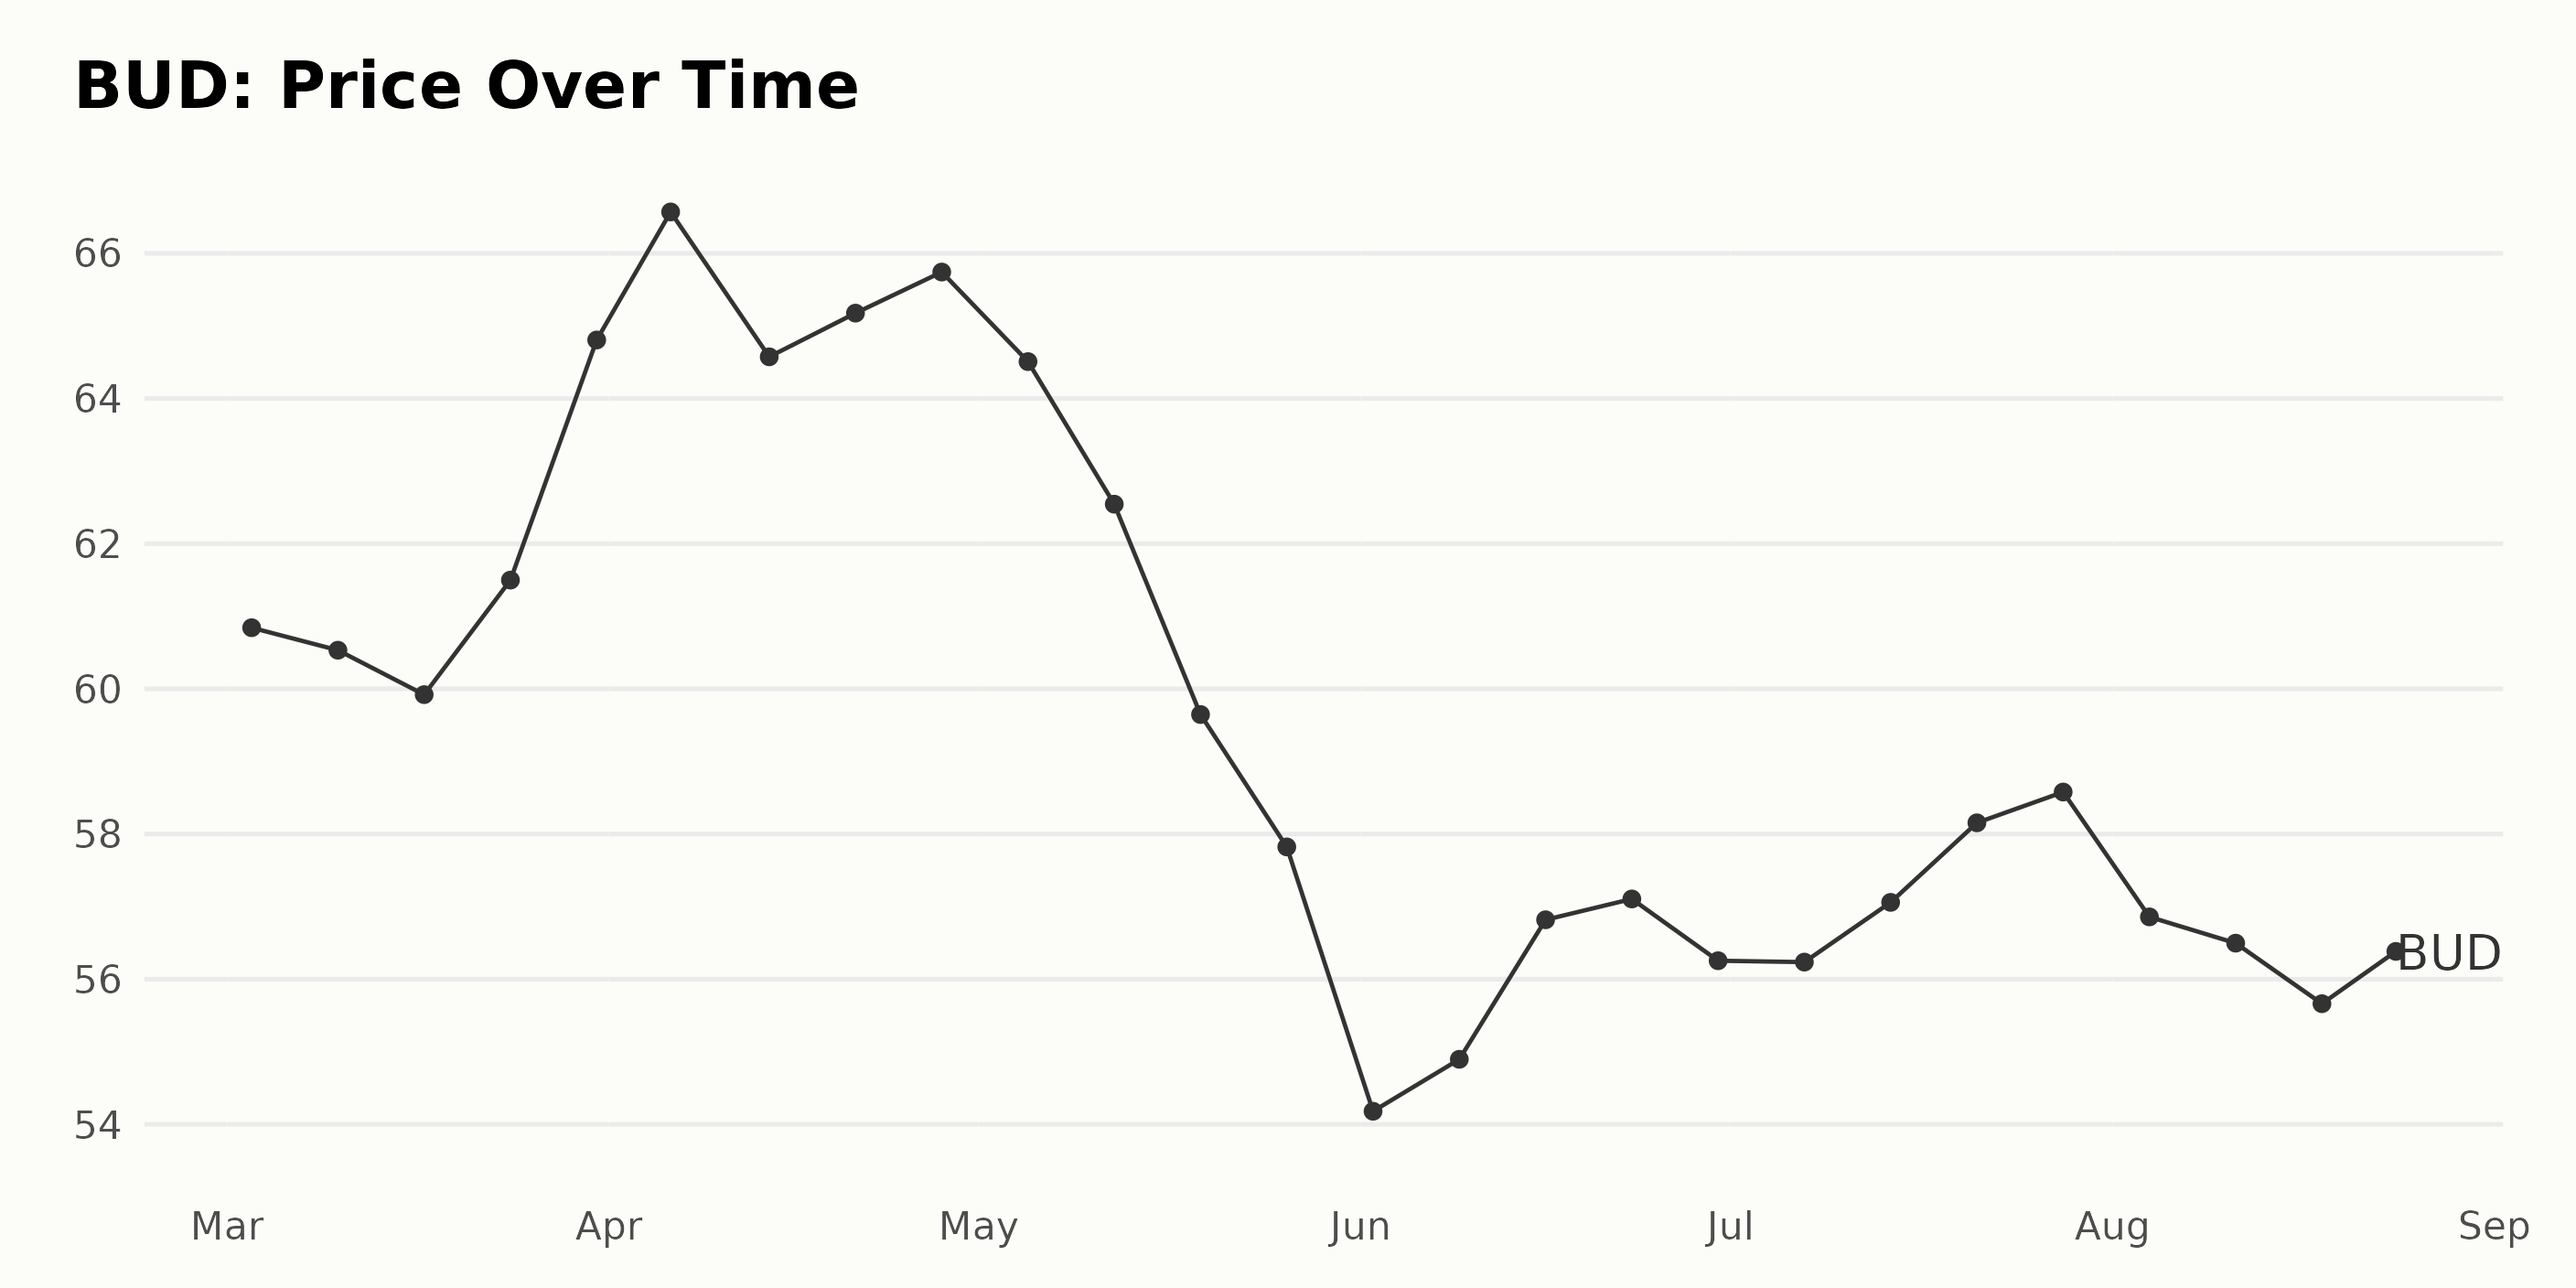
BUD’s share price seems to have experienced fluctuations, with both upward and downward movements from March 2023 till August 2023. By taking a closer look:

  • As of March 3, 2023, the price was at $60.84.
  • The lowest value in the same month, on March 17, was $59.92, but it rallied to end the month at $64.81.
  • In April, the price began at a higher point, peaking at $66.57 on April 6, 2023, before falling slightly to $65.74 by the end of April.
  • May witnessed a decrease in the share value. Starting at $64.51, it steadily declined throughout the month, reaching its lowest point on May 26, 2023, at $57.82.
  • Despite some rise and fall, the price continued to decline in June, reaching another low point of $54.18 on June 2, 2023, before slightly rallying to end the month at $56.25.
  • The majority of July saw a slight increase in the share value, reaching $58.58 towards the end of the month.
  • By August 24, 2023, it had dipped again to stand at $56.44.

In summary, the trend over these months is rather mixed with peaks and troughs. The overall growth rate for the March-August 2023 period seems to be negative, indicating a general decline in the share price of BUD. Here is a chart of BUD’s price over the past 180 days.

Anheuser-Busch InBev: Examination of Sentiment, Stability, and Quality Metrics Through 2023

BUD has an overall C rating, translating to a Neutral in our POWR Ratings system. It is ranked #16 out of the 37 stocks in the Beverages category. Detailed historical performance includes:

  • On March 4, 2023, BUD had a POWR grade of A, ranking 7 in its category.
  • Over the following weeks until May 6, 2023, with slight fluctuations in category rank, BUD maintained an A grade before dropping to B in the week of May 13, 2023.
  • BUD continued to hold a B grade from mid-May to early August 2023, experiencing a gradual increase in its category rank that reached 18 on July 8, 2023.
  • Continuing with a B grade, BUD fluctuated within the ranks of 15 to 16 over subsequent weeks.
  • The POWR grade of BUD was downgraded to C on August 9, 2023, and it held this grade through the most recent data point on August 24, 2023. During this period, BUD’s rank oscillated between 15 and 16 in its category.

It is important to note that lower numbers in rank in category indicate a superior rank.

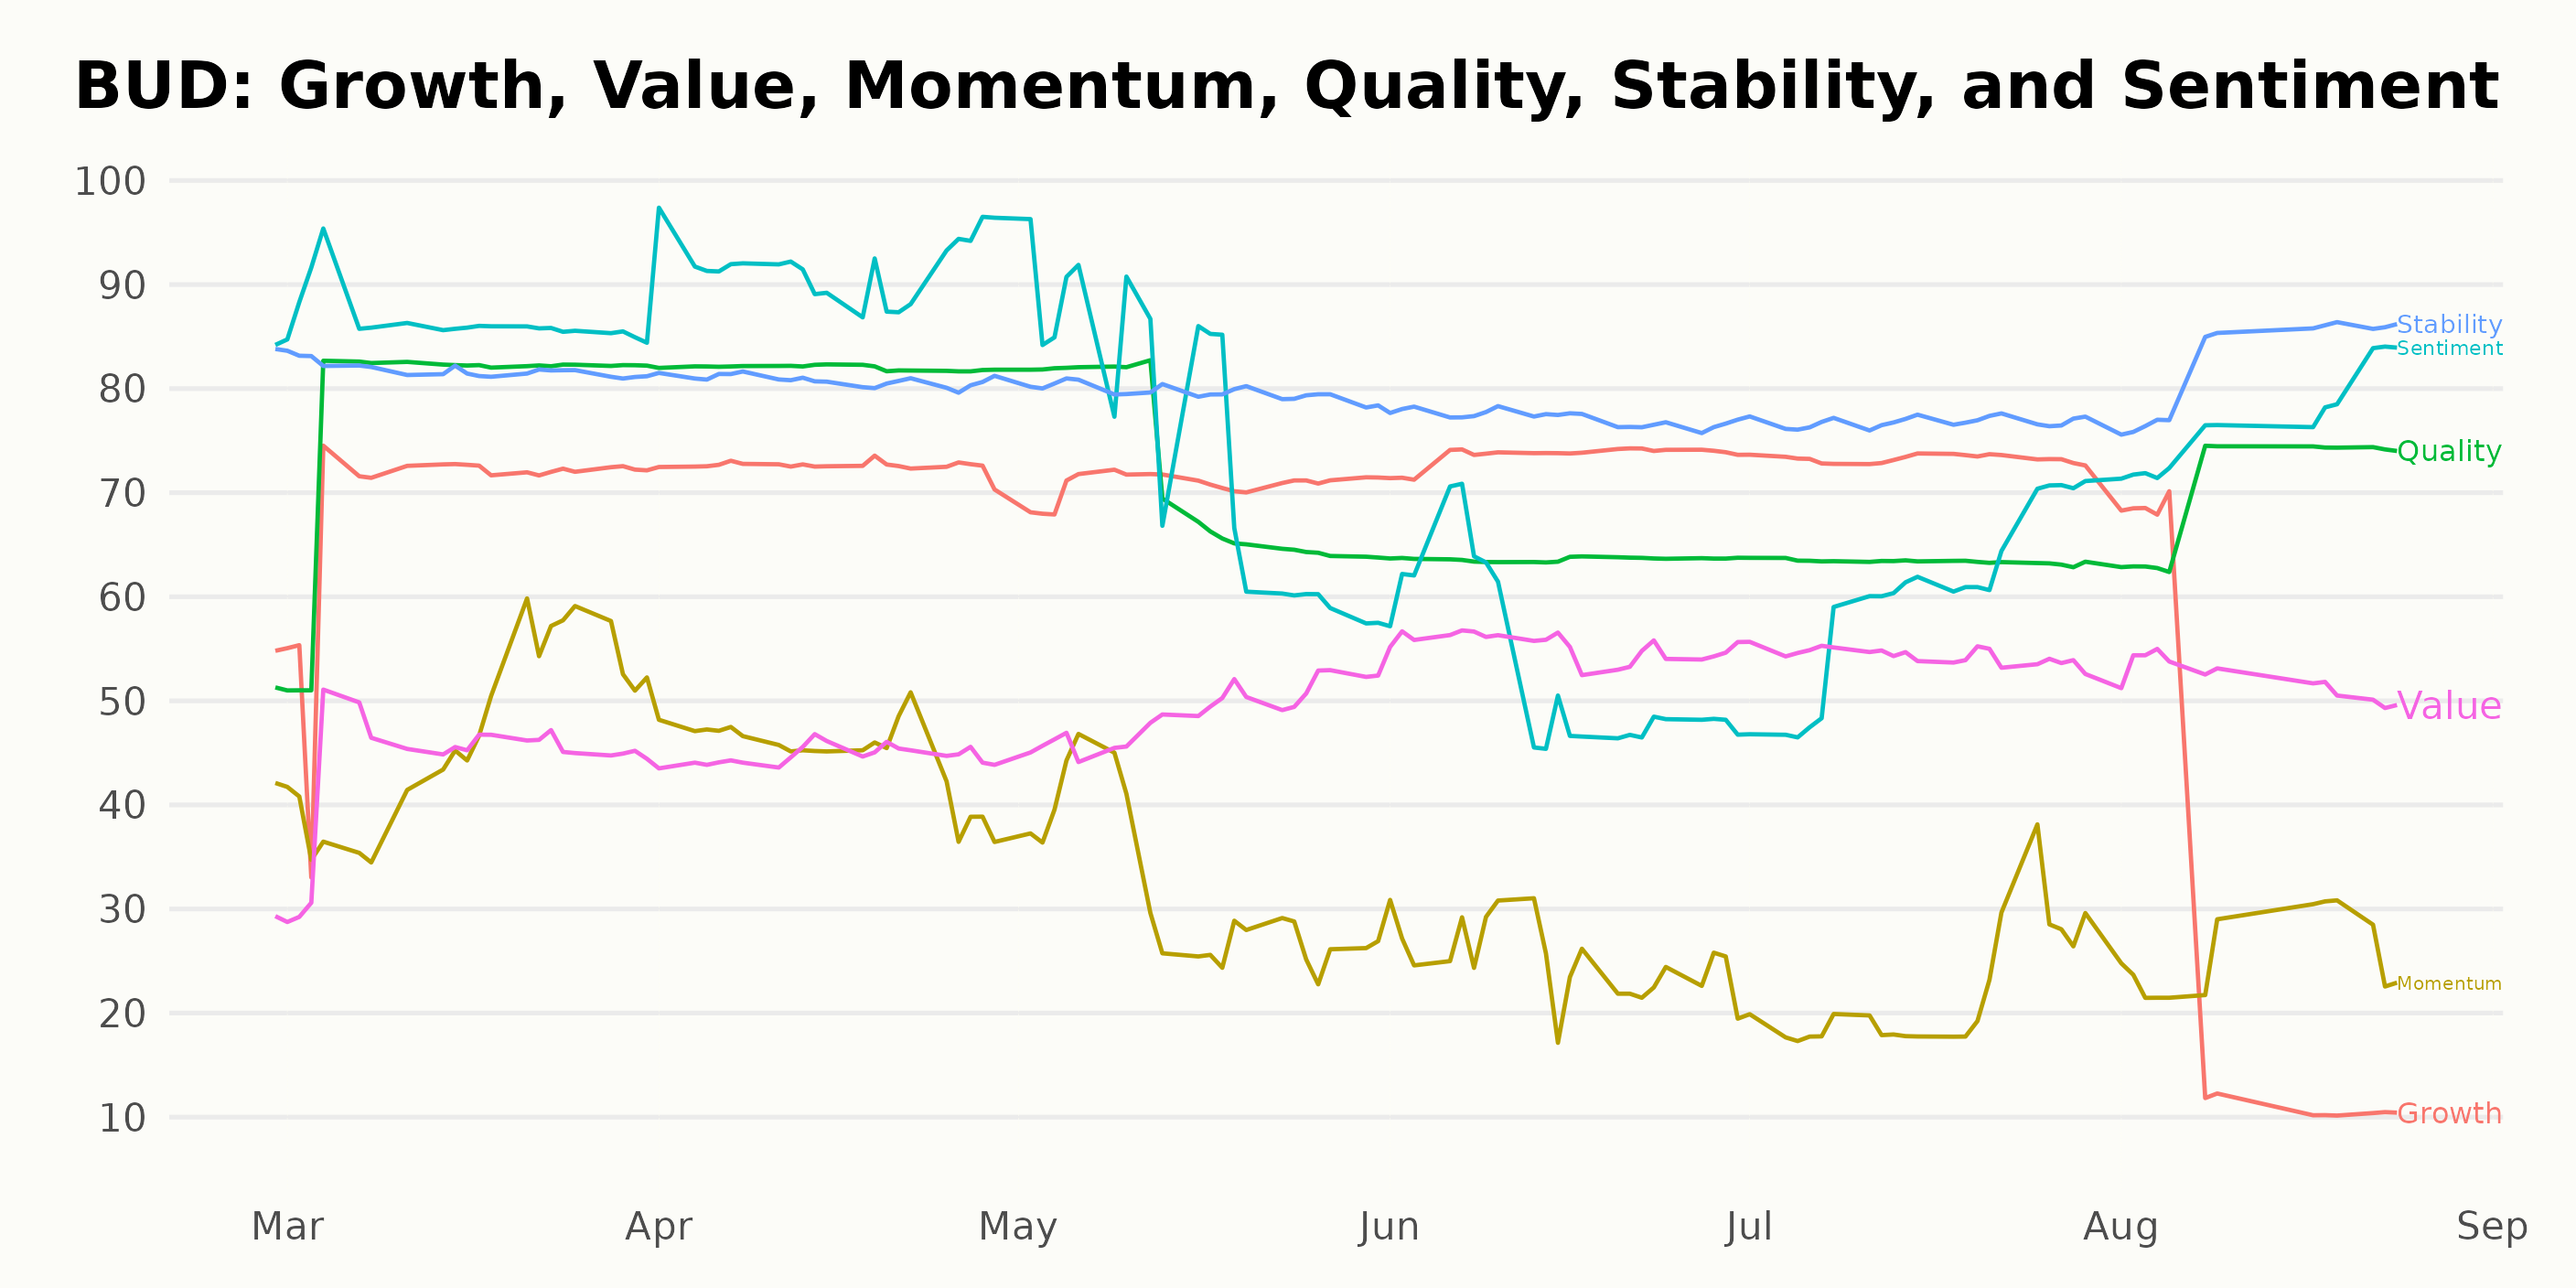
For BUD, the three most noteworthy POWR Ratings dimensions focus on Sentiment, Stability, and Quality. Let’s dive into these over several months. February 2023:

  • The Sentiment score was at the top, with a rating of 84.
  • Stability also held a high rating, matching Sentiment at 84.
  • Quality represented the third-highest dimension during this period, reaching a score of 51.

As we moved into March 2023:

  • Sentiment marginally increased to 86, maintaining its high position.
  • Even though the Stability score slightly decreased to 82, it stayed within the top three ratings.
  • Quality took a notable leap, jumping to the second spot with a score of 78.

April 2023 saw some interesting developments in the top three dimensions:

  • Sentiment bolstered its score to an impressive 92, showing an increasing trend.
  • Quality further grew to reach a rating of 82, demonstrating a consistent growth pattern across the months.
  • Despite a slight decrease to 81, Stability sustained its position as one of the top-performing dimensions.

The trends made a transposition in May and June 2023. During May, the Sentiment, Quality, and Stability scores were reduced to 75, 72, and 80, respectively. In June, all dimensions showed a decline, with Sentiment plunging to 53, Quality dropping to 64, and Stability marking a slight downshift to 77.

In July 2023, there was a marginal uptick in the Sentiment score, moving up to 60. However, Quality continued to decline, falling to 63, whereas Stability maintained its score of 77.

Finally, by August 2023, Sentiment had climbed back to a higher score of 77. Quality registered a mild growth to 70 while Stability, maintaining high ratings throughout, crept upward to 82.

The Sentiment dimension consecutively held the highest ratings for several months before experiencing a notable dip between May and July 2023. Afterwards, it made a robust comeback to regain a high score in August 2023. Stability showed a marginal but consistent decline until August when it bounced back slightly. Quality exhibited an intriguing pattern of sharp growth until April, followed by a steady drop from May to July and a slight recovery by August.

How does Anheuser-Busch InBev SA/NV (BUD) Stack Up Against its Peers?

Other stocks in the Beverages sector that may be worth considering are Primo Water Corporation (PRMW), Coca-Cola Consolidated, Inc. (COKE), and Suntory Beverage & Food Ltd (STBFY) — they have better POWR Ratings.

What To Do Next?

Get your hands on this special report with 3 low priced companies with tremendous upside potential even in today’s volatile markets:

3 Stocks to DOUBLE This Year >


BUD shares rose $0.35 (+0.62%) in premarket trading Friday. Year-to-date, BUD has declined -5.09%, versus a 15.10% rise in the benchmark S&P 500 index during the same period.


About the Author: Subhasree Kar

Subhasree’s keen interest in financial instruments led her to pursue a career as an investment analyst. After earning a Master’s degree in Economics, she gained knowledge of equity research and portfolio management at Finlatics.

More…

The post How is Anheuser-Busch InBev (BUD) Faring on Wall Street This Week? appeared first on StockNews.com

https://www.entrepreneur.com/finance/how-is-anheuser-busch-inbev-bud-faring-on-wall-street/458058


3 Financial Stocks to Watch Closely for Momentum

With sustained demand and rapid digital transformation, the financial services industry is poised for significant growth and expansion. Moreover, industry players usually benefit in a high-interest rate environment. Thus, robust financial stocks First American Financial (FAF), Everi Holdings (EVRI), and Digital World Acquisition (DWAC) could be ideal watchlist additions for their solid momentum attributes. Keep reading….

After showing remarkable resilience over the last two years, the financial services industry is expected to witness continued growth, thanks to solid corporate and consumer spending on financial services and the growing adoption of digital technology. Moreover, financial institutions generally benefit in a rising interest rate environment as it helps them boost their profit margins.

Amid this backdrop, investors could watch financial stocks First American Financial Corporation (FAF), Everi Holdings Inc. (EVRI), and Digital World Acquisition Corp. (DWAC) witnessing solid momentum.

In recent years, the financial services industry has demonstrated its ability to navigate unprecedented levels of macroeconomic uncertainty successfully. From real estate to insurance to investment management to banking and capital markets, financial services organizations are well-poised for continued resilience and growth, driven by sustained demand for financial services.

According to a report by The Business Research Company, the global financial services market is expected to grow to $37.48 trillion by 2027 at a CAGR of 7.5%.

Moreover, financial services companies are expected to benefit from the current high-interest rate environment. Last month, the central bank raised interest rates by 0.25%, lifting the fed funds rate to a target range of 5.25%-5.5%, the highest level in 22 years, in its fight against persistent inflation.

While price increases have eased over the past year, dropping the inflation rate from 9% in mid-2022 to 3.2% in July this year, it is still well above the Fed’s target of 2%. Further, Fed minutes released last Wednesday from the most recent meeting showed that Fed officials expressed concerns about the pace of inflation and said more rate hikes could be required.

Furthermore, digital transformation plays a significant role in reshaping the financial services sector by bringing numerous growth opportunities. Adopting digital technology is pivotal for organizations to remain competitive, meet changing customer expectations, and drive operational efficiency.

For instance, with digital channels, customers can access their accounts, make transactions, and seek help anytime, anywhere, enhancing customer experience. By adopting advanced technologies like artificial intelligence (AI), machine learning (ML), and robotic process automation (RPA), financial institutions can automate manual processes, streamline operations, and lower costs.

In addition, digital integration aids in data-driven decision-making. Financial institutions leverage advanced analytics and data-driven insights to make informed decisions, identify market trends, develop personalized offerings, and manage risks effectively.

Financial services applications have become focused since financial organizations have introduced digital solutions and innovations like person-to-person payment, online transfers, alerts, and other services. As per a report by Mordor Intelligence, the financial services application market is projected to grow at a CAGR of 7.9% by 2027.

Given the high-rate environment and the industry’s long-term prospects, investors could consider watching quality financial services stocks FAF, EVRI, and DWAC with surprising momentum.

Let’s take a closer look at the fundamentals of these stocks:

First American Financial Corporation (FAF)

FAF is a premier provider of title, settlement, and risk solutions for real estate transactions. It operates through Title Insurance and Services and Specialty Insurance segments. The company issues title insurance policies on residential and commercial property and offers related products and services. It also provides home warranty products.

On August 22, FAF’s Board of Directors declared a quarterly cash dividend of $0.53 per common share, a 2% increase over the previous level of $0.52 per common share. The cash dividend is payable on September 15, 2023, to shareholders of record as of September 8, 2023.

Ken Degiorgio, CEO of FAF, said, “Our decision to increase the cash dividend signals our continued confidence in the outlook for our business and our long-standing commitment to return capital to our shareholders.”

FAF pays an annual dividend of $2.12, translating to a yield of 3.53% at the current share price. Its four-year average dividend yield is 3.28%. Its dividend payouts have grown at a CAGR of 6.5% over the past three years. The company has raised its dividends for 12 consecutive years.

In terms of forward EV/EBITDA, FAF’s 10.60x is 12.5% lower than the 12.12x industry average. Likewise, the stock’s forward Price/Sales of 0.98x is 57.5% lower than the 2.30x industry average.

FAF’s Title Insurance and Services segment investment income grew 105% year-over-year to $142 million for the second quarter that ended June 30, 2023. Its income before income taxes was $178.10 million, up 26% from the prior year’s quarter. The company’s net income grew 23.8% from the year-ago value to $136.40 million.

Furthermore, FAF’s net income per share attributable to stockholders rose 31.7% year-over-year to $1.33. As of June 30, 2023, the company’s cash and cash equivalents came in at $2.25 billion, compared to $1.22 billion as of December 31, 2022.

Analysts expect FAF’s revenue and EPS for the fiscal year (ending December 2024) to increase 5.1% and 23% year-over-year to $6.66 billion and $5.41, respectively. Moreover, the company surpassed the EPS estimates in three of the trailing four quarters.

Over the past six months, FAF’s stock has gained 6.4% and 12.4% year-to-date to close the last trading session at $60.11. Moreover, the stock is currently trading above its 50-day and 200-day trading averages of $59.33 and $56.74, respectively, indicating an uptrend.

FAF’s strong fundamentals are reflected in its POWR Ratings. The POWR Ratings assess stocks by 118 different factors, each with its own weighting.

FAF has a grade of B for Momentum and Growth. In the Financial Services (Enterprise) industry, it is ranked #18 out of 100 stocks.

Beyond what we stated above, we also have FAF’s ratings for Sentiment, Stability, Value, and Quality. Get all FAF ratings here.

Everi Holdings Inc. (EVRI)

EVRI provides entertainment and technology solutions to the casino, interactive, and gaming industries. It develops and supplies entertaining game content, gaming machines, and gaming systems for land-based and iGaming operators internationally. The company operates through two segments: Games and Financial Technology Solutions.

On June 30, EVRI’s Venuetize platform was selected by Inter Miami CF as the foundation for their fan engagement mobile strategy, enabling users to stay up-to-date with the latest news, scores, fixtures, ability to shop for exclusive merchandise, and more. This deal is expected to drive the company’s growth.

On May 31, EVRI launched the Muscogee Creek Mobile App at all nine Muscogee (Creek) Nation Casinos in Oklahoma. The Everi Mobile App is designed for optimized player engagement, giving casino guests the power of self-service and featuring the operator’s branding. The new launch should boost EVRI’s expansion.

Also, on April 11, EVRI entered into a purchase agreement to acquire certain assets of VKGS LLC (Video King), a privately owned leading provider of integrated electronic bingo gaming tablets, video gaming content, instant win games, and systems for cash consideration of nearly $59 million.

This acquisition would provide EVRI with complementary assets and an established customer base, enabling additional growth in the company’s Games segment.

EVRI’s trailing-12-month gross profit margin of 78.77% is 123% higher than the industry average of 35.32%. Similarly, the stock’s trailing-12-month EBITDA margin of 43.36% is favorably higher than the industry average of 10.87%.

EVRI’s forward non-GAAP P/E of 11.85x is 19.5% lower than the 14.72x industry average. And the stock’s forward EV/EBITDA of 5.19x is 45.7% lower than the 9.55x industry average. Also, its forward Price/Cash Flow multiple of 4.61 is 44.3% lower than the industry average of 8.28.

For the second quarter ended June 30, 2023, EVRI’s revenues increased 5.8% year-over-year to $208.70 million, while its FinTech revenues came in at $95.60 million, up 12.6% from the prior year’s quarter. Its adjusted EBITDA rose 1.8% from the year-ago value to $96.10 million. As of June 30, 2023, the company’s cash and cash equivalents stood at $210.62 million.

Street expects EVRI’s revenue for the fiscal year (ending December 2023) to increase 6.2% year-over-year to $830.88 million. For the fiscal year 2024, the consensus revenue and EPS estimates of $873.87 million and $1.21 indicate an improvement of 5.2% and 11.4% year-over-year, respectively.

In addition, the company topped the consensus revenue and EPS estimates in three of the trailing four quarters, which is impressive.

Shares of EVRI have declined 4.6% year-to-date to close the last trading session at $13.69.

EVRI’s POWR Ratings reflect this robust outlook. EVRI has an overall rating of B, which translates to a Buy in our proprietary rating system.

EVRI has a B grade for Momentum, Quality, and Value. It is ranked #5 out of 100 stocks in the Financial Services (Enterprise) industry.

Click here to see the other ratings of EVRI for Growth, Sentiment, and Stability.

Digital World Acquisition Corp. (DWAC)

DWAC is a special purpose acquisition company (SPAC) that focuses on effecting a merger, capital stock exchange, asset acquisition, stock purchase, reorganization, or related business combination with one or more businesses. The company intends to identify tech-focused companies in the SaaS and technology, or fintech and financial services sector.

On August 9, DWAC and Trump Media & Technology Group Corp. (TMTG), which operates the Truth Social platform, agreed to an amendment to their previously announced Agreement and Plan of Merger (the Merger Agreement).

The Merger Agreement is expected to enable TMTG and DWAC to progress toward their shared objective of completing a business combination in the coming months. Through this strategic merger, TMTG’s Truth Social, with a strong position in the marketplace, would bring a unique value perspective to DWAC’s shareholders.

As of December 31, 2022, DWAC’s current assets stood at $169 thousand. In addition, the company’s total assets were $300.50 million, compared to $293.99 million as of December 31, 2021.

DWAC’s shares have gained 3.7% over the past three months to close the last trading session at $13.93.

DWAC’s POWR Ratings reflect its solid prospects. The stock has a grade B for Momentum. However, it is ranked last among 100 stocks in the same industry.

In addition to the POWR Ratings I’ve just highlighted, you can see DWAC’s ratings for Growth, Stability, Value, Sentiment, and Quality here.

What To Do Next?

Get your hands on this special report with 3 low priced companies with tremendous upside potential even in today’s volatile markets:

3 Stocks to DOUBLE This Year >


FAF shares were unchanged in premarket trading Friday. Year-to-date, FAF has gained 17.03%, versus a 15.10% rise in the benchmark S&P 500 index during the same period.


About the Author: Mangeet Kaur Bouns

Mangeet’s keen interest in the stock market led her to become an investment researcher and financial journalist. Using her fundamental approach to analyzing stocks, Mangeet’s looks to help retail investors understand the underlying factors before making investment decisions.

More…

The post 3 Financial Stocks to Watch Closely for Momentum appeared first on StockNews.com

https://www.entrepreneur.com/finance/3-financial-stocks-to-watch-closely-for-momentum/458057


3 Renewable Energy Stocks Smart Investors Are Eyeing

The renewable energy industry’s prospects look promising, driven by surging demand for clean energy to address climate change concerns, favorable government incentives, and high and volatile fossil fuel prices. Thus, it could be wise to consider quality renewable energy stocks Alliance Resource (ARLP), Steel Partners (SPLP), and Westlake Chemical Partners (WLKP), which are attracting the attention of smart money. Read more….

Soaring demand and attractive, long-term government incentives and funding create solid tailwinds for the renewable energy industry this year and beyond. Rising demand is driven by an increasing need worldwide to transition to renewable energy to address climate change concerns and volatile fossil fuel prices.

Given the industry’s bright prospects, it could be wise to buy fundamentally sound renewable energy stocks Alliance Resource Partners, L.P. (ARLP), Steel Partners Holdings L.P. (SPLP), and Westlake Chemical Partners LP (WLKP), which have been gaining significant institutional investment traction lately.

Renewables, led by solar and electric vehicles (EVs), are expected to boost clean energy investment in 2023. Investments are propelled by various factors, including high and volatile fossil fuel prices, a strong alignment of global climate and energy security goals, and enhanced government support in strengthening the nation’s footholds in the emerging clean energy economy.

The Inflation Reduction Act (IRA) of 2022 allocates approximately $400 billion in federal funding to clean energy. With this legislation aimed at supercharging clean energy nationwide, an analysis from the National Renewable Energy Laboratory shows that the U.S. will get to around 80% clean electricity by 2030.

By 2035, federal analysis predicts that renewable sources will comprise approximately 86% of U.S. power, primarily spurred by the IRA.

Renewable energy investment hits a record-breaking $358 billion during the first six months of 2023, an increase of 22% compared to the start of last year, according to the latest investment data from BloombergNEF’s (BNEF) 2H 2023 Renewable Energy Investment Tracker report. Solar was the main driver of the stellar results in the first half of this year.

Moreover, a total of $239 billion was invested in large- and small-scale systems, accounting for two-thirds of total global renewable investment over the first six months of 2023 and resulting in a staggering 43% rise year-over-year. The U.S. invested $25.50 billion in large and small-scale solar during this year’s first half, marking an impressive 75% increase from the first half of 2022.

For the full year 2023, global renewable capacity additions are expected to grow by 107 gigawatts (GW), the largest absolute increase ever, to more than 440 GW, as per the International Energy Agency (IEA). Furthermore, global renewable capacity additions could reach 550GW in 2024.

According to a report by Mordor Intelligence, the U.S. renewable energy market size is projected to reach 636.44 GW by 2028, exhibiting a CAGR of 10% during the forecast period.

Given the industry’s tailwinds, fundamentally sound renewable energy stocks ARLP, SPLP, and WLKP, which are attracting smart money, could be solid buys now.

Let’s discuss the fundamentals of these stocks in detail:

Alliance Resource Partners, L.P. (ARLP)

ARLP is a diversified natural resource company that produces, markets and supplies energy domestically and internationally primarily to major utilities, metallurgical, and industrial customers. The company operates through Illinois Basin Coal Operations; Appalachia Coal Operations; Oil & Gas Royalties; and Coal Royalties segments.

Institutional shareholders own a 19.6% stake in ARLP. Also, the total value of its holdings amounts to $499 million.

On July 28, ARLP announced that the Board of Directors approved a cash distribution to its unitholders for the quarter that ended June 30, 2023. ARLP unitholders received a quarterly cash distribution of $0.70 per unit on August 14, 2023. This distribution represents an increase of 75% over the cash distribution of $0.40 per unit for the June 30, 2022 quarter.

The increase in cash distribution reflects the company’s strong financial position and is consistent with its long-term strategic capital allocation plans. ARLP’s annual dividend of $2.80 yields 13.98% on the prevailing share price, while its four-year average dividend yield is 13.50%.

ARLP’s trailing-12-month net income margin of 28.03% is 98.3% higher than the industry average of 14.13%. Also, the stock’s trailing-12-month ROCE, ROTC, and ROTA of 46.03%, 24.03%, and 26.42% are significantly higher than the industry averages of 21.34%, 10.40%, and 8.06%, respectively.

ARLP’s revenues increased 3.5% year-over-year to $641.84 million in the second quarter that ended June 30, 2023. Its income from operations grew 3.7% from the year-ago value to $183.93 million. The company’s EBITDA rose 1% year-over-year to $249.24 million. ARLP’s free cash flow came in at $153.48 million, an increase of 88.7% year-over-year.

Furthermore, the company’s net income and earnings per limited partner unit were $171.31 million and $1.30, increases of 4.6% and 5.7% year-over-year, respectively.

Street expects ARLP’s revenue for the fiscal year (ending December 2023) to increase 11.3% year-over-year to $2.68 billion. The company’s EPS for the current year is expected to grow 24.4% year-over-year to $5.46 million. Moreover, ARLP has surpassed the consensus EPS estimates in three of the trailing four quarters.

Shares of ARLP have gained 5.6% over the past month to close the last trading session at $20.03.

ARLP’s solid fundamentals are reflected in its POWR Ratings. The stock has an overall rating of A, which translates to a Strong Buy in our proprietary rating system. The POWR Ratings are calculated by considering 118 different factors, each weighted to an optimal degree.

ARLP has a grade of B for Value and Quality. Within the B-rated MLPs – Other industry, it is ranked first out of 8 stocks.

Beyond what we stated above, we also have ARLP’s ratings for Momentum, Stability, Quality, and Sentiment. Get all ARLP ratings here.

Steel Partners Holdings L.P. (SPLP)

SPLP, along with its subsidiaries, engages in energy, industrial products, defense, supply chain management, logistics, banking, and youth sports businesses across the world. The company operates through three segments: Diversified Industrial; Energy; and Financial Services.

SPLP exhibits substantial institutional ownership, with institutions owning around a 39.88% stake. Moreover, the total value of these holdings amounts to $383 million.

On August 9, SPLP’s Board of Directors declared a regular quarterly cash distribution of $0.375 per unit, payable on September 15, 2023, to unitholders of record as of September 1, 2023, on its 6% Series A Preferred Units. This reflects the company’s commitment to deliver value to its shareholders.

On May 1, SPLP and Steel Connect, Inc. (STCN) announced that Steel Partners and certain of its affiliates (the Steel Partners Group) had transferred certain marketable securities held by the Steel Partners Group to Steel Connect in exchange for 3.5 million shares of Series E Convertible Preferred Stock of Steel Connect.

The Preferred Stock would be convertible into an aggregate of 184,891,318 shares of Steel Connect common stock. Upon conversion of the Preferred Stock, the Steel Partners Group would hold nearly 85.12% of the outstanding equity interests of Steel Connect. This exchange transaction is expected to benefit SPLP significantly.

SPLP’s trailing-12-month gross profit margin of 35.03% is 15.5% higher than the industry average of 30.33%. And the stock’s trailing-12-month net income margin of 10.77% is 73.9% higher than the industry average of 6.19%. Also, its trailing-12-month levered FCF margin of 12.75% is 133.1% higher than the 5.47% industry average.

SPLP’s revenue increased 13.5% year-over-year to $500.90 million in the second quarter that ended June 30, 2023. The increase in revenue is driven by higher revenue from the Financial Services and Energy segments and favorable impact from the newly acquired Supply Chain segment. The company’s adjusted EBITDA rose 24.8% from the year-ago value to $73.60 million.

In addition, as of June 30, 2023, the company’s cash and cash equivalents were $353.16 million, compared to $234.45 million as of December 31, 2022.

SPLP’s stock has gained 6.1% over the past six months and 5.3% year-to-date to close the last trading session at $45.

SPLP’s POWR Ratings reflect this robust outlook. The stock has an overall rating of A, which equates to a Strong Buy in our proprietary rating system.

SPLP has a B grade for Growth, Sentiment, Stability, and Quality. It is ranked #3 among ten stocks in the B-rated MLPs – Other industry.

To see additional POWR Ratings for Value and Momentum for SPLP, click here.

Westlake Chemical Partners LP (WLKP)

WKLP operates, acquires, and develops ethylene production facilities and related assets. Its ethylene production facilities primarily convert ethane into ethylene. Also, it sells ethylene co-products, including propylene, crude butadiene, pyrolysis gasoline, and hydrogen, directly to third parties. Westlake Chemical Partners GP LLC serves as the company’s general partner.

Institutions own nearly 30.16% of WLKP, suggesting that the stock has credibility in the eyes of smart money and the total value of holdings is around $239 million.

On August 1, WLKP announced that the Board of Directors of Westlake Chemical Partners GP LLC approved a quarterly distribution of $0.4714 per unit to be payable on August 25, 2023, to unitholders of record as of August 11, 2023. This represents the 36th quarterly distribution by the company since its initial public offering.

MLP distributable cash flow provided trailing-12-month coverage of 1.05x the declared distributions for the second quarter of 2023. WLKP pays an annual dividend of $1.89, translating to a yield of 8.40% at the current price level. Its four-year average dividend yield is 8.23%. The company’s dividend payouts have grown at a CAGR of 3.8% over the past five years.

WLKP’s trailing-12-month EBITDA margin of 34.58% is 100.4% higher than the industry average of 17.26%. Likewise, the stock’s trailing-12-month levered FCF margin of 27.99% is significantly higher than the industry average of 3.90%.

During the second quarter that ended June 30, 2023, WLKP reported net sales of $264.18 million. Net income attributable to Westlake Partners came in at $11.87 million and $0.34 per common unit, respectively. For the six months ended June 30, 2023, the company’s cash inflows from operating activities were $243.40 million, an increase of 7.9% year-over-year.

Analysts expect WLKP’s revenue to increase 6.7% year-over-year to $1.52 billion for the fiscal year ending December 2024. The company’s EPS for the same period is expected to grow 17.8% from the prior year to $1.91. Over the past three months, the stock has gained 4.3% to close its last trading session at $22.46.

WLKP’s solid prospects are reflected in its POWR Ratings. The company has an overall B rating, translating to a Buy in our proprietary rating system.

WLKP has an A grade for Quality and a B for Value and Stability. It is ranked #2 in the same industry.

Click here to access additional POWR Ratings of Sentiment, Growth, and Momentum for WLKP.

What To Do Next?

Discover 10 widely held stocks that our proprietary model shows have tremendous downside potential. Please make sure none of these “death trap” stocks are lurking in your portfolio:

10 Stocks to SELL NOW! >


ARLP shares were unchanged in premarket trading Thursday. Year-to-date, ARLP has gained 9.10%, versus a 16.72% rise in the benchmark S&P 500 index during the same period.


About the Author: Mangeet Kaur Bouns

Mangeet’s keen interest in the stock market led her to become an investment researcher and financial journalist. Using her fundamental approach to analyzing stocks, Mangeet’s looks to help retail investors understand the underlying factors before making investment decisions.

More…

The post 3 Renewable Energy Stocks Smart Investors Are Eyeing appeared first on StockNews.com

https://www.entrepreneur.com/finance/3-renewable-energy-stocks-smart-investors-are-eyeing/457983


Should Investors Snatch Up Share of Delta Air Lines (DAL) This Week?

Delta Air Lines (DAL) is benefitting significantly from the strong rebound in air travel this year. So, is this the right time to invest in this airline operator stock? Read on.

Delta Air Lines, Inc. (DAL) has recently unveiled plans to increase its number of flights to China, a strategic move aimed at capitalizing on the ongoing recovery in travel demand. Given the pent-up demand for air travel and an expected rebound in profitability, DAL may present a promising investment opportunity this week.

The International Air Transport Association (IATA) has revised its 2023 outlook, predicting the airline industry’s net profits will hit $9.8 billion this year, more than double the previous estimate of $4.7 billion from December 2022.

This enhanced profitability forecast is underpinned by factors including China lifting COVID-19 restrictions earlier than anticipated, cargo revenues remaining above pre-pandemic levels, and moderating jet fuel prices.

Strong bookings this summer have led DAL to report record revenue and profitability for the June quarter. Also, the airline operator has raised its 2023 earnings guidance while maintaining its projection of generating $3 billion in free cash flow.

To provide a comprehensive overview of DAL’s prospects, delving more deeply into the company’s key financial metrics trends is vital.

Delta Air Lines Inc’s Financial Journey: Transformation and Growth (2020 – 2023)

The trailing-12-month net income of DAL experienced significant fluctuations from 2020 to 2023.

  • At the end of the third quarter of 2020, the net income plunged to -$10.53 billion and continued to dwindle throughout 2020, reaching its lowest point at -$12.38 billion by the end of December.
  • In the first quarter of 2021, DAL’s net income slightly dropped to -$13.02 billion. However, the second quarter saw an improvement, with the net income climbing to -$6.66 billion, marking the start of a steady recovery.
  • By the end of September 2021, the net income had significantly recovered to -$68 million. By the end of December 2021, the company recorded a positive net income of $280 million for the first time in over a year.
  • This upward trend continued into 2022, with profits rising steadily from $516 million in the first quarter to $599 million in the second quarter. A minor dip occurred in the third quarter with a net income of $82 million but quickly bounced back to $1.31 billion by the end of December.
  • The growth trend persisted into 2023, rising from $1.89 billion in the first quarter to $2.98 billion in the second quarter.

Comparing the first value (-$10.53 billion) to the last value ($2.98 billion), DAL’s net income has remarkably grown by approximately 128% within this period.

DAL experienced a varying trend in its trailing-12-month revenue from the third quarter of 2020 until the second quarter of 2023.

  • In September 2020, the company reported $24.56 billion in revenue.
  • At the end of the year, December 2020, the revenue significantly decreased to $17.1 billion.
  • There was a consistent decline in the first quarter of 2021, with $12.65 billion recorded in March.
  • In June 2021, a slight recovery was observed when the revenue increased to $18.31 billion, but it was still lower than the 2020 figures.
  • The following quarter, September 2021, experienced a notable surge, with the revenue nearly returning to the previous year’s level at $24.4 billion.
  • There was continuous and noticeable growth in the next three quarters, reaching $29.9 billion in December 2021, $35.1 billion in March 2022, and $41.80 billion in June 2022.
  • The increasing trend continued over the next two quarters, reaching a peak of $50.58 billion in revenue by the end of 2022.
  • The upward trajectory stretched into 2023, with revenue reaching $53.99 billion in March and $55.75 billion by June of that year.

The data indicates a growth rate of approximately 127% from the first value ($24.56 billion in September 2020) to the last value ($55.75 billion in June 2023). The significant fluctuations in the early stages recording a decline gradually gave way to steady growth in more recent periods, with the most notable increase occurring towards the end of 2022, which continued into 2023. Therefore, it can be inferred that despite some fluctuation, there is a generally positive trend in DAL’s performance based on this series of revenue data.

The Return on Assets (ROA) of DAL has demonstrated a fluctuating trend from September 30, 2020, to June 30, 2023. Here are some key points in the data:

  • Delta saw a continuous negative ROA from September 30, 2020 (-0.148 or -14.8%) through March 31, 2021 (-0.176 or -17.6%). This trend reached its lowest point in the first quarter of 2021.
  • Smooth recovery began in the second quarter of 2021 with an upsurge of ROA to -0.089 by June 30, 2021, and continued to improve in the subsequent quarters, hitting a near-zero value by September 30, 2021 (-0.001 or -0.1%).
  • From December 31, 2021, the ROA turned positive and has been rising slightly every quarter. By December 31, 2022, DAL recorded an ROA of 0.018 (1.8%).
  • The most recent data shows that by the end of the second quarter in 2023, DAL’s ROA had further increased to 0.041 (4.1%).

Taken as a whole, the growth rate of DAL’s ROA, which measures the final value from the initial value, shows an increase from -0.148 in September 2020 to 0.041 in June 2023, marking a significant recovery.

The trend and fluctuations of DAL Analyst Price Target from November 12, 2021, to August 24, 2023, can be summarized as follows:

  • The Price Target started at $54 on November 12, 2021, and saw a minor increase to $54.5 by November 26, 2021. This value remained steady till mid-December 2021.
  • After that, a decrement happened, bringing down the Price Target to $52 by the end of December 2021. The beginning of 2022 saw further decreases, with the Price Target dipping to $50 by February 18. This value then remained steady till mid-April 2022.
  • A brief rise to $53.5 was seen by the end of April 2022, which remained constant until June 2022.
  • Another decrement happened mid-year, where the Price Target came to $49.25 by end of July 2022 and continued to decrease slowly over the third quarter of 2022, reaching $48.5 in November.
  • Little fluctuation was evident between late 2022 and early 2023, keeping the Price Target around this range.
  • After minor ups and downs between February to April 2023, the Price Target dipped to $48.5 by April’s end and remained consistent for two months.
  • From June end 2023 onward, a sharp increase is observable. The Price Target rose to $50.7 in the last week of June 2023.
  • This ascending trend continued, with the Price Target volunteering a remarkable leap to $55 in the second week of July 2023.
  • With further enhancement, this trend peaked on August 24, 2023, scoring a Price Target of $60.

Overall, from the initial $54 in November 2021 to $60 by August 2023, the DAL Price Target growth rate is approximately 11%. Emphasis on the latest data indicates an upward trend at present. The Price Target stands at $60 on August 24, 2023, noting a steady increment from the start of July 2023.

Delta Air Lines Stock Performance Analysis: A Volatile Growth Journey, March-August 2023

Reviewing the provided data from DAL, a distinct share price trend emerges from March to August 2023. Here is a general overview:

  • As of March 3, 2023, the share price was $38.36.
  • It shows a slight increase on March 10, 2023, with a value of $38.86.
  • The share price then declined for the rest of March, reaching a low of $32.86 by March 24.
  • The share price steadily increased from April through mid-June, culminating at $41.73 on June 16.
  • It continued to rise, peaking at $48.03 on July 21.
  • However, the price started a downward trend in late July and August, closing at $42.20 on August 23.

To summarize, DAL’s shares showed an accelerating growth rate from April to July but had started decelerating by late July. This trend persisted into August 2023. Overall, the data suggests volatility in share prices over the months studied, with a general trend toward growth that appears to falter later in this timeframe. Here is a chart of DAL’s price over the past 180 days.

Analyzing Delta Air Lines’ Growth, Quality, and Momentum Trends in 2023

DAL has an overall B rating, translating to a Buy in our POWR Ratings system. It is ranked # among the 28 stocks in the Airlines category.

The data sheds light on DAL’s continuously strong trading performance and advancing status within the competitive Airlines category of stocks.

Looking at the POWR Ratings for DAL, the three dimensions that stand out the most, in terms of high ratings and clear trends, are Growth, Quality, and Momentum.

Growth: Growth has consistently maintained high ratings over the period. Starting with a value of 95 in February 2023, it saw a minor uptick to 96 in March 2023. After that, the value dipped slightly in the subsequent months, hitting a low of 81 by August 2023.

Quality: The quality dimension exhibited steady improvement throughout the period. It started from a fair value of 62 in February 2023. By the end of August 2023, the rating for Quality had risen to 74, marking a significant step up.

Momentum: In terms of momentum, DAL demonstrated a remarkable upward trend. From the starting point of 32 in February 2023, the value had more than doubled to 67 in August 2023. This shows a robust increase in momentum over six months.

From the data, it can be inferred that while the growth dimension has seen a slight downward trend, the quality and momentum dimensions trends were clearly upward over these months for DAL. Despite the decrease in Growth, it still maintains a robust value, making these three categories the prime contributors to DAL’s overall ranking.

How does Delta Air Lines Inc. (DAL) Stack Up Against its Peers?

Other stocks in the Airlines sector that may be worth considering are Cathay Pacific Airways Limited (CPCAY), Air Canada (ACDVF), and Air France-KLM SA (AFLYY) — they have better POWR Ratings.

What To Do Next?

Discover 10 widely held stocks that our proprietary model shows have tremendous downside potential. Please make sure none of these “death trap” stocks are lurking in your portfolio:

10 Stocks to SELL NOW! >


DAL shares fell $0.01 (-0.02%) in premarket trading Thursday. Year-to-date, DAL has gained 28.69%, versus a 16.72% rise in the benchmark S&P 500 index during the same period.


About the Author: Subhasree Kar

Subhasree’s keen interest in financial instruments led her to pursue a career as an investment analyst. After earning a Master’s degree in Economics, she gained knowledge of equity research and portfolio management at Finlatics.

More…

The post Should Investors Snatch Up Share of Delta Air Lines (DAL) This Week? appeared first on StockNews.com

https://www.entrepreneur.com/finance/should-investors-snatch-up-share-of-delta-air-lines-dal/457982


Big Profits from Low Priced Stocks

How low will stocks go? That is the question on everyone’s mind as the recent highs for the S&P 500 (SPY) seem like a distant memory as stocks have been going the wrong direction for the entirety of August. Investment expert Steve Reitmeister the causes of the recent sell off plus a market outlook, trading plan and 11 top picks for the days ahead. Read on below for the full story.

There is no doubt a pullback is taking place as the S&P 500 (SPY) is a good spot off the recent highs found at the end of July. Since then, the large cap index has given back around 4% with small caps and other Risk On positions seeing even worse results.

The key questions at this time are: Where is bottom? And when will we get there?

We will explore these vital topics in this week’s Reitmeister Total Return commentary.

Market Commentary

We are going to tackle commentary in reverse order today…first explore the price action, then talk about the fundamentals driving price.

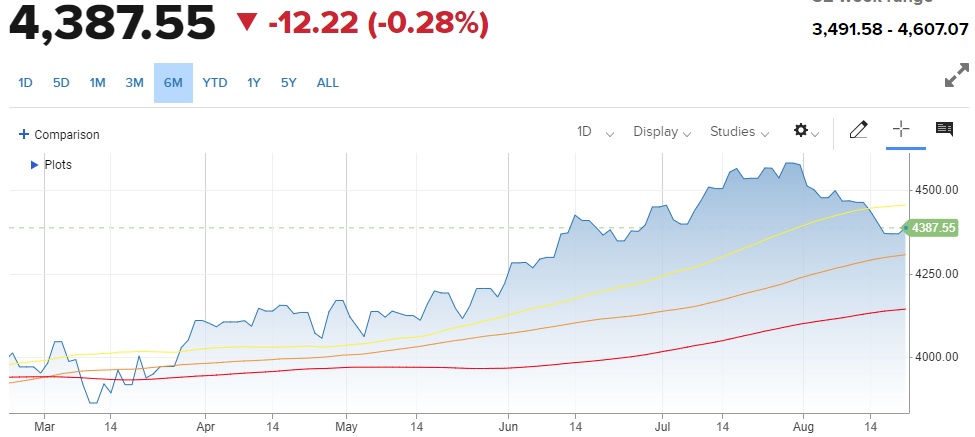
As noted above, stocks topped out near 4,600 at the end of July. Since then has been an ongoing process to find bottom:

Moving Averages: 50 Day (yellow), 100 Day (orange), 200 Day (red)

Stocks cut through the 50 day moving average like a hot knife through butter and have not looked back. Clearly a deeper wash out was needed given five straight months of excellent gains.

Next up we had psychological support at 4,400. That too did not hold. Then came up just short of breaking back above on Monday followed by another failed test on Tuesday.

That makes 3 straight closes below 4,400. This means we now likely have to contemplate whether the 100 day moving average at 4,305 will hold as support and bottom of the range. We got fairly close on Friday with an intraday strike down to 4,335 before a bounce ensued.

My gut tells me it wouldn’t take much to dive another 2% to test that 100 day moving average. That likely is as far as we need to go given the fundamental story in hand.

Meaning that a test of the long term trend line (200 day MA) at 4,136 seems likely overkill at this time. Probably the 100 day moving average is as far as we need to go.

Getting as low as the 200 day moving average is plausible ONLY if the economic events from here come in much worse than expected. Thus, a good time to switch to the fundamental picture of the market.

Fundamental Picture

My main thesis is that we have a long term bull market unfolding as the Fed does look on track with a soft landing as they bring inflation down to size.

DON’T thank the Fed…they have been doing their level best to create unemployment and a recession.

The main reason a recession has not unfolded…and likely won’t happen, is that the 2-4 million early retirees during Covid created an employment shortage. Anybody who wants a job can pretty much find one leading to historically low unemployment rate that has not buckled under the pressure of 1.5 years of intense rate hikes.

Unfortunately, this thesis includes the fact that bulls got way ahead of themselves bidding stocks up to 4,600 when the economy is still soft and earnings growth is non-existent. This led to an elevated PE over 20 which is too much weight for the current fundamentals to withstand.

The natural conclusion given above is to have a long overdue pullback that properly resets market equilibrium at a more logical valuation. This begets a trading range between likely the 100 day moving average at 4,305 and the previous high of 4,600.

This is a comfy trading range to play around in awaiting the next key catalysts to break out. Most likely that will be a break higher as the soft landing comes together allowing the Fed to lower rates which is strong caffeine promoting higher stock prices.

Yet while in the trading range we are very susceptible to every new headline that could make us go higher one day…and lower the next. So, let’s review the key economic events before us that could provide the next catalyst for the overall market:

8/16 FOMC Minutes: This happened last week. But an important piece of information to weigh against other events down the road.

The actual meeting on 7/25 the Fed clearly started their “dovish tilt“. That being the acknowledgement that inflation is moderating nicely. Plus, they no longer saw a recession unfolding before they were ready to lower rates. However, the meeting minutes had a bit more language about the “potential need” to raise rates further to put the final nails in the high inflation coffin.

Given that the market was already in the midst of a pullback, then this was just another reason to hit the sell button. Yet really, the language of the minutes was no more hawkish than any statement made by the Fed in the past to give themselves whatever flexibility necessary to win the battle over inflation.

All in all, the pathway is there for the Fed to not have to raise rates further and create the soft landing for the economy which leans bullish in the long run.

8/23 PMI Flash: This report rarely makes headlines, but is a strong leading indicator of the trends found in the next round of ISM Manufacturing & Services reports the first week of the new month. Thus, always beneficial to review this announcement to appreciate if odds of recession are going higher or lower. Right now investors expect this reading to be the same as last month at 52 with services in better shape than manufacturing.

9/1 Government Employment Situation: The job add expectations continue to ebb lower as the Fed rate hikes slow down the economy. But gladly has not tipped over into negative territory that would raise the unemployment rate…and risk of recession. Right now, the forecast calls for 180,000 jobs added which would be a very “Goldilocks” outcome where the unemployment rate would stay low. On the other hand, not so many jobs created as to heat up wage inflation that would concern the Fed.

9/1 ISM Manufacturing: This has been the weakest part of the economic picture with 9 straight readings in contraction territory (below 50). Right now, it seems that June may be the worst of these readings with July a notch higher…and the August reading on 9/1 expected to be another step in the right direction.

9/6 ISM Services: This is the larger, and healthier part of the economy leading to the positive GDP readings. It is currently expected to be somewhat in line with last month’s 52.7 reading, which is modestly in expansion territory. Yet I think the impressive mid month reading for Retail Sales may lead to a topping of current ISM Service expectations.

9/13 Consumer Price Index (CPI): Inflation reports are the most telling of what the Fed will do with future rate hike decisions. Gladly this key inflation report has been moderating faster than expected for quite some time. Thus, that positive trend staying in place will be key to reignite bullish sentiment. And will have a fair amount to do with the next item…

9/20 Fed Rate Announcement: Right now, investors place 85% odds of the Fed pressing pause on rates. And yes, this appears to be the pattern going back the past few meetings (hike > pause). Plus the tenor of what was said at the last announcement combined with inflation reports since then came coming under expectations.

As always, what Powell says at the press conference has much more impact on the market than the initial rate decision. What investors will be looking for is whether the dovish tilt that started in July will be more or less dovish this time around. Obviously…the more dovish it sounds for the future…the better it is for stock prices.

Trading Plan

Fundamentally we are in a bull market. And technically in a bull market because we are well above the 200 day moving average. But yes, stocks were overdue for a stiff sell off which is taking place now.

Now we are just trying to find bottom. Maybe already found it…but sense a test of the 100 day moving average at 4,305 could unfold.

But even at current prices we are in a “buy the dip” scenario as the market will likely retest 4,600 early in the Fall. Then have a good shot for Santa Claus rally to help close out the year taking a shot at the all time high of 4,818.

Now we just need to consider what are the best stocks & ETF’s for this environment. And that is what the next section will tackle…

What To Do Next?

Discover my current portfolio of 6 stocks packed to the brim with the outperforming benefits found in our POWR Ratings model.

Plus I have added 5 ETFs that are all in sectors well positioned to outpace the market in the weeks and months ahead.

This is all based on my 43 years of investing experience seeing bull markets…bear markets…and everything between.

If you are curious to learn more, and want to see these 11 hand selected trades, then please click the link below to get started now.

Steve Reitmeister’s Trading Plan & Top Picks >

Wishing you a world of investment success!


Steve Reitmeister…but everyone calls me Reity (pronounced “Righty”)
CEO, StockNews.com and Editor, Reitmeister Total Return


SPY shares rose $0.35 (+0.08%) in after-hours trading Tuesday. Year-to-date, SPY has gained 15.43%, versus a % rise in the benchmark S&P 500 index during the same period.


About the Author: Steve Reitmeister

Steve is better known to the StockNews audience as “Reity”. Not only is he the CEO of the firm, but he also shares his 40 years of investment experience in the Reitmeister Total Return portfolio. Learn more about Reity’s background, along with links to his most recent articles and stock picks.

More…

The post Big Profits from Low Priced Stocks appeared first on StockNews.com

https://www.entrepreneur.com/finance/big-profits-from-low-priced-stocks/457887


Buy the Dip NOW!

As the title of this article implies, Steve Reitmeister believes now is the time to buy the dip for the stock market. Simply 4,600 was too high for the S&P 500 (SPY) given current conditions. And the recent trip down towards 4,300 is too low. The key is knowing which stocks to buy to outperform. More about that in the article below.

Fret not dear investor. The recent rally for the S&P 500 (SPY) was overextended with this sell off being the natural consequence.

Let’s spend our time wisely discussing why stocks are down…how much lower they will go…why they will bounce…and when to buy back in for the next leg higher.

All that and more awaits you in today’s commentary.

Market Commentary

Good news is that the yield curve is getting less steep which decreases odds of a recession.

Bad news is that it is happening as long term rates are going up which is bad news for all forms of borrowing including cars, housing and long term investment in a business (which is the main fuel for economic growth).

Why is this happening?

It all started after the Fitch ratings downgrade for the US when the 10 year was closer to 3.8%…yet now is a good spot higher at 4.3%. Which is the highest level for these rates since the Fed embarked on their hawkish regime.

However, I suspect very little of it really has to do with the Fitch downgrade. The more I read on this topic…the more people are discussing the Fed minutes from Wednesday. That being where there is still solid concern on the part of committee members that inflation is well above target…not coming down fast enough…and that more rate hikes could be needed.

Even if they don’t raise rates again, which is my prediction, they could simply leave the current high rates in place longer than previous anticipated. This too would push up the longer end of the yield curve.

Why is this bad news for the stock market?

When you consider the importance of asset allocation between stocks and bonds…then the higher the bond rates, the more attractive bonds become…and the less attractive it is for stocks. So more investment dollars flow out of stocks towards bonds as rates escalate.

No doubt some of the recent sell off was simply investors finally taking some profits off the table. Unfortunately, there is more to the story given this investment trade off issue noted above as bond rates rise.

How much higher will Treasury rates go from here? I suspect not much higher UNLESS upcoming inflation readings are hotter than expected pushing the Fed to act more vigorously with additional rate hikes.

And yes, the more hawkish the Fed becomes…the greater the risk of recession…which clearly is a negative for stocks.

All in all, this sell off was long overdue. Yet, given the facts in hand it is hard to be bearish. In particular, how much inflation has come down without a recession forming, thus making soft landing the most likely possibility.

Further, beyond the soft landing the Fed will be lowering rates…meaning more accommodative. That has always been a good tasting tonic for stock gains.

Rather right now all we are determining the bottom of this move for which stocks bounce…and then play in a trading range for a while awaiting the next catalyst to bolt higher.

Thursday marked the 3rd straight close under the 50 day moving average (4,450). And the first close below 4,400 which was an area of psychological support. In fact, it spent most of the Thursday teetering at 4,400 before breaking lower in earnest.

As stated in my last commentary, I think there are solid odds that investors may push down to the 100 day moving average (4,292) before calling it quits on this overdue pullback. That is about 2% below Thursday’s close. Not too scary in the grand scheme of things given that we started the year around 3,800.

Trading Plan

This is still a bull market til proven otherwise. But yes, investors are FINALLY reappreciating that the bearish argument was never gone. That the Fed could go to far creating recession.

So this pullback from 4,600 is creating a better resting place for stocks. As in a price that better balances the future bullish vs. bearish possibilities.

I continue to see this as a “buy the dip” especially for those who have been under allocated to the stock market this year. No doubt you have been waiting for an opportunity to get back in as you didn’t like chasing it when reaching 4,600. So now under 4,400 and likely finding bottom here soon…NOW IS YOUR TIME TO BUY IN.

I am practicing what I preach on this front as I put more money to work in my Reitmesiter Total Return portfolio. As well as putting 7 figures worth of cash back to work in my personal accounts this week.

If you are looking for the exact perfect moment…you will never catch it in real time. That fantasy of perfect timing leads to indecision…and then missing the train altogether.

Looking out to the end of 2024, when the market will be making new all time highs well above 5,000 (maybe even hit 6,000)…then it is crazy at this point to quibble over 1% here or there. Just jump in and act now!

What should you buy?

More on that below…

What To Do Next?

Discover my current portfolio of 6 stocks packed to the brim with the outperforming benefits found in our POWR Ratings model.

Plus I have added 5 ETFs that are all in sectors well positioned to outpace the market in the weeks and months ahead.

This is all based on my 43 years of investing experience seeing bull markets…bear markets…and everything between.

If you are curious to learn more, and want to see these 11 hand selected trades, then please click the link below to get started now.

Steve Reitmeister’s Trading Plan & Top Picks >

Wishing you a world of investment success!


Steve Reitmeister…but everyone calls me Reity (pronounced “Righty”)
CEO, StockNews.com and Editor, Reitmeister Total Return


SPY shares were trading at $435.87 per share on Friday afternoon, down $0.42 (-0.10%). Year-to-date, SPY has gained 14.83%, versus a % rise in the benchmark S&P 500 index during the same period.


About the Author: Steve Reitmeister

Steve is better known to the StockNews audience as “Reity”. Not only is he the CEO of the firm, but he also shares his 40 years of investment experience in the Reitmeister Total Return portfolio. Learn more about Reity’s background, along with links to his most recent articles and stock picks.

More…

The post Buy the Dip NOW! appeared first on StockNews.com

https://www.entrepreneur.com/finance/buy-the-dip-now/457728


Is Smart Money Following These 3 Entertainment Stocks?

The entertainment sector’s prospects are bolstered by continued innovation and a surge in demand for recreational activities. Therefore, it could be wise to watch entertainment stocks Sony Group (SONY), News Corporation (NWSA), and Vivendi SE (VIVHY), with considerable institutional ownership now. Read on….

Amid fears of an economic slowdown, consumers’ discretionary spending faces a considerable squeeze. Nevertheless, the entertainment industry is well-positioned to weather these challenges, bolstered by increased consumer demand and the integration of advanced technologies.

Given this backdrop, investing in stocks favored by institutional investors could prove rewarding. To that end, Sony Group Corporation (SONY), News Corporation (NWSA), and Vivendi SE (VIVHY) could be worth adding to your watchlist now.

During the pandemic, media companies experienced a surge in subscribers and stock prices, pouring billions into fresh content creation. However, the industry’s growth has stagnated, leading to widespread budget cuts and layoffs.

The sticky inflation and fears of an economic slump have significantly impacted consumers’ discretionary spending habits, directing them more toward essentials. Within the entertainment sphere, macroeconomic adversities since last year have escalated production costs, thwarted ad revenue, and wiped out hundreds of billions in value from entertainment and media firms.

Coupled with dwindling ad income and losing profit in streaming services, the media and entertainment industry is also contending with Hollywood strikes. This compelled companies to withdraw big-budget movies from the 2023 release calendar, jeopardizing theaters, frustrating fans, and ultimately damaging the industry’s well-being.

Despite the challenges, the industry has evolved significantly and is predicted to grow because of persistent demand. The entertainment industry is continually adapting to meet dynamic consumer needs.

Moreover, incorporating advanced digital tools and technology is expected to usher in a new era of creativity, flexibility, and cost-optimized offerings tailored to consumer requirements. For instance, with the expansion of usage and intricacy of generative AI, the industry is poised to be at the forefront. Generative AI in the media and entertainment market is expected to reach $12.08 billion by 2032, growing at a CAGR of 26.7%.

Furthermore, the global entertainment industry market is projected to reach $49.56 billion by 2032, growing at a CAGR of 11%.

Therefore, following smart money and watching entertainment stocks SONY, NWSA, and VIVHY could be wise.

Sony Group Corporation (SONY)

Headquartered in Tokyo, Japan, SONY designs, produces, and sells electronic appliances internationally for the consumer, professional, and industrial markets. The company develops and distributes music, game applications, live-action, and animated motion pictures, operates television networks, direct-to-consumer streaming services, visual effects, and animation units, and manages a studio facility. Institutions hold roughly 7.9% of SONY shares. Of the 656 institutional holders, 305 have increased their positions in the stock. Moreover, 79 institutions have taken new positions in the stock.

SONY has lodged a patent that details a system for incorporating scents into entertainment media. This inventive approach utilizes visual and audio cues to trigger the release of targeted fragrances, thereby deepening the immersive experience for users.

Although this is not the industry’s initial endeavor towards using aromas as part of entertainment, earlier efforts failed to achieve widespread adoption. However, if SONY effectively implements it, it could benefit from such an innovative feature.

SONY’s trailing-12-month net income margin of 8.12% is 94.4% lower than the 4.18% industry average, while its trailing-12-month levered FCF margin of 9.78% is 115.64% higher than the 4.53% industry average. Also, its trailing-12-month cash from operations of $2.37 billion is significantly higher than the industry average of $211.71 million.

SONY’s total sales and financial services revenue increased 35.3% year-over-year to ¥3.06 trillion ($21.78 billion) in the fiscal fourth quarter that ended March 31, 2023, with Entertainment, Technology & Services segment revenue at ¥493.85 billion ($3.51 billion). Its operating income stood at ¥128.46 billion ($913.81 million).

Its net income and net income per share attributable to SONY’s stockholders increased 14.3% and 16.4% year-over-year to ¥129.14 billion ($918.61 million) and ¥103.53, respectively. Also, as of March 31, 2023, its total current assets increased 4.4% year-over-year to ¥5.78 trillion ($41.09 billion).

SONY’s revenue is expected to increase significantly year-over-year to $84.04 billion for the fiscal year ending March 2024, while its EPS is expected to come to $5.41 in the same period. Moreover, it surpassed the consensus EPS estimates in three of the trailing four quarters, which is promising.

Over the past year, the stock has gained 4.8% to close the last trading session at $90.44. The stock gained 18.6% year-to-date.

SONY’s POWR Ratings reflect its outlook. The POWR Ratings assess stocks by 118 different factors, each with its own weighting.

SONY has a B grade for Sentiment. It is ranked #3 out of 13 stocks in the Entertainment – Media Producers industry.

Click here for the additional POWR Ratings for Growth, Value, Momentum, Stability, and Quality for SONY.

News Corporation (NWSA)

NWSA is a media and information services company that creates and distributes authoritative and engaging content and other products and services for consumers and businesses worldwide. It has six operational segments: Digital Real Estate Services, Subscription Video Services, Dow Jones, Book Publishing, News Media, and Other. Roughly 100.6% of NWSA shares are held by institutions. Of the 446 institutions owning NWSA shares, 186 have recently increased their positions in the stock.

NWSA’s trailing-12-month asset turnover ratio of 0.59x is 20.7% higher than the 0.49x industry average. Also, its trailing-12-month cash from operations of $994 million is 332.7% higher than the industry average of $229.74 million.

NWSA’s net revenue stood at $2.45 billion for the fiscal third quarter that ended March 31, 2023, with Subscription Video Services revenue at $477 million. Its total segment EBITDA came at $320 million for the same quarter. As of March 31, 2023, its total subscribers grew 3.4% year-over-year to 4.66 million, primarily due to the growth in streaming subscribers.

Its adjusted net income attributable to shareholders and adjusted EPS amounted to $53 million and $0.09, respectively. As of March 31, 2023, its total current liabilities stood at $3.20 billion, compared to $3.52 billion as of June 30, 2022.

NWSA’s revenue and EPS are expected to increase 1.1% and 41.7% year-over-year to $2.50 billion and $0.17, respectively, for the fiscal first quarter ending September 2023.

Over the past year, the stock has gained 18.8% to close the last trading session at $20.21. The stock gained 11% year-to-date.

NWSA’s outlook is reflected in its POWR Ratings. The stock has a B grade for Sentiment. Within the same industry, it is ranked first.

Beyond what we’ve stated above, we have also given NWSA grades for Growth, Value, Momentum, Stability, and Quality. Get all the NWSA ratings here.

Vivendi SE (VIVHY)

Headquartered in Paris, France, VIVHY operates as an entertainment, media, and communication company in France, the rest of Europe, the Americas, Asia/Oceania, and Africa. It operates through Canal+ Group, Havas, Prisma Media, Gameloft, Vivendi Village, New Initiatives, Generosity and Solidarity, and Corporate segments. Institutions own 15,031 shares of VIVHY, with an institution taking a new position of 15,009 shares recently.

On April 25, 2023, the ordinary dividend of €0.25 per share was paid to the shareholders from April 27, in respect of fiscal year 2022, corresponding to a total amount distributed of €256 million ($283.32 million). It pays a $0.28 per share dividend annually, translating to a 3.07% yield on the current share price. Its four-year average dividend yield is 47.95%.

In addition, in the first half of 2023, VIVHY’s share buybacks totaled €29 million ($32.09 million), or 3 million shares, allocated for employee shareholding transactions. After the cancellation of 78.6 million shares in 2023, VIVHY currently holds 5.3 million of its shares (0.51% of its share capital).

In June, VIVHY received approval from the European Commission to proceed with its proposed transaction with Lagardère. Completing the acquisition would lead to VIVHY’s employee count rising to 66,000, compared to 38,000 at the end of December 2022.

It would also give the company a more substantial presence in France, Spain, the U.K., and the U.S. Its annual revenues are projected to reach approximately €17 billion ($18.81 billion), compared to around €10 billion ($11.07 billion) today.

VIVHY’s trailing-12-month CAPEX/Sales of 4.09% is 1.7% higher than the 4.02% industry average. Also, its trailing-12-month cash from operations of $545.61 million is 137.5% higher than the industry average of $229.74 million.

For the six months that ended June 30, 2023, VIVHY’s revenues increased 3.7% year-over-year to €4.70 billion ($5.20 billion). Its adjusted net income and net income per share stood at €324 million ($358.57 million) and €0.32, up 458.6% and 433.3% year-over-year.

Moreover, as of June 30, 2023, VIVHY’s current liabilities stood at €7.97 billion ($8.82 billion), compared to €8.96 billion ($9.92 billion) as of December 31, 2022.

VIVHY’s revenue and EPS are expected to increase 6.5% and 51.1% year-over-year to $10.78 billion and $0.77, respectively, for the fiscal year ending December 2023. Moreover, it surpassed the consensus revenue estimates in three of the trailing four quarters.

The stock has gained marginally intraday to close the last trading session at $9. Over the past five days, the stock gained 1.2%.

VIVHY’s outlook is reflected in its POWR Ratings. The stock has a B grade for Sentiment. Within the Entertainment – Media Producers industry, it is ranked #2.

To see the additional POWR Ratings for Growth, Value, Momentum, Stability, and Quality for VIVHY, click here.

What To Do Next?

Discover 10 widely held stocks that our proprietary model shows have tremendous downside potential. Please make sure none of these “death trap” stocks are lurking in your portfolio:

10 Stocks to SELL NOW! >


SONY shares fell $0.32 (-0.35%) in premarket trading Tuesday. Year-to-date, SONY has gained 18.43%, versus a 17.86% rise in the benchmark S&P 500 index during the same period.


About the Author: Sristi Suman Jayaswal

The stock market dynamics sparked Sristi’s interest during her school days, which led her to become a financial journalist. Investing in undervalued stocks with solid long-term growth prospects is her preferred strategy. Having earned a master’s degree in Accounting and Finance, Sristi hopes to deepen her investment research experience and better guide investors.

More…

The post Is Smart Money Following These 3 Entertainment Stocks? appeared first on StockNews.com

https://www.entrepreneur.com/finance/is-smart-money-following-these-3-entertainment-stocks/457111