5 Europe ETFs Top S&P 500 in 2021 & Offer More Value

European stocks exhibited their longest winning streak since 2013, thanks to upbeat corporate earnings and an easy money policy. The Financial Times article revealed that the Stoxx 600 European equity index has gained 2% in August, resulting in its seventh successive month of gains and its longest period of monthly increases since the end of the financial crisis in 2012-2013.

– Zacks

The article went on to elaborate that companies on the Stoxx have reported aggregate second-quarter net income growth of 249% year over year, when coronavirus lockdowns brought the entire world to a halt. The percentage of European companies that reported ahead of analysts’ earnings estimates touched a five-year high in the second quarter, according to data provider FactSet, as quoted on Financial Times.

Notably, companies under the S&P 500 Index have reported a 93% jump in earnings per share for the second quarter compared with the same period last year, according to FactSet.This entails European equities’ relative strength over the American ones at the current level.Plus, ultra-easy monetary policies around the world and the resultant decline in the yields have made equities more lucrative from the gains point of view.

Growing vaccination and a recovery in travel and consumer spending in the Eurozone is in the cards, especially with a lot of pent-up demand and hefty savings made by indoor-keeping consumers. The latest round of downbeat U.S. jobs data cemented the speculation that the global easy money policies will run for a few more months. As a result, European equities had their biggest rise since late July on Sep 7.

In a nutshell, the winning momentum in Europe is pretty upbeat, though things started moderating a bit. IHS Markit’s purchasing managers’ index for the Eurozone moderated slightly in August from a 15-year high the previous month.

Per the PMI survey, “growth momentum is starting to roll over in the euro area,” as Bank of America strategists led by Sebastian Raedler commented in a research note, as quoted on Financial Times.  The BofA team expects the eurozone economy to grow 8.3% year over year in the third quarter of 2021, before year-on-year growth moderates to 4.4% in the fourth quarter.

Against this backdrop, below we highlight a few Europe ETFs that matched or beat the return of the S&P 500 (21.9%) in 2021 and that have a lower P/E than that of the S&P 500 (22.20X). This means that these Europe ETFs still have further potential to grow.

ETFs in Focus

WisdomTree Europe SmallCap Dividend ETF DFE – Up 24.59%; P/E: 18.33X

The underlying WisdomTree Europe SmallCap Dividend Index is a fundamentally weighted index that measures the performance of the small-capitalization segment of the European dividend-paying market. The fund charges 58 bps in fees and yields 2.32% annually.

iShares MSCI Poland ETF EPOL – Up 23.51%; P/E: 19.59X

The underlying MSCI Poland IMI 25/50 Index measures the equity market performance in Poland. The fund charges 59 bps in fees.

WisdomTree Europe Hedged SmallCap Equity ETF EUSC – Up 22.95%; P/E: 15.04X

The underlying WisdomTree Europe Hedged SmallCap Equity Index is designed to provide exposure to the European equity markets while at the same time neutralizing exposure to fluctuations of the Euro movements relative to the U.S. dollar. The fund charges 58 bps in fees.

iShares MSCI Austria ETF EWO – Up 29.40%; P/E: 19.99X

The underlying MSCI Austria IMI 25/50 Index measures the equity market performance in Austria. The fund charges 51 bps in fees.

First Trust United Kingdom AlphaDEX ETF FKU – Up 22.33%; P/E: 13.31X

The underlying NASDAQ AlphaDEX United Kingdom Index is an enhanced index which employs the AlphaDEX stock selection methodology to select stocks from the NASDAQ United Kingdom Index.

Zacks’ Top Picks to Cash in on Artificial Intelligence

This world-changing technology is projected to generate $100s of billions by 2025. From self-driving cars to consumer data analysis, people are relying on machines more than we ever have before. Now is the time to capitalize on the 4th Industrial Revolution. Zacks’ urgent special report reveals 6 AI picks investors need to know about today.

See 6 Artificial Intelligence Stocks With Extreme Upside Potential>>

Want the latest recommendations from Zacks Investment Research? Today, you can download 7 Best Stocks for the Next 30 Days. Click to get this free report
 
First Trust United Kingdom AlphaDEX ETF (FKU): ETF Research Reports
 
iShares MSCI Poland ETF (EPOL): ETF Research Reports
 
WisdomTree Europe Hedged SmallCap Equity ETF (EUSC): ETF Research Reports
 
WisdomTree Europe SmallCap Dividend ETF (DFE): ETF Research Reports
 
iShares MSCI Austria ETF (EWO): ETF Research Reports
 
To read this article on Zacks.com click here.
 
Zacks Investment Research

https://www.entrepreneur.com/article/384426


Guide to the Nasdaq ETF Investing

The Nasdaq Composite Index has been hitting a series of record highs since the start of the pandemic. In fact, the tech-heavy index topped 15,000 for the first-time last month. The year 2020 can be fully attributed to the Nasdaq. Though the tech-heavy Nasdaq was out of favor in the beginning of 2021 on rising rate worries, it regained momentum lately.

– Zacks

Inside the Strength of Nasdaq

There are more than 3300 stocks in the Nasdaq Composite. In terms of securities, healthcare has the maximum stocks of 986 followed by financials (824), industrials (313) and technology (397). The index puts 47.97% weight in the Information Technology sector, followed by Consumer Discretionary (20.28%), Healthcare (10.31%), Industrials (6.33%) and Telecommunications (4.39%). Hence, the Nasdaq’s performance is heavily- dependent on the tech sector.

Nasdaq outdid others in the peak of the pandemic due to greater rallies in the technology sector or socially-distant stocks, and continues to outperform even after the reopening of economies. While rates are rising, Fed taper talks eased a bit lately.

Presently, the U.S. central bank is purchasing $80 billion of Treasuries and $40 billion of mortgage-backed securities each month, while benchmark interest rates are between 0% and 0.25%. Continuation of such a policy is making the tech stocks stronger.

Investors should note that decade-long cheap money inflows and global economic improvement (before the virus outbreak) made growth stocks and the tech-heavy ETF winners last decade. Rising consumer spending on technology, a 5G boom, expectations of higher smartphone sales, the announcement of the phase-one U.S.-China trade deal and coronavirus-induced social distancing propelled the tech and semiconductor space.

Performance of Nasdaq Through the Past Decade

Since 2012, the Nasdaq offered double-digit annual return in seven years with 2020 bringing about the highest of 43.64%. Worst performance of the Nasdaq was recorded in 2018 with losses of 3.88%. The year 2015 and 2016 recorded single-digit gains of 5.73% and 7.50%, respectively. If we look at this year’s performance, the second quarter offered 9.49% gains in the Nasdaq and the first quarter offered 2.78% gains for the Nasdaq.

Moreover, the latest bouts of data indicate that the economy is recovering , though at a moderate pace. With expectations that the index will stay strong in the coming days, one can play the momentum with the below-mentioned ETFs.

ETFs in Focus

Invesco QQQ QQQ

This ETF provides exposure to the 103 largest domestic and international non-financial companies listed on the Nasdaq by tracking the Nasdaq-100 Index. QQQ is one of the largest and most popular ETFs in the large-cap space, with AUM of $196.6 billion. It charges investors 20 bps in annual fees.

Invesco NASDAQ 100 ETF QQQM

The underlying NASDAQ-100 Index includes securities of 100 of the largest domestic and international nonfinancial companies listed on Nasdaq. The fund charges 15 bps in fees. The fund has an AUM base of $1.83 billion.

First Trust NASDAQ-100 Equal Weighted Index Fund QQEW

Holding 102 stocks, this fund provides equal exposure to the stocks of the Nasdaq-100 Index. It has amassed $1.37 billion in its asset base. It charges 58 bps in annual fees.

Fidelity Nasdaq Composite Index Tracking Stock ONEQ

This ETF tracks the Nasdaq Composite Index, holding a broad basket of about 1000 stocks. It has AUM of $4.59 billion. The expense ratio comes is 0.21%.

ProShares Ultra QQQ QLD

Investors seeking to make big gains in a short span can bet on QLD. It provides twice the return of the NASDAQ-100 Index’s daily performance. The fund has AUM of $5.58 billion and charges 95 bps in fees and expenses.

ProShares UltraPro QQQ TQQQ

For a more bullish approach, TQQQ could be an excellent choice. It also tracks the NASDAQ-100 Index but offers thrice the returns of the daily performance, with the same expense ratio of QLD. The fund has managed AUM of $14.9 billion.

Zacks’ Top Picks to Cash in on Artificial Intelligence

This world-changing technology is projected to generate $100s of billions by 2025. From self-driving cars to consumer data analysis, people are relying on machines more than we ever have before. Now is the time to capitalize on the 4th Industrial Revolution. Zacks’ urgent special report reveals 6 AI picks investors need to know about today.

See 6 Artificial Intelligence Stocks With Extreme Upside Potential>>

Want the latest recommendations from Zacks Investment Research? Today, you can download 7 Best Stocks for the Next 30 Days. Click to get this free report
 
Invesco QQQ (QQQ): ETF Research Reports
 
ProShares Ultra QQQ (QLD): ETF Research Reports
 
ProShares UltraPro QQQ (TQQQ): ETF Research Reports
 
Fidelity Nasdaq Composite Index ETF (ONEQ): ETF Research Reports
 
First Trust NASDAQ100 Equal Weighted ETF (QQEW): ETF Research Reports
 
Invesco NASDAQ 100 ETF (QQQM): ETF Research Reports
 
To read this article on Zacks.com click here.

https://www.entrepreneur.com/article/384425


3 Reasons Why Growth Investors Shouldn’t Overlook Vectrus (VEC)

Investors seek growth stocks to capitalize on above-average growth in financials that help these securities grab the market’s attention and produce exceptional returns. But finding a great growth stock is not easy at all.

– Zacks

That’s because, these stocks usually carry above-average risk and volatility. In fact, betting on a stock for which the growth story is actually over or nearing its end could lead to significant loss.

However, the Zacks Growth Style Score (part of the Zacks Style Scores system), which looks beyond the traditional growth attributes to analyze a company’s real growth prospects, makes it pretty easy to find cutting-edge growth stocks.

Vectrus (VEC) is one such stock that our proprietary system currently recommends. The company not only has a favorable Growth Score, but also carries a top Zacks Rank.

Research shows that stocks carrying the best growth features consistently beat the market. And for stocks that have a combination of a Growth Score of A or B and a Zacks Rank #1 (Strong Buy) or 2 (Buy), returns are even better.

Here are three of the most important factors that make the stock of this government services company a great growth pick right now.

Earnings Growth

Earnings growth is arguably the most important factor, as stocks exhibiting exceptionally surging profit levels tend to attract the attention of most investors. And for growth investors, double-digit earnings growth is definitely preferable, and often an indication of strong prospects (and stock price gains) for the company under consideration.

While the historical EPS growth rate for Vectrus is 18.5%, investors should actually focus on the projected growth. The company’s EPS is expected to grow 57.6% this year, crushing the industry average, which calls for EPS growth of 34.2%.

Cash Flow Growth

While cash is the lifeblood of any business, higher-than-average cash flow growth is more important and beneficial for growth-oriented companies than for mature companies. That’s because, growth in cash flow enables these companies to expand their businesses without depending on expensive outside funds.

Right now, year-over-year cash flow growth for Vectrus is 1%, which is higher than many of its peers. In fact, the rate compares to the industry average of -0.2%.

While investors should actually consider the current cash flow growth, it’s worth taking a look at the historical rate too for putting the current reading into proper perspective. The company’s annualized cash flow growth rate has been 9.4% over the past 3-5 years versus the industry average of 3.6%.

Promising Earnings Estimate Revisions

Superiority of a stock in terms of the metrics outlined above can be further validated by looking at the trend in earnings estimate revisions. A positive trend is of course favorable here. Empirical research shows that there is a strong correlation between trends in earnings estimate revisions and near-term stock price movements.

There have been upward revisions in current-year earnings estimates for Vectrus. The Zacks Consensus Estimate for the current year has surged 4% over the past month.

Bottom Line

Vectrus has not only earned a Growth Score of A based on a number of factors, including the ones discussed above, but it also carries a Zacks Rank #2 because of the positive earnings estimate revisions.

You can see the complete list of today’s Zacks #1 Rank (Strong Buy) stocks here.

This combination positions Vectrus well for outperformance, so growth investors may want to bet on it.

Zacks’ Top Picks to Cash in on Artificial Intelligence

This world-changing technology is projected to generate $100s of billions by 2025. From self-driving cars to consumer data analysis, people are relying on machines more than we ever have before. Now is the time to capitalize on the 4th Industrial Revolution. Zacks’ urgent special report reveals 6 AI picks investors need to know about today.

See 6 Artificial Intelligence Stocks With Extreme Upside Potential>>

Want the latest recommendations from Zacks Investment Research? Today, you can download 7 Best Stocks for the Next 30 Days. Click to get this free report
 
Vectrus, Inc. (VEC): Free Stock Analysis Report
 
To read this article on Zacks.com click here.

https://www.entrepreneur.com/article/384393


5 Penny Stocks To Buy That Turned $2,500 Into Over $21,000 In 2021

September 7, 2021 10 min read

This story originally appeared on PennyStocks

Top Penny Stocks That Scored Big This Year

One thing that we can say about the last 21 months is that penny stocks are getting their time in the spotlight. Thanks to the pandemic’s onset, the market’s downturn, and the thirst for volatility from retail readers, these cheap stocks are some of the most sought-after. Why? One of the reasons has to do with the upside that penny stocks offer.

The other is more related to the fact that so many “leading companies” fell to the depth of sub $5 levels, which inherently introduced an entirely new crowd to this world of cheap stocks. Whether you’re talking about some of the vaccine stocks that skyrocketed over the last year or companies like GameStop (NYSE:GME) or Nio Inc. (NYSE:NIO), which clawed back from big breakdowns in share price, the result has been the same. Traders are hungry for more.

What Are Penny Stocks?

Before we get into this list of penny stocks, I understand that this may still be a new phenomenon to some readers. So let’s define a few things first. Penny stocks are shares of companies trading for less than $5. That’s according to the Securities and Exchange Commission’s definition. Some traders will have their own idea of what these cheap stocks are. But, for this article, we’ll use this as the threshold.

Read more: Best Penny Stocks to Buy This Month? 3 To Watch in September 2021

Next, it’s important to understand that these are very risky stocks to trade. Not all penny stocks will go on to run hundreds or thousands of percentage points. In fact, many will do the exact opposite, with some companies failing entirely. But that doesn’t mean these aren’t worth it. Just understand that volatility requires attention and an understanding of how to trade properly. For those that had a handle on this, the last 9 months have been some of the best for these penny stocks. In fact, as you’ll see, in some cases, even $500 could’ve turned into nearly $10,000 during that time. So let’s take a look at some of the best penny stocks in 2021 so far.

Best Penny Stocks To Buy 2021?

Some of the best penny stocks to buy this year have been “meme stocks.” These companies have grown in popularity among retail traders and have become the focus for meme-makers on popular social media outlets like Reddit, Twitter, and Facebook. Regardless of their name, these stocks have a few things going for them. These few things are a source of both risk and reward.

The biggest driving force is the massive audience chatting and posting about these stocks. While some of these were big winners so far this year, the choice some traders are grappling with is whether or not these are still the best stocks to buy right now. That’s something I’ll leave up to you to decide.

Best Penny Stocks In 2021 #1: Ferroglobe Plc (NASDAQ:GSM)

One of the hot trends in the stock market has been clean energy. That’s also wrapped in the growing market for electric vehicles, renewable energy, and the like. With that, the entire supply chain has come into focus. Ferroglobe Plc (NASDAQ:GSM) provides silicon metal and specialty alloys for customers across numerous markets. These include solar, automotive, consumer product, construction, and energy.

With the growing demand for things encompassing all of these niches, it makes sense that the company has experienced a banner year so far. In fact, just a few days ago, GSM stock reached fresh 52-week highs. That came following the company’s latest round of earnings. These not only showed significant earnings per share growth, year over year, the company also reported strong sales growth. Marco Levi, Ferroglobe’s Chief Executive Officer, commented, “The second-quarter results reflect a strong improvement in our overall performance and marks the return to profitability, an important goal for this year…As we look towards the back half of the year, we will keep the momentum going on all fronts to capitalize on the market opportunities and successfully execute some critical initiatives underpinning the strategic plan.”

The GSM stock price at the beginning of 2021 was $1.68. This week shares reached early highs of $10.06, signaling a year-to-date move of 499%. Hypothetically speaking, that means a $500 position at the start of the year is now worth nearly $2,500.

Download: GSM Stock Report

best penny stocks to buy 2021 Ferroglobe GSM stock chart

2. Moxian Inc. (NASDAQ:MOXC)

Next on this list of former penny stocks, Moxian Inc. (NASDAQ:MOXC) has experienced a strong move of its own this year. The start of 2021 saw shares of MOXC stock trading at$1.36 on January 4th. This week, the former penny stock hit a high of $7.65. The crazy part is that this isn’t the highest the stock has been this year. Earlier this quarter, shares reached highs of $31.38. Needless to say, even with the pullback, a $500 position at the beginning of the year is worth over $2,300 at this point.

So what’s been a source for MOXC stock’s massive rally? There haven’t been many headlines coming from the company over the last 9 months. It recently completed a reorganization, but details weren’t more than stating its new “home” in the British Virgin Islands. However, thanks to interest stemming from low float stocks as well as “the reopening trade,” Moxian has been at the center of attention throughout the year.

The company’s offerings focus on targeted advertising campaigns and promotions to attract potential customers for their clients. As reopening trends have taken hold, so have different forms of marketing and awareness. Moxian’s digital advertising suite serves content across myriad platforms. These include mobile phones and smart TVs.

Download: MOXC Stock Report

best penny stocks to buy 2021 Mixian Inc. MOXCstock chart

3. Vinco Ventures (NASDAQ:BBIG)

One of the more recent meme stocks making its presence known is Vinco Ventures (NASDAQ:BBIG). Attention began focusing on the company thanks to a pending merger and proposed acquisition of a TikTok competitor in Asia, Lomotif. In Vinco’s recent quarterly update, the company said that it achieved a record number of Monthly Active Users (MAUs) with over 30 million MAUs, according to Data Analysis Firm Sensor Tower. The company also recently launched recording Artist Tory Lanez album “When It’s Dark” on the E-NFT .com platform. “When It’s Dark” is the first album to go platinum on the blockchain with over 1,000,000 units sold.

Read more: 3 Hot Penny Stocks To Watch For September 2021

Aside from the business side of things, Vinco has also become the focus of retail traders thanks to higher levels of short interest in BBIG and traders looking for potential “short squeeze stocks” to watch. If you look at the last few weeks of trading, you’ll see that BBIG stock has experienced a strong move higher as the “short squeeze” trend has taken hold.

Since the start of the year, BBIG has managed to run from $1.38 on January 4th to highs this week of $8.41 so far. That means the hypothetical $500 position we keep referencing would be worth over $2,500 at this point.

Download: BBIG Stock Report

best penny stocks to buy 2021 Vinco Ventures BBIG stock chart

4. Peabody Energy (NYSE:BTU)

If you’ve been a reader of PennyStocks.com, you’ll likely remember Peabody Energy (NYSE:BTU) from late last year. At the time, shares of BTU stock weren’t trading nearly as high as they are now. In fact, if you look back at the start of the year, Peabody’s shares began the year at $2.46. Fast-forward to this week, and we’re now looking at fresh 52-week highs of $18.77. That means the $500 position at the beginning of the year would be worth roughly $3,300 right now.

Peabody is an energy company. But instead of renewables, solar, nuclear power, or other popular niches, the company produces coal. While this may be seen as “dirty energy,” Peabody has tasked itself with providing fuel baseload electricity for emerging and developing countries while also creating steel to build foundational infrastructure.

Growth over the past quarter (Q2) has helped boost sentiment in the stock. It has also become justification for analysts to grow bullish. B. Riley raised its price target for the stock 2 times within the same 30-day period. As of right now, that sits at $15, up from $11 in August and $7 previous to that.

Download: BTU Stock Report

best penny stocks to buy 2021 Peabody Energy BTU stock chart

5. AMC Entertainment (NYSE:AMC)

This year, no other penny stock seems to epitomize the rise of the retail trader better than AMC Entertainment (NYSE:AMC). As one of the original “meme stocks,” shares of AMC started 2021 trading at $2.20 a share. While it went on to see an explosive move to highs of $72.62, the former penny stock is sitting around $47 to start this week. Despite that pullback, the movie theater company’s shares are still up nearly 2,100% year-to-date. That means a $500 position at the start of the year would be worth over $10,300.

Aside from this being in the “reopening” category, AMC has grown a cult following. Those staunchly believing in its potential to rise to levels never seen by the stock have helped fuel momentum for months. What’s more, the company has begun gaining ground thanks to moviegoers coming back to theatres.

Read more: Best Penny Stocks To Buy Under $1 Right Now? 5 To Watch In September

The holiday weekend saw Labor Day Admissions revenue hit new records. According to the company, more than 2 million people watched movies at AMC’s U.S. theatres from September 2nd through the 5th. Roughly 800,000 also visited AMC’s international theatres in Europe and the Middle East. AMC shares surged to start the new week thanks to this mix of fundamental optimism and retail-driven momentum.

Download: AMC Stock Report

best penny stocks to buy 2021 AMC Entertainment AMC stock chart

Are Penny Stocks Worth It?

Clearly, penny stocks are worth it if you know what to look for. This article discussed how just 5 companies performed on a year-to-date basis starting on January 4th, 2021. Compared to early morning highs on September 7th, 2021, these have all experience massive jumps in just 9 months and a few days. In this hypothetical example, using a total of $2,500 spread across all 5 penny stocks at the start of 2021, that would now be more than $21,000 as of morning highs on September 7.

Though all penny stocks don’t go on to perform like these, there are more than a handful of names that see double and even triple-digit moves daily. Some may only run for that single session while other moves go on for months at a time. The important part for you is to know how to trade and profit from what the market gives.

https://www.entrepreneur.com/article/384109



The TJX Companies (TJX) Up More Than 25% in a Year: Here’s Why

The TJX Companies’ (TJX) HomeGoods segment is seeing robust demand. The company is also benefiting from its solid store and e-commerce growth efforts.

September 6, 2021 4 min read

This story originally appeared on Zacks

The TJX Companies, Inc. TJX is in a robust shape, courtesy of strength in the HomeGoods segment. The company is undertaking initiatives to enhance its offline and online businesses. Its marketing strategies are noteworthy. These trends were reflected in its second-quarter fiscal 2022 results, with earnings and net sales rising year over year as well as beating the Zacks Consensus Estimate.

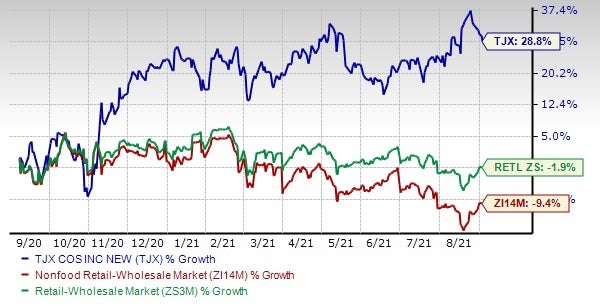
The Zacks Rank #1 (Strong Buy) stock has rallied 28.8% in the past year against the industry’s decline of 9.4%. Meanwhile, the Zacks Retail and Wholesale sector encountered a drop of 1.9% in the same time period.

Let’s delve deeper.

Zacks Investment Research
Image Source: Zacks Investment Research

HomeGoods Category Fuels Growth

The TJX Companies’ HomeGoods segment is seeing robust demand for a while. Owing to store closures amid the pandemic, management came up with a temporary new sales measure — open-only comp store sales — to offer a better view. During the fiscal second quarter, open-only comp store sales surged 36% in the HomeGoods (U.S.) segment from fiscal 2020’s level. The upside can be attributed to solid growth in every major category as well as geographic region for HomeGoods and Home Sense. The TJX Companies is on track to roll out homegoods.com during the fiscal third quarter. With this launch, the company expects to offer impressive home fashion products at great value on its digital platform.

What Else is Driving Growth?

The TJX Companies’ is benefiting from its solid store and e-commerce growth efforts. It regularly opens stores and is expanding rapidly across the United States, Europe, Canada and Australia. The TJX Companies opened 26 new stores, taking the total count to 4,665 during second-quarter fiscal 2022. The company expanded its square footage by 0.5% from the previous quarter’s levels.

With an increasing number of consumers resorting to online shopping, The TJX Companies has undertaken several initiatives to boost online sales and strengthen its e-commerce business. In the second-quarter earnings call, management highlighted that it is seeing impressive sales for the U.S. and U.K. online businesses. The company’s off-price model along with its strategic store locations, impressive brands and fashion products are likely to drive its performance, in stores and online.

The TJX Companies remains committed toward boosting growth through effective marketing initiatives and loyalty programs. Its aggressive marketing and advertising campaigns through multiple mediums have been contributing to growth. In its last earnings call, management highlighted that it is on track to roll out effective marketing campaigns across television and digital media for the fall and holiday season. Also, the company’s treasure hunt shopping experience is gaining traction among shoppers. The TJX Companies’ gift-giving initiatives, unique among off-price retailers and loyalty card program (which offers consumers a non-credit card choice and soft benefits such as early shopping hours) have been helpful in improving customer engagement.

We believe that the above-mentioned upsides are likely to keep working for The TJX Companies.

Other Solid Retail Picks

Costco Wholesale Corporation COST, which currently carries a Zacks Rank #2 (Buy), has a long-term earnings growth rate of 9.1%. You can see the complete list of today’s Zacks #1 Rank stocks here.

Macy’s, Inc. M,which currently sports a Zacks Rank #1, has a long-term earnings growth rate of 12%.

Kohl’s Corporation KSS, which currently sports a Zacks Rank #1, has a long-term earnings growth rate of 8%.

5 Stocks Set to Double

Each was handpicked by a Zacks expert as the #1 favorite stock to gain +100% or more in 2021. Previous recommendations have soared +143.0%, +175.9%, +498.3% and +673.0%.

Most of the stocks in this report are flying under Wall Street radar, which provides a great opportunity to get in on the ground floor.

Today, See These 5 Potential Home Runs >>

Want the latest recommendations from Zacks Investment Research? Today, you can download 7 Best Stocks for the Next 30 Days. Click to get this free report
 
Macys, Inc. (M): Free Stock Analysis Report
 
The TJX Companies, Inc. (TJX): Free Stock Analysis Report
 
Kohls Corporation (KSS): Free Stock Analysis Report
 
Costco Wholesale Corporation (COST): Free Stock Analysis Report
 
To read this article on Zacks.com click here.
 
Zacks Investment Research

https://www.entrepreneur.com/article/383844


Lockheed (LMT) Wins $205M Deal to Aid the MH-60R Program

Lockheed (LMT) is set to provide non-recurring engineering for the Phase II design and development of unique hardware and software for the MH-60R prog…

September 6, 2021 4 min read

This story originally appeared on Zacks

Lockheed Martin Corp. LMT recently clinched a modification contract of the MH-60R development program to support India’s government. The Naval Air Systems Command, Patuxent River, MD awarded the deal.

Details of the Deal

Valued at $208.1 million, the contract is projected to be completed in September 2027. Per the terms, Lockheed will provide non-recurring engineering for the Phase II design and development of unique hardware and software for the MH-60R program.

The majority of the work related to this deal will be carried out in Owego, NY.

Significance of MH-60R Aircraft

The MH-60R Seahawk helicopter is the world’s most advanced maritime helicopter designed to operate from frigates, destroyers, cruisers, and aircraft carriers. It is equipped for a range of missions, including anti-submarine warfare, anti-surface warfare, search-and-rescue, naval gunfire support, surveillance, logistics support, personnel transfer, and vertical replenishment.

Currently, it is operational and deployed with the U.S. Navy as the primary anti-submarine warfare and anti-surface weapon system for Open Ocean and littoral zones.

Sikorsky’s Place in Combat Helicopter space

Factors like advancements and integration of new tactical and logistical features along with the inclusion of improved radar systems and the availability of advanced system engineering services have boosted demand for military helicopters these days. With Lockheed Martin, being a prominent helicopter manufacturer, its Sikorsky unit remains in the spotlight whenever the prospects of the combat helicopter market are discussed.  

To this end, it is imperative to mention that Lockheed’s Sikorsky unit provides military and rotary-wing aircraft to all five branches of the U.S. armed forces along with military services and commercial operators in 40 nations. In the fiscal 2022 defense budget, a $3.5 billion fund has been allotted for Sikorsky’s helicopter, which should usher in a solid inflow of contracts for its varied combat-proven copters, the latest contract win being a bright example of that.

Such contract wins for Sikorsky’s helicopters tend to boost the top-line performance of Lockheed’s Rotary and Missions Systems (RMS) business division, which encompasses the Sikorsky business line. On its second-quarter 2021 earnings call, Lockheed raised its sales outlook for the RMS unit by $150 million, primarily driven by the volume at Sikorsky.

What Lies Ahead?

The global attack helicopter market is estimated to witness a CAGR of more than 4% during the 2020-2025 period, per the latest forecast made by market research firm, Mordor Intelligence. This indicates solid growth opportunities for helicopter makers like Lockheed Martin.

A few other prominent players in the aforementioned market like Boeing BA, Airbus EADSY, and Textron TXT are also expected to benefit.

Price Movement

Lockheed Martin’s stock has gained 4.3% in the past six months against the industry’s decline of 6.9%.

Zacks Investment Research
Image Source: Zacks Investment Research

Zacks Rank

Lockheed Martin currently carries a Zacks Rank #3 (Hold). You can see the complete list of today’s Zacks #1 Rank (Strong Buy) stocks here.

5 Stocks Set to Double

Each was handpicked by a Zacks expert as the #1 favorite stock to gain +100% or more in 2021. Previous recommendations have soared +143.0%, +175.9%, +498.3% and +673.0%.

Most of the stocks in this report are flying under Wall Street radar, which provides a great opportunity to get in on the ground floor.

Today, See These 5 Potential Home Runs >>

Want the latest recommendations from Zacks Investment Research? Today, you can download 7 Best Stocks for the Next 30 Days. Click to get this free report
 
The Boeing Company (BA): Free Stock Analysis Report
 
Lockheed Martin Corporation (LMT): Free Stock Analysis Report
 
Textron Inc. (TXT): Free Stock Analysis Report
 
Airbus Group (EADSY): Free Stock Analysis Report
 
To read this article on Zacks.com click here.

https://www.entrepreneur.com/article/383845


Will ETFs Gain on Upbeat US Manufacturing Data for August?

September 5, 2021 5 min read

This story originally appeared on Zacks

The latest ISM Manufacturing Purchasing Managers’ Index (PMI) data for the United States is painting a rosy picture for the industrial sector. The metric rose to 59.9 in August from 59.5 in July and surpassed forecasts of 58.6, per a Reuters article. Any reading above 50% indicates expansion in U.S. manufacturing activities. Notably, the manufacturing sector, which makes up 11.9% of the U.S. economy, saw the reading witnessing the 15th consecutive month of growth.The six biggest manufacturing industries — Computer & Electronic Products, Fabricated Metal Products, Chemical Products, Food, Beverage & Tobacco Products, Transportation Equipment, and Petroleum & Coal Products — delivered moderate to strong growth in August.

The New Orders Index climbed to 66.7%, up 1.8 percentage points from the July reading of 64.9%. The Production Index recorded at 60% rose 1.6 percentage points from the July reading. The Backlog of Orders Index touched 68.2%, 3.2 percentage points higher sequentially. However, the Supplier Deliveries Index reading was 69.5%, decreasing 3 percentage points from the July figure.

How is U.S. Economy Presently Placed?

U.S. consumers seem worried about the sustainability of economic recovery from the pandemic-led slump, surging delta variant threat and increasing inflation levels. Consequently, the consumer confidence in the United States slipped to a six-month low in August. The Conference Board’s measure of consumer confidence index stands at 113.8 (the lowest level since February), comparing unfavorably with July’s reading of 125.1.

The virus variant remains a serious concern as the number of cases is rising in the United States. The new cases arising from the delta variant are being mostly observed among the unvaccinated population. Going by Johns Hopkins University data, the United States is witnessing an average of 160,000 new COVID-19 cases a day, per a CNN report.

The resurging cases might scare investors as they worry about implementation of new lockdown measures to control the spread, which may hurt the global economic recovery achieved so far.

The increasing concerns about the surging coronavirus cases due to the delta variant continue to dampen U.S. consumer sentiments. The metric surprisingly slid to a pandemic-era low level in early August when compared to a reading of 70.8 recorded in April 2020. The University of Michigan’s preliminary consumer sentiment index fell to 70.2 in August from 81.2 last month. The reading was the lowest since December 2011 as Americans seem to be sceptical about things like personal finances, inflation and employment.

Meanwhile, Wall Street has impressed investors with an attractive rally in the three broader indices in August. The second-quarter earnings season saw better-than-expected results, stimulating the rally in stock markets. According to a CNBC article, the S&P 500 is on track to witness the largest increase since fourth-quarter 2009 by posting an earnings growth rate of 95.4%.

The FDA granting the first full U.S. approval to Pfizer (PFE)/BioNTech’s (BNTX) coronavirus vaccine, Comirnaty (BNT162b), has also boosted investors’ confidence.

The full FDA approval is expected to increase the confidence for imposing vaccine mandates. Also, the unvaccinated population is now more likely to opt for vaccinations. According to a CNBC article, the Kaiser Family Foundation survey reflected that three in 10 unvaccinated adults were more likely to get jabbed if one of the vaccines received full approval. The market participants are also upbeat about the chances of peaking delta variant cases.

Investors are also relieved about the Fed’s intention to not hike interest rates in the near term. Also, Fed Chairman Jerome Powell seems to have prepared the market for tapering its $120 billion in monthly bond purchases this year.

Industrial ETFs in Focus

In the current scenario, we believe it is prudent to discuss ETFs might gain on improving manufacturing data:

The Industrial Select Sector SPDR Fund XLI

The fund seeks to provide investment results that, before expenses, match the performance of the Industrial Select Sector Index. Its AUM is $19.20 billion and expense ratio is 0.12% (read: How Are Industrial ETFs Reacting to Q2 Earnings?).

Vanguard Industrials ETF VIS                   

This fund offers exposure to the industrial sector and follows the MSCI US Investable Market Industrials 25/50 Index. Its AUM is $5.44 billion and expense ratio is 0.10% (read: ETFs to Rise on Full FDA Approval for Pfizer COVID-19 Vaccine).

Fidelity MSCI Industrials Index ETF FIDU

The Fidelity MSCI Industrials Index ETF seeks to provide investment returns that match, before fees and expenses, the performance of the MSCI USA IMI Industrials Index. Its AUM is $873.4 million and expense ratio, 0.08% (read: ETFs to Gain as US Industrial Output Rises in July).

iShares U.S. Industrials ETF IYJ

The iShares U.S. Industrials ETF seeks to track the investment results of the Dow Jones U.S. Industrials Index. Its AUM is $1.79 billion and expense ratio is 0.41% as stated in the prospectus.

Zacks Names “Single Best Pick to Double”

From thousands of stocks, 5 Zacks experts each have chosen their favorite to skyrocket +100% or more in months to come. From those 5, Director of Research Sheraz Mian hand-picks one to have the most explosive upside of all.

You know this company from its past glory days, but few would expect that it’s poised for a monster turnaround. Fresh from a successful repositioning and flush with A-list celeb endorsements, it could rival or surpass other recent Zacks’ Stocks Set to Double like Boston Beer Company which shot up +143.0% in a little more than 9 months and Nvidia which boomed +175.9% in one year.

Free: See Our Top Stock and 4 Runners Up >>

Want the latest recommendations from Zacks Investment Research? Today, you can download 7 Best Stocks for the Next 30 Days. Click to get this free report
 
Vanguard Industrials ETF (VIS): ETF Research Reports
 
Industrial Select Sector SPDR ETF (XLI): ETF Research Reports
 
iShares U.S. Industrials ETF (IYJ): ETF Research Reports
 
Fidelity MSCI Industrials Index ETF (FIDU): ETF Research Reports
 
To read this article on Zacks.com click here.
 
Zacks Investment Research

https://www.entrepreneur.com/article/383769


Weak Jobs Report Sends Mixed Signals

September 4, 2021 6 min read

This story originally appeared on Zacks

Dan Laboe here, Editor of the Headline Trader, covering for Jim the Whiz Giaquinto, who should be back in action on Tuesday after Labor Day.

The public equity markets were quiet going into this long holiday weekend, as the irony of a bad jobs report on the eve of Labor Day weekend reverberated in investors’ indecision today. The low volumes and muted price action on what should have been a market-moving morning of data (nonfarm payroll Friday) lead me to believe that bigshot (equity-focused) money managers are already on their yachts. On the other hand, fixed-income activity was vibrant as bond investors moved on the inflationary implications of one of this morning’s employment figures.

The only sector that saw any growth today was technology with mega-cap tech and semiconductors powering the Nasdaq 100 up over 30 basis points for another record close. This tech-focused rally kept the S&P 500 buoyant, with the trillion-dollar club (AAPL, MSFT, AMZN, GOOGL, & FB) now making up over 20% of this index, closing the session just a couple basis points below even. The Dow Jones traded two-tenth of a percent lower. This economically sensitive index has moved effectively sideways for nearly a month now, as the Delta-dent weighs on its performance.

As I mentioned yesterday, inflows into nothing but mega-cap tech is an indication of indecision. This cohort’s boundless liquidity, decades of proven outperformance, and endless profitable growth make it a perfect place to park your coin when you don’t know what else to do with it.

The August Jobs Report

The Delta-dent showed its colors in this morning’s disappointing (to say the least) August jobs report. The US economy only added 235,000 new jobs this past month (the slowest monthly jobs improvement since January), missing economists’ 720,000 consensus estimate by a mile. At the same time, the unemployment rate dropped to a post-pandemic low of 5.2%, a material improvement from July’s 5.4% and January’s 6.3%.

There was also a sizable uptick in average hourly earnings this past month, demonstrating a 0.6% jump from July (the largest monthly increase since this gauge was established) and a 2.2% increase from pre-pandemic levels. The accelerating wage expansion that we’ve seen since March is a sign of sticky inflation and had bond traders selling longer-dated assets on the notion that the Fed may have to initiate liftoff (rate hikes) sooner than they think to control prices.

The August jobs report sent the bond market into a frenzy with the US 10-Year yield drop off a 2.5% wall in the first 30 seconds of the headline number’s release only to slingshot 5% higher in the 30 minutes that followed. T-Bill traders had some initial confusion on how to react with mixed feelings about the Fed’s monetary plan moving forward.

The report almost certainly pushed the timeline for an asset taper announcement from the Fed past the upcoming September meeting and likely to the November meeting. The Fed’s $120 billion asset purchase program will still likely begin paring before the year is up. On the other hand, the timeline to liftoff was just pushed up on the accelerating growth of hourly wages, something that Chair Powell has stated explicitly as a concern.

These implications had a steepening effect on the yield curve with all T-bills with a less than 2-year maturity seeing yields fall on the notion of a delayed taper, and treasuries with maturities of 2 years or longer all saw yield spikes on inflation concerns related to wages.

The Headline Jobs Data May Not Be That Concerning

Hiring took a summer holiday with the latest wave of the COVID-variant significantly slowing the jobs market. Leisure & hospitality, construction, government schools, and retail all weighed on August’s employment data. Reinstated COVID restrictions and an overheated housing boom catalyzed 0 net new jobs in leisure & hospitality and net employment declines in construction, government schools, and retail (which was by far the biggest laggard). Still, employers are somehow struggling to fill positions.

This unexpectedly large deceleration in August may not be as concerning as the headlines lead you to believe. Nearly 12 million people who have recently been relying on the government’s COVID support will no longer receive the additional unemployment benefits after this long holiday weekend. This change in fiscal policy will leave 7.5 million people receiving aid under the qualification of long-term unemployed, self-employed, gig workers, freelancers, and anyone else who would usually be ineligible for state benefits, with nothing to lean on after September 6th. 

This should inspire a flood of job seekers looking to get back into the workforce and push the health of our jobs market towards the “substantial further progress” that the Fed is looking for to give its tapering announcement the nod.

Portfolio Highlights:

The Surprise Trader: Ahead of this long weekend, Dave saw a pre-earnings opportunity in Restoration Hardware (RH) and added it to the portfolio with a 12.5% allocation. RH is a Zacks Rank #3, but Dave sees an upside surprise opportunity going into this company’s earnings next week (after the bell Wednesday, September 8th). RH hasn’t missed on earnings for as far back as we can see and has seen significant upside price action following its past three reports. Analysts’ Consensus EPS estimate sits at $6.58, but Dave sees a high probability chance of a sizable beat following its previous quarter’s earnings which came in 16.4% above expectations. 

Counterstrike: TJX (TJX), owner of TJ Maxx, Marshalls, HomeGoods, Sierra, and Homesense, revealed an outstanding July quarter that blew past analysts’ expectations, driving this stock into a Zacks Rank #1 (Strong Buy). TJX saw a 10% rally in the week that followed its report last month but lost some momentum after hitting overbought RSI levels in the past week. Jeremy sees an opportunity to jump into this leading off-price retailer as it comes down to a Fibonacci-derived support level around $71.50. Jeremy is looking for an $82 target or nearly 15% upside from where it is trading today.

Blockchain Innovator: Dave pulled profits on Air Transport Services (ATSG) for an over 35% gain in just over four months, outperforming the S&P 500 by 28%. This sale was triggered by the stock’s inability to get past the high $20s, where it continued to see resistance. 

Have a great long weekend!

Dan

Recommendations from Zacks’ Private Portfolios:

Believe it or not, this article is not available on the Zacks.com website. The commentary is a partial overview of the daily activity from Zacks’ private recommendation services. If you would like to follow our Buy and Sell signals in real time, we’ve made a special arrangement for readers of this website. Starting today you can see all the recommendations from all of Zacks’ portfolios absolutely free for 7 days. Our services cover everything from value stocks and momentum trades to insider buying and positive earnings surprises (which we’ve predicted with an astonishing 80%+ accuracy). Click here to “test drive” Zacks Ultimate for FREE >>

 
Zacks Investment Research

https://www.entrepreneur.com/article/383753


Union Pacific (UNP) Dips More Than Broader Markets: What You Should Know

In the latest trading session, Union Pacific (UNP) closed at $214.91, marking a -1.2% move from the previous day.

September 3, 2021 3 min read

This story originally appeared on Zacks

Union Pacific (UNP) closed the most recent trading day at $214.91, moving -1.2% from the previous trading session. This move lagged the S&P 500’s daily loss of 0.03%.

Heading into today, shares of the railroad had lost 0.74% over the past month, lagging the Transportation sector’s gain of 4.41% and the S&P 500’s gain of 3.59% in that time.

Wall Street will be looking for positivity from UNP as it approaches its next earnings report date. The company is expected to report EPS of $2.60, up 29.35% from the prior-year quarter. Our most recent consensus estimate is calling for quarterly revenue of $5.53 billion, up 12.47% from the year-ago period.

Looking at the full year, our Zacks Consensus Estimates suggest analysts are expecting earnings of $10.02 per share and revenue of $21.64 billion. These totals would mark changes of +22.34% and +10.79%, respectively, from last year.

Investors should also note any recent changes to analyst estimates for UNP. These revisions typically reflect the latest short-term business trends, which can change frequently. As a result, we can interpret positive estimate revisions as a good sign for the company’s business outlook.

Research indicates that these estimate revisions are directly correlated with near-term share price momentum. To benefit from this, we have developed the Zacks Rank, a proprietary model which takes these estimate changes into account and provides an actionable rating system.

The Zacks Rank system ranges from #1 (Strong Buy) to #5 (Strong Sell). It has a remarkable, outside-audited track record of success, with #1 stocks delivering an average annual return of +25% since 1988. Within the past 30 days, our consensus EPS projection remained stagnant. UNP is currently sporting a Zacks Rank of #2 (Buy).

Investors should also note UNP’s current valuation metrics, including its Forward P/E ratio of 21.71. This represents a discount compared to its industry’s average Forward P/E of 21.92.

Also, we should mention that UNP has a PEG ratio of 2.17. This metric is used similarly to the famous P/E ratio, but the PEG ratio also takes into account the stock’s expected earnings growth rate. The Transportation – Rail industry currently had an average PEG ratio of 2.17 as of yesterday’s close.

The Transportation – Rail industry is part of the Transportation sector. This industry currently has a Zacks Industry Rank of 219, which puts it in the bottom 14% of all 250+ industries.

The Zacks Industry Rank gauges the strength of our individual industry groups by measuring the average Zacks Rank of the individual stocks within the groups. Our research shows that the top 50% rated industries outperform the bottom half by a factor of 2 to 1.

Be sure to follow all of these stock-moving metrics, and many more, on Zacks.com.

Tech IPOs With Massive Profit Potential: Last years top IPOs surged as much as 299% within the first two months. With record amounts of cash flooding into IPOs and a record-setting stock market, this year could be even more lucrative. 

See Zacks’ Hottest Tech IPOs Now >>

Want the latest recommendations from Zacks Investment Research? Today, you can download 7 Best Stocks for the Next 30 Days. Click to get this free report
 
Union Pacific Corporation (UNP): Free Stock Analysis Report
 
To read this article on Zacks.com click here.

https://www.entrepreneur.com/article/383730


Ultra Clean Holdings (UCTT) Gains As Market Dips: What You Should Know

In the latest trading session, Ultra Clean Holdings (UCTT) closed at $46.72, marking a +0.34% move from the previous day.

September 3, 2021 3 min read

This story originally appeared on Zacks

Ultra Clean Holdings (UCTT) closed at $46.72 in the latest trading session, marking a +0.34% move from the prior day. The stock outpaced the S&P 500’s daily loss of 0.03%.

Coming into today, shares of the chipmaking equipment services company had lost 2.47% in the past month. In that same time, the Computer and Technology sector gained 4.91%, while the S&P 500 gained 3.59%.

UCTT will be looking to display strength as it nears its next earnings release. On that day, UCTT is projected to report earnings of $1 per share, which would represent year-over-year growth of 36.99%. Our most recent consensus estimate is calling for quarterly revenue of $543.97 million, up 49.74% from the year-ago period.

UCTT’s full-year Zacks Consensus Estimates are calling for earnings of $3.90 per share and revenue of $2.03 billion. These results would represent year-over-year changes of +39.29% and +44.92%, respectively.

It is also important to note the recent changes to analyst estimates for UCTT. Recent revisions tend to reflect the latest near-term business trends. As a result, we can interpret positive estimate revisions as a good sign for the company’s business outlook.

Based on our research, we believe these estimate revisions are directly related to near-team stock moves. To benefit from this, we have developed the Zacks Rank, a proprietary model which takes these estimate changes into account and provides an actionable rating system.

The Zacks Rank system ranges from #1 (Strong Buy) to #5 (Strong Sell). It has a remarkable, outside-audited track record of success, with #1 stocks delivering an average annual return of +25% since 1988. Over the past month, the Zacks Consensus EPS estimate has moved 0.75% higher. UCTT is holding a Zacks Rank of #3 (Hold) right now.

Looking at its valuation, UCTT is holding a Forward P/E ratio of 11.94. Its industry sports an average Forward P/E of 15.56, so we one might conclude that UCTT is trading at a discount comparatively.

Investors should also note that UCTT has a PEG ratio of 1.49 right now. This popular metric is similar to the widely-known P/E ratio, with the difference being that the PEG ratio also takes into account the company’s expected earnings growth rate. Electronics – Manufacturing Machinery stocks are, on average, holding a PEG ratio of 0.94 based on yesterday’s closing prices.

The Electronics – Manufacturing Machinery industry is part of the Computer and Technology sector. This industry currently has a Zacks Industry Rank of 48, which puts it in the top 19% of all 250+ industries.

The Zacks Industry Rank gauges the strength of our industry groups by measuring the average Zacks Rank of the individual stocks within the groups. Our research shows that the top 50% rated industries outperform the bottom half by a factor of 2 to 1.

To follow UCTT in the coming trading sessions, be sure to utilize Zacks.com.

Tech IPOs With Massive Profit Potential: Last years top IPOs surged as much as 299% within the first two months. With record amounts of cash flooding into IPOs and a record-setting stock market, this year could be even more lucrative. 

See Zacks’ Hottest Tech IPOs Now >>

Want the latest recommendations from Zacks Investment Research? Today, you can download 7 Best Stocks for the Next 30 Days. Click to get this free report
 
Ultra Clean Holdings, Inc. (UCTT): Free Stock Analysis Report
 
To read this article on Zacks.com click here.
 
Zacks Investment Research

https://www.entrepreneur.com/article/383731