Lucid Group Inc. (LCID) vs. Stellantis (STLA): Which Auto Stock Has Better Value?

Despite short-term macroeconomic uncertainties, the auto industry is poised for long-term growth, supported by the increasing demand for commercial and electric vehicles. While leading auto stocks Lucid Group (LCID) and Stellantis (STLA) should benefit, let us determine which auto stock has a better value.

In this piece, I have evaluated two auto stocks, Lucid Group, Inc. (LCID) and Netherlands-based Stellantis N.V. (STLA), to determine which could generate better returns. After thoroughly evaluating these stocks, I think that STLA represents a favorable investment opportunity with better value for the reasons discussed in this article.

With rising demand for both personal and commercial vehicles and an increasing consumer focus on safety and environmental concerns, the auto industry is well-positioned for robust growth in the foreseeable future.

Moreover, the adoption of robotics across the supply chain is also gaining momentum, leading to high levels of automation. This trend is driving the development of tools based on Artificial Intelligence (AI) to augment quality, speed, and the ability to meet consumer demands, thereby ensuring the industry remains competitive.

As a result, the global automotive market is expected to grow to $28.70 billion by 2030 at a CAGR of 4.5%.

STLA is a clear winner in terms of price performance, with 50.9% gains over the past nine months compared to LCID’s 36.5% decline. Moreover, STLA has gained 42% over the past year, while LCID has plunged 60.3%.

Here are the reasons why we think STLA could perform better in the near term:

Recent Developments

On June 26, 2023, LCID announced that it had entered into a definitive agreement to establish a long-term strategic technology partnership with Aston Martin to accelerate the iconic British brand’s high-performance electrification strategy and long-term growth.

Conversely, on June 27, 2023, STLA launched Free2move Charge, a 360-degree ecosystem that will seamlessly deliver charging and energy management to address all electric-vehicle (EV) customer needs, anywhere and in any way. Managed by the new Stellantis Charging & Energy Business Unit, Free2move Charge addresses electric-vehicle customers’ needs at home, at work, and on the go.

On June 26, STLA announced a strategic partnership with Utilimaster, a leading go-to-market brand of The Shyft Group’s Fleet Vehicles & Services business unit, as they expand their services into Mexico.

Recent Financial Results

During the fiscal year ended December 31, 2022, STLA’s net revenues increased 20.2% year-over-year to €179.59 billion ($197.04 billion). Its operating income rose 32.3% from the prior-year period to €20.01 billion ($21.95 billion). The company’s net profit increased 18.1% year-over-year to €16.78 billion ($18.41 billion). Also, its EPS came in at €5.31, representing an increase of 17.7% year-over-year.

On the contrary, LCID’s loss from operations increased 29.2% year-over-year to $772.16 million for the first quarter that ended March 31, 2023. Its net loss and net loss per share attributable to common stockholders rose 28.9% and 19.4% from the previous-year quarter to $779.53 million and $0.43, respectively.

Past And Expected Financial Performance

LCID’s revenue increased at a CAGR of 409.8% over the past three years. Its revenue is expected to increase 54.7% this year, 139.5% in the about-to-be-reported quarter ended June 2023, and 35.6% in the current quarter. However, its EPS is expected to fall 12% in the June 2023 ended quarter.

Conversely, over the past three years, STLA’s revenue grew at a 44.9% CAGR. Also, its EPS grew at a 39.6% CAGR during the same period. Analysts expect STLA’s revenue to rise 6.3% this year, 11.5% in the June 2023 ended quarter, and 26.2% in the current quarter. Its EPS is expected to grow by 2.8% in the next year.

Valuation

In terms of trailing-12-month P/S, STLA is currently trading at 0.28x, lower than LCID, which is trading at 17.99x. STLA’s trailing-12-month EV/Sales multiple of 0.28 is lower than LCID’s 17.32. Additionally, STLA’s trailing-12-month Price/Book ratio of 0.62x is lower than LCID’s 6.37x.

Thus, STLA is relatively more affordable.

Profitability

STLA is more profitable, with a trailing-12-month gross profit margin of 19.66% compared to LCID’s negative 171.54%. In addition, STLA’s trailing-12-month net income margin of 9.35% compares to LCID’s negative 286.13%.

Furthermore, STLA’s trailing-12-month ROCE, ROTC, and ROTA of 26.27%, 13.88%, and 9.02% compare to the LCID’s negative 53.68%, 28.57%, and 27.58%, respectively.

POWR Ratings

LCID has an overall rating of F, translating to a Strong Sell in our proprietary POWR Ratings system. Conversely, STLA has an overall rating of A, which equates to a Strong Buy. The POWR Ratings are calculated considering 118 different factors, with each factor weighted to an optimal degree.

Our proprietary rating system also evaluates each stock based on eight distinct categories. LCID has an F grade for Value. LCID’s forward EV/Sales and P/S multiples of 17.32 and 17.99 are significantly higher than the 1.16 and 0.85 industry averages.

On the other side, STLA has an A grade for Value. STLA’s forward EV/Sales and P/S multiples of 0.16 and 0.28 are 86% and 67.1% lower than the 1.16 and 0.85 industry averages.

Among the 55 stocks in the Auto & Vehicle Manufacturers industry, LCID is ranked last, while STLA is ranked #8.

Beyond what we’ve stated above, we have also rated both stocks for Growth, Momentum, Stability, Quality, and Sentiment. Click here to view LCID ratings. Get all STLA ratings here.

The Winner

The automotive industry stands to benefit from rising demand for personal and commercial vehicles, the accelerating transition to electric vehicles (EVs) driven by heightened consumer awareness of environmental issues, and the seamless integration of cutting-edge technologies. Industry players such as LCID and STLA are well-positioned to capitalize on these industry tailwinds.

However, given LCID’s relatively weak financial performance, low profitability, and elevated valuation multiples, its competitor STLA emerges as a more favorable investment choice.

Our research shows that the odds of success increase when one invests in stocks with an Overall Rating of Strong Buy or Buy. View all the top-rated stocks in the Auto & Vehicle Manufacturers industry here.

What To Do Next?

Get your hands on this special report with 3 low priced companies with tremendous upside potential even in today’s volatile markets:

3 Stocks to DOUBLE This Year >


STLA shares rose $0.07 (+0.39%) in premarket trading Tuesday. Year-to-date, STLA has gained 26.06%, versus a 15.83% rise in the benchmark S&P 500 index during the same period.


About the Author: Kritika Sarmah

Her interest in risky instruments and passion for writing made Kritika an analyst and financial journalist. She earned her bachelor’s degree in commerce and is currently pursuing the CFA program. With her fundamental approach, she aims to help investors identify untapped investment opportunities.

More…

The post Lucid Group Inc. (LCID) vs. Stellantis (STLA): Which Auto Stock Has Better Value? appeared first on StockNews.com

https://www.entrepreneur.com/finance/lucid-group-inc-lcid-vs-stellantis-stla-which-auto/455623


T2 Biosystems (TTOO) vs. Merit Medical Systems (MMSI): Which Is the Better Growth Stock?

With the rising prevalence of chronic diseases, consistent growth in the geriatric population, support from regulatory bodies, and the integration of digital technology, the medical device industry’s outlook looks promising. Prominent medical device stocks T2 Biosystems (TTOO) and Merit Medical Systems (MMSI) should benefit from the industry’s bright prospects. But let’s find out which is the better growth stock. Read on….

In this piece, I evaluated two medical device companies, T2 Biosystems, Inc. (TTOO) and Merit Medical Systems, Inc. (MMSI), to determine the better growth stock. Based on the fundamental comparison of these stocks, I believe MMSI is the better buy for the reasons explained throughout this article.

The COVID-19 pandemic has put the medical device industry in the spotlight, with unparalleled demand for products, including personal protective equipment (PPE), ventilators, diagnostic tests, and other general hospital supplies. Furthermore, the industry is well-poised for continued growth this year and beyond, driven by the growing prevalence of chronic diseases and a rapidly aging population.

The geriatric population is more likely to acquire age-related diseases that are less prevalent among younger individuals. Common health conditions associated with aging include cataracts and refractive errors, chronic obstructive pulmonary disease, hearing loss, diabetes, osteoarthritis, and heart disease.

The growing incidence of age-related diseases leads to an increasing number of patients undergoing diagnostic and surgical procedures, boosting the demand for medical devices and equipment. According to a report by Mordor Intelligence, the global medical devices market size is expected to reach $834.72 billion by 2028, growing at a 7% CAGR.

Additionally, the rising focus on developing technologically advanced medical devices and growing product launches contribute to the medical device industry’s expansion. In recent years, the digital transformation of the healthcare sector has been accelerated to meet demands for smart devices and robotics, AI-based data analysis, wearable technology, and enhanced platforms, among others.

As technology continues to advance every aspect of healthcare, there is an increased interest in incorporating artificial intelligence (AI) and machine learnings (ML) technologies into medical devices and equipment.

Over the past decade, the U.S. Food and Drug Administration (FDA) has reviewed and authorized a rising number of medical devices legally marketed (through 510(k) clearance, granted De Novo request, or approved PMA) with AI/ML functionality across various categories of medicine and this trend is expected to continue.

As per a report by Market Data Forecast, the global medical device technologies market is projected to grow from $601.43 million in 2023 to $769.78 million by 2028, registering a 5.6% CAGR during the forecast period. Increasing research & development (R&D) investments amid the growing focus of companies to develop technologically advanced equipment is mainly fueling the market’s growth.

MMSI is a clear winner in the price performance, with 7.8% returns over the past three months compared to TTOO’s 63.4% decline. MMSI has gained 44.4% over the past nine months, while TTOO plunged 96.5%. Also, MMSI’s 51.2% gains over the past year are higher than TTOO’s decline of 97.9%.

Here are the reasons why we think MMSI could perform better in the near term:

Latest Developments

On May 30, TTOO announced the second-largest sale of sepsis-driven T2Dx® instruments in the company’s history. The initial order includes seven T2Dx instruments, valued at more than $450,000, with the potential for nine additional instruments to be sold and deployed in selected hospitals across Poland during the second half of 2023.

“Our sepsis test revenue increased by 67% in Central Europe during the first quarter of 2023, compared to the prior year period, and we believe there is enormous potential to further expand the adoption of our sepsis products in Poland and throughout Europe,” said John Sperzel, TTOO’s Chairman and CEO.

On June 9, MMSI completed the acquisition of a portfolio of dialysis catheter products and the BioSentry® Biopsy Tract Sealant System from AngioDynamics, Inc. for a total cash consideration of $100 million. Also, the company announced the recent acquisition of the Surfacer® Inside-Out® Access Catheter System from Bluegrass Vascular Technologies, Inc. for a total cash consideration of $32.5 million.

These acquisitions are expected to strengthen MMSI’s position in the dialysis and biopsy markets and expand the foundation of the company’s growing specialty dialysis device offering, which includes WRAPSODY™ Cell-Impermeable Endoprosthesis, HeRO® Graft, and the Surfacer System devices.

Recent Financial Results

For the first quarter that ended March 31, 2023, TTOO’s total revenue was $2.08 million, a decline of 71.3% from the prior year’s period. The company reported a loss from operations of $13.69 million during the quarter. In addition, TTOO’s net loss and comprehensive loss widened 8.9% from the year-ago value to $17.97 million, while its net loss per share was $1.32.

MMSI’s net sales increased 8% year-over-year to $297.57 million in the first quarter that ended March 31, 2023. Its gross profit was $138.36 million, up 14.4% year-over-year. Its non-GAAP operating income grew 19.3% from the prior-year period to $47.97 million. The company’s non-GAAP net income was $37.50 million or $0.64 per share, compared to $30.40 million or $0.53 per share a year earlier.

Past And Expected Financial Performance

TTOO’s revenue has grown at a 23.5% CAGR over the past three years. However, the company’s total assets have increased at a 13.9% CAGR over the same period.

For the fiscal year ending December 2023, TTOO’s revenue is expected to decrease 42.3% year-over-year to $12.87 million. In addition, analysts expect the company’s EPS to remain negative for at least two fiscal years. However, the company’s revenue for the fiscal year 2024 is estimated to grow 87.1% year-over-year to $24.08 million.

Over the past three years, MMSI’s revenue and EBIT have grown at 5.5% and 26.4% CAGRs, respectively. The company’s normalized net income has increased at a 37.4% CAGR over the same time frame, while its levered cash flow has grown at a 29.8% CAGR.

Analysts expect MMSI’s revenue and EPS for the fiscal year (ending December 2023) to increase 7.5% and 7.3% year-over-year to $1.24 billion and $2.90, respectively. For the fiscal year 2024, the company’s revenue and EPS are expected to grow 6.2% and 10.9% from the previous year to $1.31 billion and $3.21, respectively.

Profitability

MMSI’s trailing-12-month revenue is 68.2 times what TTOO generates. Moreover, MMSI is more profitable, with a trailing-12-month gross profit margin of 45.74% compared to TTOO’s negative 146.84%. Also, MMSI’s trailing-12-month levered FCF margin of 4.89% is higher than TTOO’s negative 110.11%.

Furthermore, RM’s trailing-12-month Return on Assets (ROA) and Return on Total Capital (ROTC) of 7.87% and 4.86% compared with TTOO’s negative 143.48% and negative 159.09%, respectively.

Valuation

In terms of trailing-12-month Price/Sales, TTOO is currently trading at 0.05x, 98.7% lower than MMSI, which is trading at 3.87x. TTOO’s trailing-12-month EV/Sales multiple of 3.04 is lower than MMSI’s 4.08.

However, TTOO’s forward EV/Sales of 4.05x is higher than MMSI’s 3.87x.

POWR Ratings

TTOO has an overall rating of D, which equates to a Sell in our proprietary POWR Ratings system. Conversely, MMSI has an overall rating of B, translating to a Buy. The POWR Ratings are calculated considering 118 different factors, with each factor weighted to an optimal degree.

Our proprietary rating system also evaluates each stock based on eight distinct categories. TTOO has a grade of F for Stability. The Stability grade is justified by its 24-month beta of 1.15. On the other hand, MMSI has a B grade for Stability, consistent with its 24-month beta of 0.86.

In addition, TTOO has a grade of C for Sentiment, in sync with its poor financials and mixed analyst estimates. MMSI, in contrast, has a B grade for Sentiment, consistent with its solid financial performance in the previously reported quarter and optimistic analyst expectations.

Of the 140 stocks in the Medical – Devices & Equipment industry, TTOO is ranked #108, while MMSI is ranked #9.

Beyond what we’ve stated above, we have also rated both stocks for Value, Momentum, Quality, and Growth. Click here to view TTOO Ratings.  Get all MMSI ratings here.

The Winner

Despite an uncertain macroeconomic environment, the medical device industry is well-placed to witness significant growth and expansion in the long term. The growing prevalence of chronic diseases, a rapidly growing aging population, and the increasing emphasis of healthcare agencies on early diagnosis and treatment should fuel the demand for medical devices.

Furthermore, favorable support from the regulatory bodies in approving medical devices and the rapid adoption of digital technology are primary attributes driving the industry’s growth. Therefore, leading medical device companies TTOO and MMSI are expected to benefit from the industry tailwinds.

However, TTOO’s relatively weak financials, low profitability, high volatility, and bleak growth prospects make its competitor MMSI a better buy now.

Our research shows that the odds of success increase when one invests in stocks with an Overall Rating of Strong Buy or Buy. View all the top-rated stocks in the Medical – Devices & Equipment industry here.

What To Do Next?

Get your hands on this special report with 3 low priced companies with tremendous upside potential even in today’s volatile markets:

3 Stocks to DOUBLE This Year >


MMSI shares were unchanged in premarket trading Tuesday. Year-to-date, MMSI has gained 15.39%, versus a 15.83% rise in the benchmark S&P 500 index during the same period.


About the Author: Mangeet Kaur Bouns

Mangeet’s keen interest in the stock market led her to become an investment researcher and financial journalist. Using her fundamental approach to analyzing stocks, Mangeet’s looks to help retail investors understand the underlying factors before making investment decisions.

More…

The post T2 Biosystems (TTOO) vs. Merit Medical Systems (MMSI): Which Is the Better Growth Stock? appeared first on StockNews.com

https://www.entrepreneur.com/finance/t2-biosystems-ttoo-vs-merit-medical-systems-mmsi/455619


Buy These 3 Waste Disposal Stocks for Sustainable Profits

Rapid industrialization and large-scale urban migration have led to a surge in waste generation. As a result, the waste disposal industry is poised to witness solid long-term growth. Hence, fundamentally strong waste disposal stocks Waste Management (WM), Stericycle (SRCL), and Concrete Pumping (BBCP) might be solid buys. Keep reading.

Heightened government regulations and the strengthening of environmental concerns are expected to drive growth in the waste disposal industry. As the industry shows solid potential, quality waste disposal stocks Waste Management, Inc. (WM), Stericycle, Inc. (SRCL), and Concrete Pumping Holdings, Inc. (BBCP) might be solid buys for sustainable profits.

Waste generation has increased massively around the world in recent decades, and there are no signs of it slowing down. By 2050, global municipal solid waste generation is projected to rise by roughly 70% to 3.40 billion metric tons, due to a number of factors, such as population growth, urbanization, and economic growth, as well as consumer shopping habits.

Moreover, the global waste management market is expected to be driven by stringent government regulations such as the Resource Conservation and Recovery Act and Waste Shipment Regulation for improving this service. The global waste management market is expected to grow at a CAGR of 5.4% until 2030.

Additionally, large-scale urban migration has further had a significant impact on solid waste generation, thereby increasing the demand for an effective solid waste management framework with a strong focus on economic growth and public safety. Solid waste management market is anticipated to grow at a CAGR of 2.3% until 2032.

Let’s discuss the stocks mentioned above in detail:

Waste Management, Inc. (WM)

WM engages in the provision of environmental solutions to residential, commercial, industrial, and municipal customers in the United States and Canada.

WM’s trailing-12-month EBITDA margin of 27.74% is 105.6% higher than the 13.50% industry average. Its trailing-12-month net income margin of 11.33% is 78.5% higher than the 6.35% industry average.

WM pays a $2.80 per share dividend annually, which translates to a 1.65% yield on the current price. The company has a four-year average dividend yield of 1.74%.

WM’s adjusted revenues increased 5% year-over-year to $4.89 billion in the fiscal first quarter, which ended March 31, 2023. Its adjusted net income came in at $535 million. Also, its EPS increased 1.6% year-over-year to $1.31 and adjusted operating EBITDA increased 3.7% year-over-year to $1.33 billion.

WM’s revenue is expected to rise 4.1% year-over-year to $5.23 billion for the fiscal second quarter ended June 2023. The company’s EPS for the same quarter is expected to increase 7.3% year-over-year to $1.54. Additionally, the stock has topped consensus revenue and EPS estimates in three of the trailing four quarters, which is impressive.

The stock has gained 9.5% over the past nine months to close the last trading session at $170.01.

WM’s POWR Ratings reflect its promising outlook. The stock has an overall rating of B, which translates to a Buy in our proprietary rating system. The POWR Ratings are calculated by considering 118 different factors, with each factor weighted to an optimal degree.

WM also has a B grade for Quality and Stability. It is ranked #5 out of 15 stocks in the B-rated Waste Disposal industry.

To access additional ratings for WM’s Value, Growth, Sentiment, and Momentum, click here.

Stericycle, Inc. (SRCL)

SRCL provides regulated and compliance solutions in the United States, Europe, and internationally.

SRCL’s trailing-12-month gross profit margin of 37.71% is 26.4% higher than the 29.83% industry average. Its trailing-12-month EBITDA margin of 16.71% is 23.8% higher than the 13.50% industry average.

During the fiscal first quarter that ended March 31, 2023, SRCL’s revenue increased 3% year-over-year to $684.30 million. Gross profit increased 6.7% year-over-year to $261 million, while its income per common share attributable to SRCL came in at $0.12, compared to negative $0.15 in the previous-year quarter.

SRCL’s revenue is expected to increase marginally year-over-year to $685.29 million for the fiscal second quarter ended June 2023. Its EPS is expected to increase 5.7% year-over-year to $0.51 for the same quarter. Also, it has surpassed revenue estimates in three of the trailing four quarters.

Shares of SRCL have gained 9.3% over the past three months to close the last trading session at $45.59.

SRCL’s POWR Ratings reflect its robust outlook. The stock has an overall rating of B, which translates to a Buy in our proprietary rating system.

The stock has an A grade for Growth and a B in Stability and Sentiment. It is ranked #6 in the same industry.

Beyond what is stated above, we’ve also rated for Value, Quality, and Momentum. Get all SRCL ratings here.

Concrete Pumping Holdings, Inc. (BBCP)

BBCP provides concrete pumping and waste management services in the United States and the United Kingdom.

BBCP’s trailing-12-month EBIT margin of 13.14% is 35% higher than the 9.73% industry average. Its trailing-12-month gross profit margin of 40.52% is 35.8% higher than the 29.83% industry average.

BBCP’s revenue increased 11.7% year-over-year to $107.79 million during the second quarter that ended April 30, 2023. Gross profit increased 11.6% year-over-year to $43.47 million, while its net income per common share came in at $0.09. Also, its net income came in at $5.59 million.

Street expects BBCP’s revenue for the fiscal third quarter ending July 2023 to increase 10.1% year-over-year to $114.98 million. Its EPS is expected to increase 20.9% year-over-year to $0.16 for the same quarter. Also, it has surpassed revenue and EPS estimates in three of the trailing four quarters.

The stock has gained 35.2% year-to-date to close the last trading session at $7.91.

It is no surprise that BBCP has an overall rating of B, which equates to a Buy in our POWR Ratings system.

BBCP is graded a B in Momentum, Stability, Sentiment, and Quality. It is ranked #3 in the same industry.

In addition to the grades stated above, BBCP’s grades for Growth and Value can be seen here.

What To Do Next?

Discover 10 widely held stocks that our proprietary model shows have tremendous downside potential. Please make sure none of these “death trap” stocks are lurking in your portfolio:

10 Stocks to SELL NOW! >


WM shares were unchanged in premarket trading Monday. Year-to-date, WM has gained 9.35%, versus a 15.54% rise in the benchmark S&P 500 index during the same period.


About the Author: Nidhi Agarwal

Nidhi is passionate about the capital market and wealth management, which led her to pursue a career as an investment analyst. She holds a bachelor’s degree in finance and marketing and is pursuing the CFA program.Her fundamental approach to analyzing stocks helps investors identify the best investment opportunities.

More…

The post Buy These 3 Waste Disposal Stocks for Sustainable Profits appeared first on StockNews.com

https://www.entrepreneur.com/finance/buy-these-3-waste-disposal-stocks-for-sustainable-profits/455537


4 Coal Stocks to Power Up Your Investments

The coal industry enjoys robust demand, especially in developing economies. Hence, fundamentally strong coal stocks China Shenhua Energy (CSUAY), CONSOL Energy (CEIX), SunCoke Energy (SXC), and Hallador Energy (HNRG) might be solid buys. Read more.

Despite the rising drive towards green energy, coal plays a significant role in global energy production, especially in developing countries. Therefore, I think investors could consider quality coal stocks China Shenhua Energy Company Limited (CSUAY), CONSOL Energy Inc. (CEIX), SunCoke Energy, Inc. (SXC), and Hallador Energy Company (HNRG) to power up investments.

Coal has been a historically convenient and cost-effective power source, particularly for developing countries. As coal is a convenient and cheap source of power, the use of coal has grown almost continuously.

As a result, the global coal market is expected to grow to $658.68 billion in 2027 at a CAGR of 1.4%.

Moreover, the rise in demand for electricity or power generation is expected to propel the growth of the lignite mining market going forward. Lignite mining is also used in steam-electric power generation.

The global lignite market will reach $107.13 billion at a CAGR of 3.3% this year.

Furthermore, in an exciting technological development, coal mining companies are embracing the use of 3D mine visualizers to revolutionize their operations. This cutting-edge technology allows mining companies to gain a deeper understanding of their mines, enabling them to make more informed decisions and optimize their operations.

Let us take a look at the above-mentioned stock in detail:

China Shenhua Energy Company Limited (CSUAY)

Based in Beijing, China, CSUAY produces and sells coal and power; railway, port, and shipping transportation; and coal-to-olefins businesses. The company is a subsidiary of China Energy Investment Corporation Limited and operates through six segments: Coal; Power Generation; Railway; Port; Shipping; and Coal Chemical.

CSUAY’s forward EV/Sales and EV/EBIT multiples of 1.42 and 5.11 are 27.9% and 38.4% lower than the industry averages of 1.97 and 8.29, respectively.

The company’s annual dividend of $1.46 translates to a 12.08% yield, higher than its four-year average yield of 10.39%. Its dividend payouts have grown at a CAGR of 27% over the past three years.

In the fiscal first quarter that ended March 31, 2023, CSUAY’s revenue increased 3.7% year-over-year to RMB87.04 billion ($12.05 billion). The company’s attributable profit for the period rose marginally from the year-ago quarter to RMB23.59 billion ($3.27 billion), while earnings per share increased 4.3% from the previous-year quarter to RMB1.04.

Street expects CSUAY’s revenue to increase marginally year-over-year to $11.77 billion in the third quarter ending September 30, 2023.

CSUAY’s shares have gained 7.7% over the past year to close the last trading session at $12.08.

CSUAY’s POWR Ratings reflect its promising outlook. The stock has an overall rating of B, which translates to a Buy in our proprietary rating system. The POWR Ratings are calculated by considering 118 different factors, with each factor weighted to an optimal degree.

It also has a B grade for Stability and Quality. Out of the ten stocks in the A-rated Coal industry, the stock is ranked #2.

Click here to see CSUAY’s additional ratings (Growth, Value, Momentum, and Sentiment).

CONSOL Energy Inc. (CEIX)

CEIX is a producer and exporter of high-Btu bituminous thermal coal and metallurgical coal. The company owns and operates longwall mining operations in the Northern Appalachian Basin. It operates through two segments: The Pennsylvania Mining Complex and CONSOL Marine Terminal.

In terms of forward non-GAAP P/E, CEIX is trading at 3.08x, 66.4% lower than the industry average of 9.15x. The stock’s forward EV/EBIT multiple of 2.67 is 67.8% lower than the industry average of 8.29.

CEIX’s four-year average yield is 0.89%, while its annual dividend of $3.25 translates to a 6.49% yield on the prevailing prices.

CEIX’s total revenue and other income increased 92.1% year-over-year to $688.61 million in the first quarter that ended March 31, 2023. The company’s net income and EPS amounted to $230.38 million and $6.55 compared to a net loss and loss per share of $4.45 million and $0.13, respectively, in the same quarter last year.

CEIX’s EPS and revenue are expected to rise 30.5% and 8% year-over-year to $4.66 and $588.30 million in the fiscal second quarter that ended June 2023. The company surpassed the consensus EPS and revenue estimates in each of the trailing four quarters, which is remarkable.

The stock has gained 41.8% over the past year to close the last trading session at $67.84.

CEIX’s POWR Ratings reflect its solid prospects. The stock has an overall rating of B, translating to a Buy in our proprietary rating system.

It has an A grade for Quality and a B for Value. It is ranked #3 in the same industry.

Access additional CEIX ratings for Growth, Momentum, Stability, and Sentiment here.

SunCoke Energy, Inc. (SXC)

SXC operates as an independent producer of Coke in the Americas and Brazil. The company operates through three segments: Domestic Coke; Brazil Coke; and Logistics.

SXC’s forward Price/Sales multiple of 0.40 is 64.1% lower than the industry average of 1.13x. Its 4.49x forward EV/EBITDA is 41.5% lower than the 7.67x industry average.

On April 24, SXC and Cleveland-Cliffs Inc (CLF) agreed to a 12-year extension of their existing contract, under which SXC will provide 1.22 million tons of metallurgical coke annually to CLF from its Indiana Harbor coke-making facility located in East Chicago, Indiana.

Mike Rippey, CEO of SXC, said, “This contract renewal affirms the long-term partnership of SunCoke and Cleveland-Cliffs. We are pleased to continue supplying coke from our Indiana Harbor facility to the largest blast furnace in North America.”

The company pays an annual dividend of $0.32, which translates to a dividend yield of 3.94% on the current share prices. Its four-year average yield is 3.44%. Over the past five years, the company’s dividend payouts have grown at a CAGR of 38.7%.

During the first quarter that ended March 31, 2023, SXC’s revenues increased 10.9% year-year-over-year to $487.80 million. Its domestic coke revenue rose 47.2% year-over-year to $458.80 million. Net income attributable to SXC and earnings per share came in at $16.30 million and $0.19, respectively.

SXC’s EPS and revenue are expected to amount to $0.19 and $422.65 million in the fiscal second quarter that ended June 2023. Moreover, the company has exceeded its consensus revenue estimates in each of the trailing four quarters.

Over the past nine months, the stock has gained 31.1% to close the last trading session at $8.13. The stock has gained 21.2% over the past year.

SXC’s POWR Ratings reflect its robust prospects. The stock has an overall rating of B, equating to a Buy in our proprietary rating system.

SXC has an A grade for Sentiment and a B for Value. It is ranked first within the same industry.

In addition to the grades highlighted above, one can access SXC’s grades for Growth, Momentum, Stability, and Quality here.

Hallador Energy Company (HNRG)

HNRG engages in the production of steam coal in the State of Indiana for the electric power generation industry.

HNRG’s forward EV/Sales of 0.60x is 69.5% lower than the 1.97x industry average. Its 0.46 forward Price/Sales is 64.7% lower than the 1.31 industry average.

HNRG’s total revenues for the first quarter (ended March 31, 2023) increased 219.7% year-over-year to $188.33 million. The company’s income from operations stood at $29.23 million, compared to the loss from operations of $8.68 million in the year-ago quarter.

Also, the company’s net income and net income per share came in at $22.05 million and $0.61, compared to net loss and net loss per share of $10.13 million and $0.33, respectively, in the previous-year quarter.

Analysts expect HNRG’s revenue and EPS for the fiscal year ending December 2023 to increase 74.8% and 140.4% year-over-year to $632.70 million and $1.37, respectively. The company has surpassed the consensus revenue estimates in three of the trailing four quarters.

HNRG’s stock has gained 7.7% over the past month to close its last trading session at $8.81. In addition, it has gained 50.9% over the past year.

HNRG’s strong fundamentals are reflected in its POWR Ratings. The stock has an overall rating of B, which equates to Buy in our proprietary rating system.

HNRG has an A grade for Growth and a B for Value. It is ranked #4 within the same industry.

Beyond what we’ve stated above, we have also rated the stock for Momentum, Sentiment, Stability, and Quality. Click here to view HNRG’s ratings.

What To Do Next?

Discover 10 widely held stocks that our proprietary model shows have tremendous downside potential. Please make sure none of these “death trap” stocks are lurking in your portfolio:

10 Stocks to SELL NOW! >


CSUAY shares were unchanged in premarket trading Monday. Year-to-date, CSUAY has gained 16.58%, versus a 15.54% rise in the benchmark S&P 500 index during the same period.


About the Author: Kritika Sarmah

Her interest in risky instruments and passion for writing made Kritika an analyst and financial journalist. She earned her bachelor’s degree in commerce and is currently pursuing the CFA program. With her fundamental approach, she aims to help investors identify untapped investment opportunities.

More…

The post 4 Coal Stocks to Power Up Your Investments appeared first on StockNews.com

https://www.entrepreneur.com/finance/4-coal-stocks-to-power-up-your-investments/455536


Jobs Market vs. Stock Market?

Did you notice how much the S&P 500 (SPY) moved this week on the various employment reports? That’s because the health of employment tells us a lot about the health of the economy, likely future Fed actions and what that all means for the stock market. Read on below for Steve Reitmesiter’s assessment of the recent employment data and how that should effect stock prices and your trading plan.

All eyes were locked in on the many employment reports this week. That’s because the state of jobs holds the key for the economy…as well as what is likely to happen with future Fed rate decisions.

Honestly, you could not have more divergent information especially as we compare the rip-roaring ADP report on Thursday versus the subdued Government version on Friday.

So, we have much to discuss today on the labor front as to what it tells us about future Fed actions and the stock market (SPY) outlook.

Market Commentary

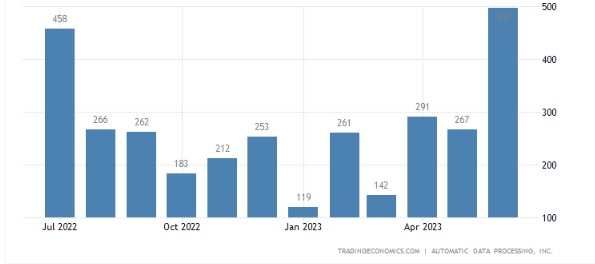
On Thursday investors could not believe their eyes as the ADP Employment Change report showed a whopping 497,000 added. That was more than 2X the expected result.

This gave investors a reason to hit the sell button as this result was considered “too good”. That’s because it sends a message to the Fed that the economy is too hot leading to more rate hikes on the way.

Another interesting part of this ADP report was seeing the +6.4% annual wage increase which is a sticky form of inflation that the Fed is not going to like the sound of. With that the odds for a rate hike on 7/26 jumped another notch to 95% showing that it is extremely likely. Further the odds for a second hike by end of the year just increased to 50% from nearly 0% chance a month ago.

Hmmm…maybe investors should start taking the Fed at their word about future rate hike intentions instead of creating conspiracy theories like they are bluffing.

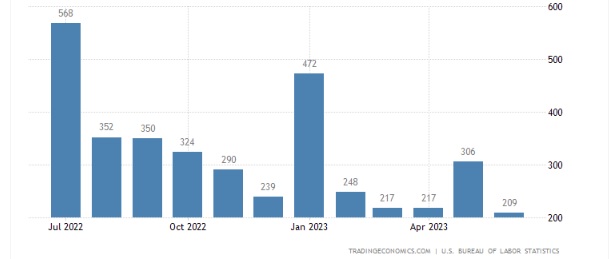
Now let’s flip the page to Friday morning where we get the tale of 2 jobs reports. That is because the Government Employment situation report was actually under expectations at just 209,000 jobs added.

There is no world in which both of these reports can be true. One is right and one is wrong about the employment trends.

Historically I have found the ADP report to be more consistently reliable about the state of employment whereas the Government version is often subject to serious revision after the fact. Yet as you explore the month by month charts for each report below, the only logical conclusion is that ADP is wrong and Government is right.

ADP Employment Change Monthly Past Year

Government Employment Situation Monthly Past Year

The trend of the Government Report is much more consistent with job adds basically slowing all year long. This makes much more logical sense in a world where the Fed keeps raising rates to slow down the economy to tamp down inflation.

The one aspect that these reports agree upon is that wage increases are still too hot which is something that Powell has repeatedly focused on at his press conferences. Again, there is NO DOUBT that another rate increase is in the cards for their meeting on 7/26.

Now let me add one more ingredient to the economy gumbo before we discuss what it all means for the market outlook and our trading plans.

That is a discussion of ISM Services which did not follow the path of ISM Manufacturing falling into deep contraction territory. In fact, it rallied from 50.3 to 53.9 in June. Even better was the New Orders component at 55.5 pointing to potentially more upside in future readings.

Add this all up, with clues from the Fed minutes, and you have an economy that is amazingly resilient. Especially on the employment side. Whereas this is normally good news…that is not the case in this situation given that the Fed’s current mission is to lower demand to win a battle versus inflation.

This recent news clearly shows that more rate hikes are on the way. And that increases the odds of future recession, but does not guarantee that outcome.

This all explains why stocks are pausing at current levels. Not a serious correction. Just not chugging ahead oblivious to the storm clouds off in the distance.

What many bulls are counting on is that a recession may never truly come together because of all the folks who chosen early retirement during Covid. This is why the labor market is so strong because there are literally 2-3 million less people looking for jobs leading to historically low unemployment rate and creating ample pressure on employers to give raises.

This is an interesting juxtaposition versus the Fed who wants to stamp out inflation with wage increases being one of the stickier elements. This is why so many market commentators, like Steve Liesman at CNBC, is talking about the Fed on purpose hiking rates “until something breaks”.

Clearly the key thing that needs to break is employment to produce less income in the economy which begets lower spending. This action would tame the most persistent form of inflation in wages.

So who is going to win this battle: Market Bulls vs. the Fed?

For me the fundamental logic still points to future recession (like in the next 12 months) with return of the bear market. BUT it is not a forgone conclusion. Nor should we discount the clearly bullish price action.

The solution is to take on a balanced investment approach closer to 50% long the stock market. Then adjust more bullish or bearish as new facts roll in.

Very few facts will matter this month outside of the 7/26 Fed meeting followed by the early August set of reports like ISM Manufacturing, ISM Services and Government Employment. Even the 7/12 CPI and 7/13 PPI inflation reports will barely move the needle as it is already assumed that inflation is too high forcing the Fed to raise rates once again.

The best assumption is that the market will consolidate around recent highs with a chance of modest pullback creating a new trading range. This pause will end as investors digest the next round of information that helps better determine the odds of future recession…and thus direction of the market.

I will do my best to share timely insights on that information as it comes in along with appropriate changes to our trading strategy. Again, I do lean bearish given the facts in hand…but more than happy to get bullish if that is what logic dictates.

What To Do Next?

Discover my full market outlook and trading plan for the rest of 2023. It’s all available in my latest presentation:

2nd Half of 2023 Stock Market Outlook >

Just in case you are curious, let me pull back the curtain a little wider on the main contents:

  • Review of…How Did We Get Here?
  • Bear Case
  • Bull Case
  • And the Winner Is??? (Spoiler: Bear case more likely)
  • Trading Plan with Specific Trades Like…
  • Top 10 Small Cap Stocks
  • 4 Inverse ETFs
  • And Much More!

If these ideas appeal to you, then please click below to access this vital presentation now:

2nd Half of 2023 Stock Market Outlook >

Wishing you a world of investment success!


Steve Reitmeister…but everyone calls me Reity (pronounced “Righty”)
CEO, StockNews.com and Editor, Reitmeister Total Return


SPY shares rose $0.24 (+0.05%) in after-hours trading Friday. Year-to-date, SPY has gained 15.54%, versus a % rise in the benchmark S&P 500 index during the same period.


About the Author: Steve Reitmeister

Steve is better known to the StockNews audience as “Reity”. Not only is he the CEO of the firm, but he also shares his 40 years of investment experience in the Reitmeister Total Return portfolio. Learn more about Reity’s background, along with links to his most recent articles and stock picks.

More…

The post Jobs Market vs. Stock Market? appeared first on StockNews.com

https://www.entrepreneur.com/finance/jobs-market-vs-stock-market/455502


Should Amazon.com (AMZN) Be on Your Watchlist this Month?

Tech giant Amazon (AMZN) surpassed analyst expectations in the fiscal 2023 first-quarter earnings. Moreover, the company has been actively pursuing strategic initiatives and launching new products to boost its purchases and revenue stream. Amid a challenging economic environment, should you consider adding AMZN to your watchlist this month? Read more to find out….

Leading technology company Amazon.com, Inc. (AMZN) beat analyst expectations in the first quarter of 2023, with revenue reaching $127.40 billion, surpassing the anticipated $124.50 billion. Amazon Web Services (AWS) generated $21.30 billion in revenue, beating the expected $21.22 billion, while advertising revenue stood at $9.50 billion, exceeding the projected $9.10 billion.

Although AWS sales grew nearly 16% during the first quarter, beating Wall Street’s estimates, they still slowed compared to the previous quarter’s 20% growth. Despite the revenue beat, AMZN’s sales growth remained in single digits after its weakest year for expansion as a public company.

For the second quarter of 2023, the company foresees revenue to come in between $127 billion and $133 billion, while analysts at Refinitiv anticipate sales of $129.80 billion for the same quarter. This outlook suggests a 5% to 10% year-over-year sales rise during the period.

Additionally, the company is making several moves to foster increased loyalty among Prime members, promote business-oriented purchases, and attract more small-business owners to use AMZN’s specialized services.

On June 27, AMZN announced it would offer Business Prime Duo at no cost to Amazon Prime members who make business purchases. Business Prime Duo, an Amazon Business membership, amalgamates business purchasing tools, exclusive business-only pricing on selected items, and prompt, complimentary business delivery.

Also, on May 17, the company unveiled a new lineup of Echo products. This introduction could benefit the company by offering customers more options and greater utility at a remarkable value. As the company continues to add generative AI-powered experiences for Alexa, every Echo device would enhance further throughout the year.

Such additions are expected to boost the company’s revenue streams. Rohit Prasad, senior vice president and head scientist for Alexa, said, “Customers around the world love Alexa as their trusted, personal AI—they’ve now purchased well over half a billion Alexa-enabled devices, and use of Alexa increased 35 percent last year.”

Shares of AMZN have gained 55.1% over the past six months to close its last trading session at $130.36.

Here is what could shape AMZN’s performance in the near term:

Mixed Financials

During the first quarter that ended March 31, 2023, AMZN’s net sales increased 9.4% year-over-year to $127.36 billion. Its operating income rose 30.1% from the year-ago value to $4.77 billion.

Moreover, the company’s net income and EPS came in at $3.17 billion and $0.31, compared to a net loss and loss per share of $3.84 billion and $0.38, in the prior year’s period, respectively.

However, as of March 31, 2023, the company’s cash and cash equivalents stood at $49.34 billion, compared to $53.89 billion as of December 31, 2022.

Solid Historical Growth

Over the past three years, AMZN’s revenue grew at a 21% CAGR. The company’s EBITDA rose at a CAGR of 16.4%. Moreover, the company’s total assets increased at a 28% CAGR during the same period.

Favorable Analyst Estimates

Analysts expect AMZN’s revenue to increase 8.5% year-over-year to $137.95 billion for the fiscal third quarter ending September 2023. The company’s EPS for the ongoing quarter is expected to rise 38.7% from the previous year’s period to $0.39. Moreover, the company surpassed its consensus revenue estimates in three of four trailing quarters.

Furthermore, AMZN’s revenue for the next fiscal quarter (ending December 2024) is expected to grow 9.9% year-over-year to $164.02 billion, while its EPS for the same period is expected to grow considerably from the prior year’s quarter to $0.50.

Stretched Valuation

In terms of forward non-GAAP P/E, AMZN is trading at 83.38x, 472% higher than the industry average of 14.58x. Its forward EV/EBITDA multiple of 16.31 is 69.9% higher than the industry average of 9.60. In addition, the stock’s forward Price/Book of 7.31x is 183.7% higher than the industry average of 2.58x.

High Profitability

AMZN’s trailing-12-month gross profit margin of 44.7% is 26.9% higher than the 35.24% industry average. Its trailing-12-month EBITDA margin of 10.90% is 2.3% higher than the industry average of 10.65%. Also, the stock’s trailing-12-month CAPEX/Sales of 11.98% is 274.9% higher than the 3.2% industry average, while its trailing-12-month asset turnover ratio of 1.20x compares to the industry average of 1.00x.

POWR Ratings Show Uncertainty

AMZN’s mixed fundamentals are reflected in its POWR Ratings. The stock has an overall rating of C, which equates to Neutral in our proprietary rating system. The POWR Ratings are calculated by taking into account 118 different factors, with each factor weighted to an optimal degree.

Our proprietary rating system also evaluates each stock based on eight distinct categories. AMZN has an A grade for Sentiment and a B for Growth, consistent with its optimistic analyst expectations and solid financial performance. The stock also has a C grade for Stability, justifying its 24-month beta of 1.50.

AMZN is ranked #16 in the 58-stock Internet industry. Click here to access AMZN’s Value, Momentum, and Quality ratings.

View all the top stocks in the Internet industry here.

Bottom Line

Tech giant AMZN surpassed revenue expectations in its fiscal 2023 first quarter, yet its sales growth remained in single digits. Nevertheless, the company anticipates significant sales growth in the upcoming fiscal quarter, which could be attributed to its recent launches and strategic initiatives to increase purchases and boost its revenue streams.

While AMZN’s financials, profitability, and outlook remain sound, the company’s valuation doesn’t seem up to the mark. Therefore, waiting for a better entry point in this stock could be wise.

How Does Amazon.com, Inc. (AMZN) Stack Up Against Its Peers?

While AMZN has an overall POWR Ratings grade of C, equating to Neutral, one could also check out other stocks within the Internet industry that are overall A (Strong Buy) rated: Yelp Inc. (YELP), trivago N.V. (TRVG), and Travelzoo (TZOO).

What To Do Next?

Get your hands on this special report with 3 low priced companies with tremendous upside potential even in today’s volatile markets:

3 Stocks to DOUBLE This Year >


AMZN shares were trading at $131.01 per share on Monday morning, up $0.65 (+0.50%). Year-to-date, AMZN has gained 55.96%, versus a 16.85% rise in the benchmark S&P 500 index during the same period.


About the Author: Aanchal Sugandh

Aanchal’s passion for financial markets drives her work as an investment analyst and journalist. She earned her bachelor’s degree in finance and is pursuing the CFA program.She is proficient at assessing the long-term prospects of stocks with her fundamental analysis skills. Her goal is to help investors build portfolios with sustainable returns.

More…

The post Should Amazon.com (AMZN) Be on Your Watchlist this Month? appeared first on StockNews.com

https://www.entrepreneur.com/finance/should-amazoncom-amzn-be-on-your-watchlist-this-month/455217


Is the Bear Market TRULY Dead?

When you check out the surging S&P 500 (SPY) on Friday…and pretty much all June…and heck, pretty much all year, it sure looks like a new bull market is at hand. However, investment veteran, Steve Reitmesiter, points out “that was then…and this is now”. Be sure to tune in for his 2nd half of 2023 stock market outlook, trading plan and top picks. Get the rest of the story below.

Stocks closed on a high note this Friday. This puts a bullish exclamation mark on the first half of the year!

That is now…but what happens later is a bit more of a mystery.

Yes, the current trend could continue. Or perhaps there will be reason for more caution in the months ahead.

Let’s spend some time today to consider what happens in the 2nd half of the year so we can craft the best trading plan to carve profits from the market.

Market Commentary

The most complete way for me to share my stock market outlook and trading plan is by watching the presentation I just gave for the MoneyShow that covers the following topics:

  • Review of…How Did We Get Here?
  • Bear Case
  • Bull Case
  • And the Winner Is??? (Spoiler: Bear case more likely)
  • Trading Plan with Specific Trades Like…

Watch It Here >

Assuming you watched the video, let me add some additional color commentary.

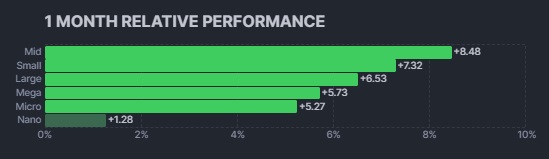
That starts by admitting that the recent price action is straight up bullish. Even previously noted problems with lack of market breadth are improving as gains are finally making their way beyond the tech mega caps in the S&P 500 (SPY) to other stocks including small and mid caps.

Unfortunately, on the fundamental front I still see things as mostly bearish. The key being the likelihood of a future recession forming which would beget lower corporate earnings and thus lower stock prices.

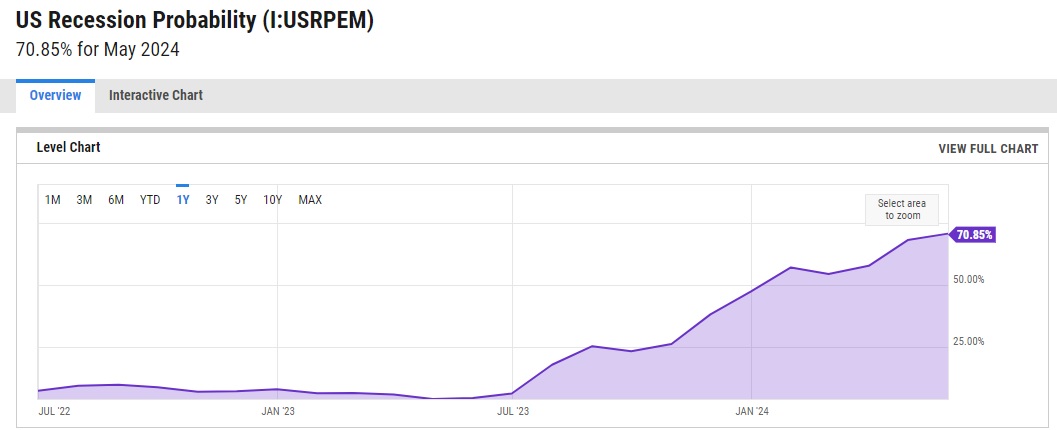
Using the popular recession probability measure where folks compare the inversion between the 3 month & 10 year Treasuries, that now looks like this at just over 70% probability of recession by May 2024:

So how can stocks be up this much as the future probability of recession darkens?

This fits in with the “Boy Who Cried Wolf” version of the investment story. Just replace “Wolf” with “Recession”.

Investors are tired of hearing about the probability of recession as it keeps NOT happening. At this stage they will not react UNTIL that recession/wolf is on their doorstep with blood dripping from its fangs. THEN investors will sell stocks in earnest. Until that time, it seems to be…”Party on Garth” for investors.

You may have heard a snippet today that the Core PCE inflation reading was slightly better than expected. Since this is the Fed’s favorite inflation measure it was considered the main catalyst for stocks flying higher once again.

Now the facts…

+4.6% year over year inflation is indeed better than the 4.7% reading from last month. But unless I am mistaken, it is nowhere close to the 2% target inflation rate required by the Fed.

Further, the month over month reading came in exactly as expected at +0.3% which still points to the current pace of increase between +3.6% and 4%. Again, still too hot.

This explains why the odds of a rate hike at the next Fed meeting on 7/26 is now up to 87% likelihood vs. 72% a week ago and up from 53% a month ago. Meaning this inflation reading does not make anyone think the Fed will stop putting their foot on the neck of the economy with future rate hikes.

Please remember that on Wednesday, Chairman Powell noted once again that 2 more rate hikes are on the menu. This was accompanied by the usual sound bites about more work to do…and higher rates for longer…and please get off your crack pipe if you think that we will lower rates this year (OK…that last part was me, not Powell ;-)

There is a lot of key economic reports this coming week like ISM Manufacturing, ISM Service and Government Employment. However, unless they SCREAM RECESSION, then I suspect investors will remain blissfully ignorant.

No…I am not saying the bull market will keep advancing non-stop from here. I am saying it is not ready for a real sell off until proof of a recession is seemingly irrefutable.

Note that often the end of a quarter ends with a bang followed by a whimper. That is why I am not chasing this market. We have enough in the market too participate in upside while not extending our necks to far lest our heads get chopped off.

I still think we have a mild case of irrational exuberance which should give way to a modest pullback and trading range to start July. This would be the logical choice as investors await more clues to point out the odds of recession and whether that pushes us more bullish…or back into our bearish caves.

But…who says the market is logical? ;-)

For now, a balanced portfolio closer to 50% invested feels the most appropriate given the facts in hand. We will continue to monitor the situation and make adjustments as appropriate. Just don’t be too late to react to that recessionary wolf when it starts moving your way.

What To Do Next?

Discover my full market outlook and trading plan for the rest of 2023. It’s all available in my latest presentation:

2nd Half of 2023 Stock Market Outlook >

Just in case you are curious, let me pull back the curtain a little wider on the main contents:

  • Review of…How Did We Get Here?
  • Bear Case
  • Bull Case
  • And the Winner Is??? (Spoiler: Bear case more likely)
  • Trading Plan with Specific Trades Like…
  • Top 10 Small Cap Stocks
  • 4 Inverse ETFs
  • And Much More!

If these ideas appeal to you, then please click below to access this vital presentation now:

2nd Half of 2023 Stock Market Outlook >

Wishing you a world of investment success!


Steve Reitmeister…but everyone calls me Reity (pronounced “Righty”)
CEO, StockNews.com and Editor, Reitmeister Total Return


SPY shares were trading at $443.25 per share on Friday afternoon, up $5.14 (+1.17%). Year-to-date, SPY has gained 16.78%, versus a % rise in the benchmark S&P 500 index during the same period.


About the Author: Steve Reitmeister

Steve is better known to the StockNews audience as “Reity”. Not only is he the CEO of the firm, but he also shares his 40 years of investment experience in the Reitmeister Total Return portfolio. Learn more about Reity’s background, along with links to his most recent articles and stock picks.

More…

The post Is the Bear Market TRULY Dead? appeared first on StockNews.com

https://www.entrepreneur.com/finance/is-the-bear-market-truly-dead/455158


Grab This Leading Stock Market App for Life with an Extra $20 Off with Coupon

Disclosure: Our goal is to feature products and services that we think you’ll find interesting and useful. If you purchase them, Entrepreneur may get a small share of the revenue from the sale from our commerce partners.

The stock market is more fun when you’re making money than when you’re losing it. The most successful traders spend extensive amounts of time researching and analyzing the market to make the best trades for them. Ordinary people and busy entrepreneurs don’t have that luxury, but they can get access to Tykr Stock Screener, which can help educate and inform.

Between July 1 and July 8, you can get a lifetime Tykr Pro Plan for one of the best prices ever when you use promo code STOCK during our version of Prime Day.

Tykr has earned 4.9/5 star ratings from AppSumo and Trustpilot because it’s one of the best stock screening and education apps on the market. It’s designed to help you take the guesswork out of investing, giving you an intuitive platform where you can find information on more than 30,000 US and international stocks in a matter of seconds.

[embedded content]

Every stock on Tykr includes a summary and a score. The summary lists the stock as On Sale (potential buy), Watch, or Overpriced (potential sell), while the score indicates a stock’s safety as an investment. All of this information results from a rigorous algorithmic process going on behind the scenes. But all calculations are open-source, so if you want to know how Tykr came to a certain conclusion, you can always pull back the curtain.

Tykr is all about helping you reduce risk while investing. And as you trade, you’ll gain a better foundation for investing to make the right decisions for yourself without the calculations in the future.

Tykr is on sale as part of our Deal Days promotion, a Prime Day-like sale that lasts longer and offers even bigger discounts.

From July 1 to July 8, you can get Tykr Stock Screener at an exclusive price when you use promo code STOCK (reg. $900) and save an extra $20 off the $119 sale price.

Prices are subject to change.

https://www.entrepreneur.com/technology/20-off-coupon-for-leading-stock-market-app/454974


2nd Half of 2023 Stock Market Outlook

43 year investment veteran Steve Reitmeister shares his most complete and up to the minute analysis of what lies ahead for investors the rest of 2023. This includes a review of the bull case and bear case to determine where the S&P 500 (SPY) winds up this year. Next comes a complete trading plan and top picks. Spoiler Alert: Steve still believes bear case the most likely outcome. So be sure to check out the updated market outlook before placing your next trades. Get the full story below.

The original market outlook I created in December needs a major revamp. Just too much has changed these past several months.

This led to me record a brand new presentation this week that you should watch before trading resumes on Monday:

2nd Half of 2023 Stock Market Outlook >

Not convinced?

OK, let me pull back the curtain a little wider on the main contents:

  • Review of…How Did We Get Here?
  • Bear Case
  • Bull Case
  • And the Winner Is??? (Spoiler: Bear case more likely)
  • Trading Plan with Specific Trades Like…
  • Top 10 Small Cap Stocks
  • 4 Inverse ETFs
  • And Much More!

If these ideas appeal to you, then please click below to access this vital presentation now:

2nd Half of 2023 Stock Market Outlook >

Wishing you a world of investment success!


Steve Reitmeister…but everyone calls me Reity (pronounced “Righty”)
CEO, Stock News Network and Editor, Reitmeister Total Return


SPY shares were trading at $441.94 per share on Friday morning, up $3.83 (+0.87%). Year-to-date, SPY has gained 16.43%, versus a % rise in the benchmark S&P 500 index during the same period.


About the Author: Steve Reitmeister

Steve is better known to the StockNews audience as “Reity”. Not only is he the CEO of the firm, but he also shares his 40 years of investment experience in the Reitmeister Total Return portfolio. Learn more about Reity’s background, along with links to his most recent articles and stock picks.

More…

The post 2nd Half of 2023 Stock Market Outlook appeared first on StockNews.com

https://www.entrepreneur.com/finance/2nd-half-of-2023-stock-market-outlook/455149


KISS Investing = Focus On…

When you boil it down there is really just 1 key indicator that will decide the bull vs. bear market debate once and for all. Steve Reitmeister spells it out in his latest market commentary that shares a trading plan to stay on the right side of the action. Spoiler Alert: Odds point to the bear market reemerging with the S&P 500 (SPY) heading much lower as the most likely outcome. Get the rest of the story below.

It is easy to get a case of “Information Overload” when it comes to investing.

So many economic reports. So much price action. So many pundits with opinions flowing in every different direction.

Yet as I look at our current situation, I think the bull/bear debate will be settled by 1 single factor. That being the health of the employment picture. Read on below for more insight and what it means for our trading plans.

Market Commentary

The faux stock rally post 6/14 Fed meeting has already faltered. That was not so obvious at first as the S&P 500 (SPY) broke above 4,400. Yet under the surface, once again, it was a hollow victory.

Meaning that just like the majority of 2023 the gains only accrued to the usual suspects in the mega cap and tech space while at the same time mid caps and small caps were painted red. That pain broadened out this week and even the large caps took it on the chin.

Likely a main cause was Powell being a bit more sternly hawkish as he testified to the House Financial Services Committee on Wednesday. In my book he stuck to the usual talking points of a lot more work to be done and probably 2 more hikes along with a weakening of the employment picture before their work of taming inflation is done.

Those were the same points as back on 6/14. Yet this time his tone better matched the seriousness of his words.

Meaning that back on 6/14 I thought Powell’s was a bit too soft and thus did not match the stiff restrictions they are prepared to do. This is likely why some bulls hit the buy button not appreciating how likely the Fed’s actions are to cause a recession in the months ahead. A week later on 6/21 more investors got the memo on how it is not so bullish for the economy or stock market.

At this stage investors are getting tired of words. They want proof positive of where things stand to dictate their next moves.

This has us all on recession watch. That starts with a focus on the key economic indicators in manufacturing, services, retail sales etc.

However, let’s remember that Q1 of 2022 actually saw negative GDP and yet was not a recession because employment stayed strong. So, at this stage we need to have a focus on the jobs market as an indicator as to whether a recession is finally afoot.

The market will mostly move based upon the release of the Government Employment Situation report which is the first Friday of every month (7/7). Gladly we don’t have to wait that long for leading indicators that could tell us if things are getting worse.

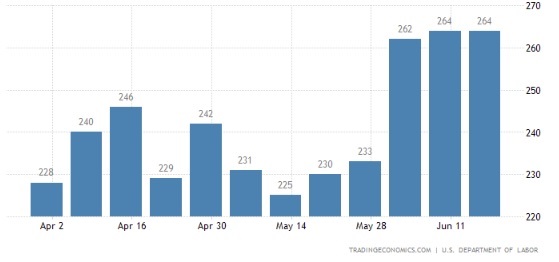
That investigation starts every Thursday with the release of the Jobless Claims report which has recently jumped 15% to 264K per week. Note that at 300K+ weekly claims generally points to a period in which the unemployment rate will start to rise.

Other places with clues are the Employment components of ISM Manufacturing (7/3) and ISM Services (7/6). The most recent readings in June came in at 51.4 and 49.2 respectively (below 50 = contraction).

Both of these readings are anemic with the much larger services sector seeing a precipitous drop from 54 just a few months back. These readings tell you about the diminishing intention of employers to hire in the future.

Similar to this is the keeping tabs on the NFIB Small Business Optimism Index (7/12). The worse these business leaders feel about the outlook for the economy…the less likely they will be to hire additional employees. The last 2 months have provided the lowest readings in a year. That bodes poorly for future hiring plans.

Lastly is the JOLTs Job Openings (7/6) which measures the # of openings that are publicly posted. Consider that before companies start letting go of employees, they first will stop hiring new ones.

This indicator has been at record levels in the past year with over 11 million job openings. That has recently dropped a little more than 10% from recent peaks, but still very high showing robust job demand. Signs of further weakness here could be telling of future declines in the unemployment rate.

Trading Plan

My prediction of stocks pausing at 4,400 with a 3-5% correction unfolding seems well timed. Consider this a new trading range and holding pattern until investors assemble facts on whether a recession is coming or if the Fed amazingly manufactures a soft landing.

Everyone knows their track record is not great. 12 of the last 15 rate hike cycles have ended in recession. Almost every time they predicted a soft landing and yet failed 75% of the time.

Now this go around they are actually predicting a mild recession. So that would seem to tip the scales in a recessionary direction. But when you consider the same level of overshoot…it probably going to be more severe than just a mild recession.

The key to the recession picture, as shared above, is employment. Let’s keep our eyes on these leading indicators to give us a leg up in predicting what happens next.

When you boil it down it works like this:

Rising unemployment = recession = bear market reawakens with stocks tumbling lower = get more defensive in your portfolio

Stable employment = soft landing = new long term bull market ascends to new heights = get more aggressive in your portfolio

Get those employment report dates on your calendar to keep tabs of this vital indicator. This will give you a running head start on the rest of investors who may only react to the monthly Government Employment Situation report.

What To Do Next?

Discover my balanced portfolio approach for uncertain times.

It is perfectly constructed to help you participate in the current market environment while adjusting more bullish or bearish as necessary in the days ahead.

If you are curious in learning more, and want to see the hand selected trades in my portfolio, then please click the link below to what 43 years of investing experience can do for you.

Steve Reitmeister’s Trading Plan & Top Picks >

Wishing you a world of investment success!


Steve Reitmeister…but everyone calls me Reity (pronounced “Righty”)
CEO, StockNews.com and Editor, Reitmeister Total Return


SPY shares were trading at $433.21 per share on Friday afternoon, down $3.30 (-0.76%). Year-to-date, SPY has gained 14.13%, versus a % rise in the benchmark S&P 500 index during the same period.


About the Author: Steve Reitmeister

Steve is better known to the StockNews audience as “Reity”. Not only is he the CEO of the firm, but he also shares his 40 years of investment experience in the Reitmeister Total Return portfolio. Learn more about Reity’s background, along with links to his most recent articles and stock picks.

More…

The post KISS Investing = Focus On… appeared first on StockNews.com

https://www.entrepreneur.com/finance/kiss-investing-focus-on/454745