Coinbase Global (COIN) vs. Adobe (ADBE): Which Stock Is the Better Buy Now?

Both Adobe (ADBE) and Coinbase (COIN) impressed analysts by surpassing Wall Street estimates in their last reported quarter. Let’s compare their fundamentals to identify which is the better buy now.

In this piece, I evaluated Adobe Inc. (ADBE) and Coinbase Global, Inc. (COIN) to determine which one is worth buying now. Based on a fundamental comparison of these stocks, ADBE appears to have better upside potential for the reasons explained throughout this article.

Last year the tech industry was under pressure due to the challenges posed by high inflation and the Fed’s aggressive interest rate hikes. Although the Fed is likely to raise interest rates twice by the end of the year, it is expected to start cutting interest rates next year, which could be positive news for tech stocks.

ADBE’s EPS and revenue for the second quarter came above analyst estimates. Its EPS was 3.2% above the consensus estimate, while its revenue beat analyst estimates by 0.9%. Similarly, COIN beat the EPS and revenue estimates in the first quarter. While its EPS was $1.32 above the consensus estimate, its revenue topped analyst estimates by 18.1%.

ADBE’s Chair and CEO Shantanu Narayen said, “Adobe achieved record Q2 revenue demonstrating strong demand across Creative Cloud, Document Cloud, and Experience Cloud. Adobe’s ground-breaking innovation positions us to lead the new era of generative AI given our rich datasets, foundation models, and ubiquitous product interfaces.”

After posting higher revenues than expected during the first quarter, COIN stated, “We reduced costs, doubled down on operational excellence and risk management, and continue to drive product innovation and regulatory clarity. Our efforts are showing meaningful progress.”

ADBE expects its total revenue for the third quarter to be between $4.83 billion and $4.87 billion. Its Digital Media net new ARR is projected to be approximately $410 million. Additionally, its non-GAAP is expected to be between $3.95 and $4. For fiscal 2023, the company expects its total revenue to be between $19.25 billion and $19.35 billion.

Its Digital Experience subscription revenue is expected to be between $4.30 billion and $4.35 billion. Also, its non-GAAP EPS is expected to be between $15.65 and $15.75.

COIN forecasts its subscription and services revenue for the second quarter to be approximately $300 million, while its sales and marketing expenses are expected between $80 million and $90 million.

Earlier this month, COIN found itself in trouble after U.S. regulators, in a new lawsuit, alleged that the cryptocurrency platform was operating as an unregistered securities platform and brokerage service. In the complaint, the SEC claimed that COIN made billions by acting as the middle-man for cryptocurrency buyers and sellers but did not give investors lawful protections while acting as a broker.

The SEC said, “Coinbase has for years defied the regulatory structures and evaded the disclosure requirements that Congress and the SEC have constructed for the protection of the national securities markets and investors.”

When it comes to price performance, ADBE is the clear winner. ADBE stock has delivered positive returns in all time frames. Over the past nine months, ADBE has gained 66.4%, compared to COIN’s 8.7% decline.

Here are the reasons I think ADBE could perform better in the near term:

Recent Financial Results

ADBE’s total revenue for the second quarter ended June 2, 2023, increased 9.8% year-over-year to $4.82 billion. Its net cash from operating activities rose 4.9% over the prior-year quarter to $2.14 billion. The company’s non-GAAP operating income increased 10.4% year-over-year to $2.18 billion.

In addition, its non-GAAP net income increased 13.2% over the prior-year quarter to $1.79 billion. Also, its non-GAAP EPS came in at $3.91, representing an increase of 16.7% year-over-year.

For the fiscal first quarter ended March 31, 2023, COIN’s total revenue declined 33.8% year-over-year to $772.53 million. Its net loss narrowed 81.6% year-over-year to $78.90 million. Its net loss per share narrowed 82.8% year-over-year to $0.34. The company’s adjusted EBITDA rose significantly year-over-year to $283.65 million.

Expected Financial Performance

Analysts expect ADBE’s EPS for fiscal 2023 and 2024 to increase 14.7% and 12.7% year-over-year to $15.72 and $17.72. Its fiscal 2023 and 2024 revenue is expected to increase 9.8% and 12.1% year-over-year to $19.33 billion and $21.66 billion. Its EPS and revenue for the quarter ending August 2023 are expected to increase 17% and 9.8% year-over-year to $3.98 and $4.87 billion, respectively.

Street expects COIN’s EPS for fiscal 2023 and 2024 to remain negative. Its revenue for fiscal 2023 is expected to decline 11.6% year-over-year to $2.82 billion. On the other hand, its revenue for fiscal 2024 is expected to increase 12.6% year-over-year to $3.18 billion.

Profitability

ADBE’s trailing-12-month revenue is 6.8 times what COIN generates. ADBE is more profitable, with an EBITDA margin and net income margin of 37.03% and 26.34%, compared to COIN’s negative 56.39% and 83.60%, respectively. Also, ADBE’s asset turnover of 0.68x compares to COIN’s 0.03x.

Valuation

In terms of forward EV/Sales, ADBE is currently trading at 11.20x, 159.3% higher than COIN’s 4.32x. ADBE’s trailing-12-month Price/Sales ratio of 11.99x is 151.4% higher than COIN’s 4.77x.

Thus, COIN is relatively more affordable.

POWR Ratings

ADBE has an overall rating of B, which equates to a Buy in our proprietary POWR Ratings system. On the other hand, COIN has an overall rating of D, translating to a Sell. The POWR Ratings are calculated considering 118 different factors, with each factor weighted to an optimal degree.

Our proprietary rating system also evaluates each stock based on eight distinct categories. ADBE has an A grade for Quality, in sync with its high profitability. COIN’s poor profitability justifies its D grade for Quality.

ADBE’s favorable analyst estimates justify its B grade for Sentiment. On the other hand, COIN has a C grade for Sentiment, consistent with its mixed analyst estimates.

Of the 135 stocks in the Software – Application industry, ADBE is ranked #17, while COIN is ranked #125 in the same industry.

Beyond what we’ve stated above, we have also rated both stocks for Growth, Value, Momentum, and Stability. Click here to view ADBE’s ratings. Get all the ratings of COIN here.

The Winner

ADBE reported record revenue and strong growth in annual recurring revenue (ARR) and profitability during the second quarter, enabling it to raise its annual targets. The company remains well-positioned to capitalize on the more than $200 billion market opportunity thanks to its investments in innovation.

On the other hand, COIN’s prospects look uncertain as the crypto industry continues to be extremely volatile. The company finds itself amid a lawsuit by the SEC accusing it of defying regulatory structures and evading the disclosure requirements mandated by Congress and the SEC to protect investors.

Considering these factors, ADBE could be a better choice than COIN.

Our research shows that the odds of success increase when one invests in stocks with an Overall Rating of Strong Buy or Buy. View all the top-rated stocks in the Software – Application industry here.

What To Do Next?

Get your hands on this special report with 3 low priced companies with tremendous upside potential even in today’s volatile markets:

3 Stocks to DOUBLE This Year >


ADBE shares were trading at $477.90 per share on Friday morning, up $0.32 (+0.07%). Year-to-date, ADBE has gained 42.01%, versus a 14.31% rise in the benchmark S&P 500 index during the same period.


About the Author: Dipanjan Banchur

Since he was in grade school, Dipanjan was interested in the stock market. This led to him obtaining a master’s degree in Finance and Accounting. Currently, as an investment analyst and financial journalist, Dipanjan has a strong interest in reading and analyzing emerging trends in financial markets.

More…

The post Coinbase Global (COIN) vs. Adobe (ADBE): Which Stock Is the Better Buy Now? appeared first on StockNews.com

https://www.entrepreneur.com/finance/coinbase-global-coin-vs-adobe-adbe-which-stock-is-the/454696




1 Water Stock to Buy, 2 to Sell

While the water sector faces significant challenges, the vital importance of water and the increasing spotlight on the industry provides lucrative opportunities. Hence, fundamentally strong water stock Consolidated Water (CWCO) might be a solid buy. However, fundamentally weak Cadiz (CDZI) and Ocean Power Technologies (OPTT) might be best avoided. Read on.

As water shortage continues to spark tensions worldwide, the water industry is expected to witness robust demand. However, the current economic uncertainties present a set of challenges for the industry.

So, while investors could consider quality water stock Consolidated Water Co. Ltd. (CWCO), I think it might be wise to avoid Cadiz Inc. (CDZI) and Ocean Power Technologies, Inc. (OPTT), given their grim fundamentals.

Amidst global uncertainty, the water industry is witnessing favorable conditions boosting investment and participation. This is due to the essential nature of water, as it is something humans cannot live without.

Moreover, the water industry growth is influenced by the escalating issue of water scarcity and the depletion of groundwater levels worldwide. As water resources become more limited, the demand for efficient water management solutions and technologies rises, creating opportunities for the industry to expand.

The global water treatment systems market is anticipated to grow at a CAGR of 8.8% from 2022 to 2030.

However, Fitch’s Sector Outlook for the U.S. water and sewer utilities industry is currently described as ‘Deteriorating‘ due to a combination of factors, including rising inflation and a slowing U.S. economy.

Economists at Fitch predict a mild recession around mid-2023. This outlook suggests that the water and sewer utilities sector will face another year of challenges in terms of costs and capital.

Senior Director and U.S. Water and Sewer Sector Head Audra Dickinson said, “General inflationary pressures, notably higher chemical, labor, and power costs, and weaker economic growth are likely to weaken financial performance for water and sewer utilities.”

Stock to Buy:

Consolidated Water Co. Ltd. (CWCO)

Headquartered in Grand Cayman, the Cayman Islands, CWCO designs, constructs, manages, and operates water production and water treatment plants primarily in the Cayman Islands, the Bahamas, and the United States. The company operates through four segments: Retail; Bulk; Services; and Manufacturing.

CWCO’s forward EV/Sales multiple of 2.46 is 34.5% lower than the industry average of 3.75. Its trailing-12-month PEG multiple of 0.30 is 64% lower than the industry average of 0.83.

On June 6, 2023, CWCO announced its indirect subsidiary, Kalaeloa Desalco LLC, had signed a definitive agreement with the Honolulu Board of Water Supply (BWS) to design, build, operate, and maintain a seawater reverse osmosis desalination plant.

The company expects revenue generated over the approximate 24-year base term of the contract to total about $204 million in current dollars.

On May 30, 2023, CWCO declared a quarterly cash dividend of $0.085 per share, payable on July 31, 2023.

CWCO pays an annual dividend of $0.34, which translates to a yield of 1.45% at the current market price. Its four-year average dividend yield is 2.54%.

During the fiscal first quarter that ended March 31, 2023, CWCO’s revenues increased 68.1% year-over-year to $32.87 million. Its gross profit grew 47.8% from its year-ago quarter to $10.56 million. The company’s net income attributable to CWCO came in at $3.81 million or $0.24 per share, up 122.1% and 118.2% year-over-year.

Street expects CWCO’s revenue to rise 46% year-over-year to $30.75 million in the current fiscal quarter ending June 2023. Its EPS is estimated to increase 33.3% year-over-year to $0.20 in the current quarter. The stock has an impressive earnings surprise history, surpassing its consensus revenue estimates in each of the trailing four quarters.

Over the past year, the stock has gained 78.8%, closing the last trading session at $24. It has gained 58.5% year-to-date.

CWCO’s POWR Ratings reflect its promising outlook. The stock has an overall rating of B, which translates to a Buy in our proprietary rating system. The POWR Ratings are calculated by considering 118 different factors, with each factor weighted to an optimal degree.

It also has an A grade for Sentiment and a B for Momentum, Growth, and Value. Within the 13-stock Water industry, it is ranked first.

To access the additional CWCO ratings for Stability, Sentiment, and Quality, click here.

Stocks to Sell:

Cadiz Inc. (CDZI)

CDZI provides water solutions in the United States. It operates through Land and Water Resources; and Water Treatment Business segments. It offers clean water solutions, and water storage, conveyance, and treatment solutions.

CDZI’s forward EV/Sales and P/S of 101.87x and 91.15x are significantly higher than the industry averages of 3.75x and 2.06x, respectively.

During the fiscal first quarter that ended March 31, 2023, CDZI’s revenue declined 8.5% year-over-year to $130 thousand. Its operating loss rose 9.7% from the prior-year quarter to 4.15 million, while operating expenses increased 9% year-over-year to $4.28 million.

Moreover, the company’s net loss and comprehensive loss applicable to common stock rose 66.6% year-over-year to $11.96 million.

Analysts expect CDZI’s EPS to be negative $0.06 for the fiscal second quarter ending June 2023. The company has failed to surpass consensus EPS estimates in each of the trailing four quarters, which is disappointing.

The stock has tumbled 12.5% over the past month to close the last trading session at $4.05.

CDZI’s bleak prospect is reflected in the POWR Ratings system. It has an overall rating of F, which translates to a Strong Sell in our proprietary rating system.

The stock also has an F grade for Value and a D for Growth, Sentiment, and Quality. It is ranked #12 within the same industry.

Click here to see the POWR Ratings of CDZI (Momentum and Stability).

Ocean Power Technologies, Inc. (OPTT)

OPTT develops and commercializes proprietary systems that generate electricity by harnessing the renewable energy of ocean waves in North America, South America, Europe, and Asia. It offers the PB3 PowerBuoy system that generates power for the power grid in offshore locations.

OPTT’s trailing-12-month Price/Sales of 13.93x is 917.3% higher than the industry average of 1.37x.

During the fiscal third quarter that ended January 31, 2023, OPTT’s operating loss rose 28.5% year-over-year to $7.06 million. Its net loss and net loss per share increased 11.3% and 10% year-over-year to $6.09 million and $0.11.

Moreover, the company’s combined cash, unrestricted cash, cash equivalents, and short-term investments as of January 31, 2023, were $41.1 million, compared to $57.7 million at the beginning of the year.

The stock has plunged 36.9% over the past nine months to close the last trading session at $0.61.

It’s no surprise that OPTT has an overall rating of F, which translates to a Strong Sell in our POWR Ratings system.

The stock also has an F grade for Value and Quality and a D for Growth and Sentiment. It is ranked last within the same industry.

Beyond the POWR Ratings stated above, one can access OPTT’s grades for Momentum and Stability here.

What To Do Next?

Discover 10 widely held stocks that our proprietary model shows have tremendous downside potential. Please make sure none of these “death trap” stocks are lurking in your portfolio:

10 Stocks to SELL NOW! >


CWCO shares were unchanged in premarket trading Thursday. Year-to-date, CWCO has gained 63.06%, versus a 14.59% rise in the benchmark S&P 500 index during the same period.


About the Author: Kritika Sarmah

Her interest in risky instruments and passion for writing made Kritika an analyst and financial journalist. She earned her bachelor’s degree in commerce and is currently pursuing the CFA program. With her fundamental approach, she aims to help investors identify untapped investment opportunities.

More…

The post 1 Water Stock to Buy, 2 to Sell appeared first on StockNews.com

https://www.entrepreneur.com/finance/1-water-stock-to-buy-2-to-sell/454597


Alibaba Group Holding Ltd. ADR (BABA) vs. China Automotive Systems (CAAS): Which Stock Is Catching Investors’ Attention?

With the ‘zero-Covid’ policy behind it, China’s economy began to recover. However, the nation’s economic recovery is losing momentum after an initial burst in consumer and business activity earlier this year. Amid a volatile economic backdrop, let’s find out which China stock, Alibaba Group (BABA) and China Automotive (CAAS), is attracting significant investors’ attention. Read on….

In this piece, I evaluated two China stocks, Alibaba Group Holding Limited (BABA) and China Automotive Systems, Inc. (CAAS), to determine which has been drawing investors’ attention lately. Based on the fundamental comparison of these stocks, I believe CAAS is the better investment for the reasons explained throughout this article.

After three years of strict COVID-19 restrictions, China announced loosening up on rules and opening its borders in December 2022. The National Bureau of Statistics of China reported that the GDP grew by 4.5% year-over-year in the first quarter of 2023, indicating that the world’s second-largest economy is firmly on the path to recovery after the lifting of its ‘dynamic zero-COVID’ strategy.

The nation’s GDP was higher than the 4% forecast in a Reuters poll and marked the highest growth since the first quarter of last year. Also, the economy expanded by 2.2% quarter-on-quarter.

However, after better-than-expected growth in the first quarter, China’s economic recovery is losing steam. A slew of economic data in May raised hopes of decisive policy intervention. Retail sales, a key gauge of consumption, rose 12.7% from a year earlier, slowing from the 18.4% gain in April and below expectations for 13.6% growth forecast by a Reuters poll.

Furthermore, China’s industrial production grew by 3.5% in May from a year ago, slightly missing expectations. Also, the country’s youth unemployment rate hit a fresh record high of 20.8% last month. The jobless rate for people of all age groups in cities was 5.2%.

As China’s economy loses momentum lately, Goldman Sachs joined Wall Street banks in slashing the country’s growth outlook. Goldman cut its forecasts for full-year GDP from 6% to 5.4%. Goldman Sachs’ economists said several macroeconomic issues are facing the nation.

“With the reopening boost quickly fading, medium-term challenges such as demographics, the multi-year property downturn, local government implicit debt problems, and geopolitical tensions may start to become more important in China’s growth outlook, economists added.

CAAS is a clear winner in price performance, with 19.9% returns over the past nine months compared to BABA’s 2.5% gain. Moreover, CAAS has gained 19.9% over the past year, while BABA plunged 14%.

Here are the reasons why we think CAAS could perform better in the near term:

Recent Financial Results

BABA’s revenue increased 2% year-over-year to $30.32 billion in the fourth quarter that ended March 31, 2023. Its income from operations declined 9.7% from the year-ago value to $2.22 billion. Its adjusted EBITDA was $4.68 billion, up 37.4% year-over-year. In addition, the company’s non-GAAP net income and non-GAAP EPS were $3.99 billion and $0.20, an increase of 38% and 35% year-over-year, respectively.

CAAS’ net sales increased 4.3% year-over-year to $142.20 million for the first quarter that ended March 31, 2023. Its gross profit grew 46.9% year-over-year to $21.60 million. Its income from operations was $7.70 million, compared to a loss from operations of $1.50 million in the same quarter of 2022.

Furthermore, the Net income attributable to the parent company’s common shareholders was $6.80 million or $0.23 per share, compared to a net loss of $1,289 thousand or a loss per share of nil in the first quarter of 2022.

Past And Expected Financial Performance

Over the past three years, BABA’s revenue and EBITDA grew at 19.5% and 1.6% CAGRs, respectively. The company’s net income and EPS declined at CAGRs of 21.3% and 21.1% over the same time frame, respectively. Also, its total assets increased at a CAGR of 10.1%.

Analysts expect BABA’s revenue and EPS for the first quarter (ending June 2023) to increase 8.6% and 21% year-over-year to $31.03 billion and $1.96, respectively. For the fiscal year (ending March 2024), the company’s revenue and EPS are expected to increase 9.2% and 9.9% from the previous year to $132.31 billion and $8.36, respectively.

In addition, BABA’s EPS is expected to grow 1.1% per annum over the next five years.

CAAS’ revenue and EBITDA grew at 10.6% and 18.8% CAGRs over the past three years, respectively. Over the same period, the company’s net income and EPS increased at 49.1% and 50.5% CAGRs, respectively, while its total assets grew at a CAGR of 4.9%.

For the second quarter ending June 2023, CAAS’ revenue and EPS are expected to increase 10.7% and decrease 64.5% year-over-year to $140.72 million and $0.11, respectively. Furthermore, analysts expect the company’s revenue for the fiscal year (ending December 2023) to grow 7% year-over-year to $566.71 billion. Over the next five years, CAAS’ EPS is expected to grow 10% per annum.

Profitability

BABA’s trailing-12-month revenue is 236.3 times what CAAS generates. Moreover, BABA is more profitable, with a trailing-12-month gross profit margin and EBITDA margin of 36.72% and 16.62% compared to CAAS’ 16.64% and 7.68%, respectively. BABA’s trailing-12-month levered FCF margin of 12.85% is higher than CAAS’ 2.77%.

Furthermore, BABA’s trailing-12-month ROA and ROTC of 5.95% and 5.01% compared with CAAS’ 0.55% and 2.80%, respectively. Also, BABA’s trailing-12-month net income margin of 8.38% is higher than CAAS’ 5.24%.

Valuation

In terms of trailing-12-month non-GAAP P/E, CAAS is currently trading at 5.45x, 51.3% lower than BABA, which is trading at 11.19x. CAAS’ trailing-12-month Price/Sales multiple of 0.29 is lower than BABA’s 1.82. Likewise, CAAS’ trailing-12-month EV/EBITDA of 9.34x compared to BABA’s 2.79x.

In addition, CAAS’ trailing-12-month EV/Sales multiple of 1.55 is 86.5% lower than BABA’s 1.55. Also, CAAS’ trailing-12-month Price/Cash Flow of 7.75x compared to BABA’s 2.97x.

Thus, CAAS is relatively more affordable.

POWR Ratings

BABA has an overall rating of C, which equates to a Neutral in our proprietary POWR Ratings system. Conversely, CAAS has an overall rating of A, translating to a Strong Buy. The POWR Ratings are calculated considering 118 different factors, with each factor weighted to an optimal degree.

Our proprietary rating system also evaluates each stock based on eight distinct categories. BABA has a C grade for Growth, consistent with its mixed financials. On the contrary, CAAS has a grade of A for Growth, in sync with its solid financial performance.

In addition, BABA has a C grade for Value, justified by its mixed valuation. BABA has a trailing-12-month non-GAAP P/E of 11.19x, 11% lower than the industry average of 12.58x. However, the stock’s trailing-12-month EV/Sales multiple of 1.55 is 34.6% higher than the industry average of 1.15.

On the other hand, CAAS has an A grade for Value, consistent with its lower-than-industry valuation. CAAS’ trailing-12-month non-GAAP P/E and EV/Sales of 5.45x and 0.21x compared to the industry averages of 12.58x and 1.15x, respectively.

Of the 43 stocks in the B-rated China industry, BABA is ranked #20, while CAAS is ranked #3.

Beyond what we’ve stated above, we have also rated both stocks for Stability, Momentum, Sentiment, and Quality. Click here to view BABA Ratings. Get all CAAS ratings here.

The Winner

After lifting its strict COVID-19 restrictions that were in place for almost three years, China’s economic growth has been under the spotlight as it reopens. The nation’s economic recovery has been stalling recently after robust consumer and business activity in the first quarter. So, when considering the top China stock picks, looking for resilience and growth potential within this volatile economic landscape is vitally important.

CAAS’ robust financials, discounted valuation, and bright growth prospects make it a better buy than its competitor BABA, and this Chinese stock has been drawing significant investors’ attention lately.

Our research shows that the odds of success increase when one invests in stocks with an Overall Rating of Strong Buy or Buy. View all the top-rated stocks in the China industry here.

What To Do Next?

Discover 10 widely held stocks that our proprietary model shows have tremendous downside potential. Please make sure none of these “death trap” stocks are lurking in your portfolio:

10 Stocks to SELL NOW! >


BABA shares fell $0.22 (-0.25%) in premarket trading Thursday. Year-to-date, BABA has declined -1.50%, versus a 14.59% rise in the benchmark S&P 500 index during the same period.


About the Author: Mangeet Kaur Bouns

Mangeet’s keen interest in the stock market led her to become an investment researcher and financial journalist. Using her fundamental approach to analyzing stocks, Mangeet’s looks to help retail investors understand the underlying factors before making investment decisions.

More…

The post Alibaba Group Holding Ltd. ADR (BABA) vs. China Automotive Systems (CAAS): Which Stock Is Catching Investors’ Attention? appeared first on StockNews.com

https://www.entrepreneur.com/finance/alibaba-group-holding-ltd-adr-baba-vs-china-automotive/454596


Investing with Occam’s Razor

Time to get philosophical about the outlook for the market with the help of Occam’s Razor. This tool tells us to assume that the simplest explanation is the most likely. Now lets apply that to recent Fed statements for what that tells us about the next move for the stock market (SPY). Along with that Steve Reitmeister shares his updated trading plan to stay on the right side of the action. Read in below for more.

I continue to be amazed by the wide-ranging reaction to the most recent Fed announcement on Wednesday 6/14. I went into detail on this topic in my last commentary:

Powell to Investors: Do You Feel Lucky Punk?

Now given the benefit of a long relaxing weekend, I have come to an even simpler view of things. I will share that in today’s Reitmeister Total Return commentary with associated trading plan.

Market Commentary

What came to mind over the weekend was applying Occam’s Razor when interpreting the Fed plans and what the means for the economy and stock market.

For those who are not immediately familiar with this philosophical concept, then here is the boiled down version from Wikipedia:

“Simpler explanations are more likely to be correct; avoid unnecessary or improbable assumptions.”

In this case the simpler explanation is to take the Fed at their word. That probably 2 more rate hikes are coming and the jobs market will be a casualty in their war against inflation.

I share this insight versus those who somehow think it is more logical that the Fed is bluffing about their future intentions. That is a long shot friends…and thus seems like a grave mistake to bet on that outcome with higher stock prices.

Remember that an ongoing mission of the Fed going back many administrations is the necessity for clear and consistent communication. This is the best way for investors to act in orderly fashion with the least disruption to the market.

Now consider how consistent Powell and other Fed officials have been on their messaging. Like these talking points that are echoed time and time again at the multitudinous Fed speeches the past several months:

  • Inflation is an economic disease that must be eradicated for the long term benefit of the economy.
  • There is more work to do to tamp down inflation to 2% target
  • 2 more rate hikes likely this year
  • Unemployment rate will climb to 4.5% before it improves (yet remember that at NO TIME in history has unemployment rate ever climbed that high without going at least 1% higher. Meaning the Fed is underplaying the likely negative effects of their plans).
  • The greater risk is for the Fed to end their efforts too early allowing inflation to rise from the ashes. (Meaning better to create recession than allow inflation to rise again). Which is why they keep saying…
  • No rate cuts til 2024
  • Recession still the base case

The simpler, and much more plausible explanation, is that the Fed is going to do EXACTLY what they say they are going to do.

If that is true, then it is hard to be bullish. Much more logical to be balanced or straight up bearish given the high probability this ends in recession and reawakening the bear market from its slumber.

For now, investors seem to be pressing pause. That is a bit harder to see with the S&P 500 (SPY) still a notch higher than at the time of the 6/14 Fed announcement.

But once again those numbers are skewed towards gains in the usual mega cap suspects. Looking out to the small and mid caps, both are firmly in the negative column since the Fed announcement.

Also in the negative camp for investor sentiment is the spike in rate hike expectations for the 7/26 Fed meeting. A month ago, only 19% saw another quarter point hike in July. That probability is now up to 77%.

Note that the Fed’s favorite inflation gauge is Core PCE which comes out again on 6/30. No doubt that report will adjust the odds once again. So keep your eyes on that.

Trading Plan

The bear market has been firmly in hibernation mode all year long. Dormant…but not dead.

So, for now I think investors are in wait and see mode. No need to advance higher given the gains already in hand. And no need for a nasty correction either. Maybe a modest 3-5% pullback allowing a trading range to emerge between 4,200 and 4,400.

The more serious the Fed is about all the pronouncements above, the more likely a recession is in the forecast which brings with it a return of bearish conditions. A bearish hedge or straight up shorting of the market will be the trading path to profits.

Whereas the more quickly annual inflation appears on pace for 2% or less, without unemployment rising, then indeed the Fed stuck the soft landing. This will be a bullish green light to emerge into the next long term bull market. Risk On growth oriented investing is what pays the bills here with an overweighting of small caps (given how much they are lagging large caps at this time).

I will continue to monitor the all the relevant inputs to give updates and trading adjustments as the situation dictates.

What To Do Next?

Discover my balanced portfolio approach for uncertain times.

It is perfectly constructed to help you participate in the current market environment while adjusting more bullish or bearish as necessary in the days ahead.

If you are curious in learning more, and want to see the hand selected trades in my portfolio, then please click the link below to what 43 years of investing experience can do for you.

Steve Reitmeister’s Trading Plan & Top Picks >

Wishing you a world of investment success!


Steve Reitmeister…but everyone calls me Reity (pronounced “Righty”)
CEO, StockNews.com and Editor, Reitmeister Total Return


SPY shares fell $0.22 (-0.05%) in after-hours trading Tuesday. Year-to-date, SPY has gained 14.75%, versus a % rise in the benchmark S&P 500 index during the same period.


About the Author: Steve Reitmeister

Steve is better known to the StockNews audience as “Reity”. Not only is he the CEO of the firm, but he also shares his 40 years of investment experience in the Reitmeister Total Return portfolio. Learn more about Reity’s background, along with links to his most recent articles and stock picks.

More…

The post Investing with Occam’s Razor appeared first on StockNews.com

https://www.entrepreneur.com/finance/investing-with-occams-razor/454494


Reading Between the Lines of the Latest FOMC Statement

The big news this week came from the Fed, with a pause in the rate hike cycle along with hawkish language from the FOMC (higher rates to come). However, after a brief pullback in stocks, the S&P 500 (SPY) and other markets have gotten back to their bullish ways. We’ll get back to that in a bit, but the good news for us is bullishness can only help our portfolio. Despite the uncorrelated nature of some of our smaller holdings (in terms of market cap), a rising tide tends to lift all boats. Read on for more….

(Please enjoy this updated version of my weekly commentary originally published June 15th in the POWR Stocks Under $10 newsletter).

As expected, the Fed decided not to raise rates at the June FOMC meeting. This comes on the heels of a bigger expected drop in CPI. The popular inflation measure came in at 4%, which was down significantly from 4.9% in the previous month.

The apparent easing of inflation may be one reason the Fed was comfortable not raising rates this time around.

However, the FOMC wasn’t shy about being hawkish with its language. There’s nearly a 70% chance of a quarter point rate hike in July. Moreover, the central bank made it clear they have a lot of work left to do before they get to the inflation number they prefer.

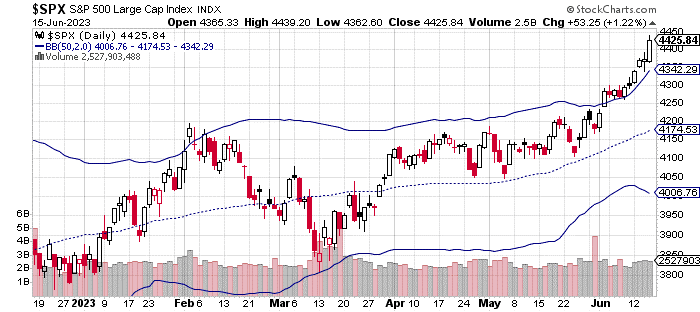
Nevertheless, the warnings from the Fed made little difference to the stock market. After a brief pullback in the major indices, stocks rebounded by the end of Fed Day. And on Thursday, the S&P 500 (SPY) climbed another 1.2%.

You can see in the chart above, the SPX (S&P 500 index) is clearly above the two-standard deviation upper barrier.

Volatility has increased a bit, so the breach is a bit less egregious than it would have been a week ago. That being said, I would expect some mean reversion next week as the buying subsides.

That’s not to say stocks won’t keep going up on average. In fact, at this point, I would be surprised by any meaningful selloffs for the next month or so.

Still, as I often say, mean reversion is a real thing and at some point the market will move back towards its mean price.

In the meantime, the economy continues to chug away. Retails sales also beat expectations this week (climbing 0.3% in May) as consumers continue to shop despite higher than normal inflation.

The Fed has an interesting situation on its hands. Do they want to take a chance torpedoing the economy? Or, should their focus be mostly on lowering inflation?

We’ll see how things play out, but I would expect a couple more rate increases this year before we are in a position to hold steady (and eventually see lower rates). We may be stuck with higher rates for another year or so at this rate.

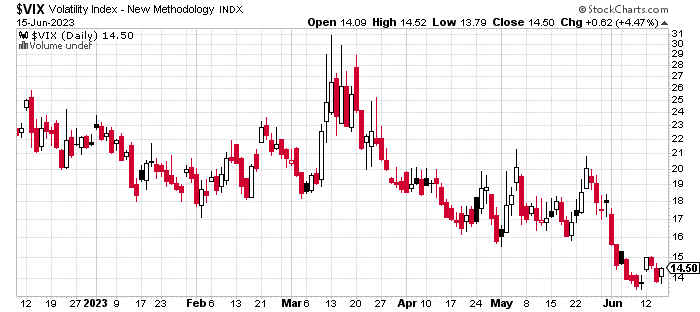
Volatility moved a bit higher before the Fed announcement but it fell back down below 15 on Thursday. All signs point towards a continued low volatility regime for the summer trading months. You can see the VIX action in the graph below.

Outside of some unexpected news items, I wouldn’t expect any significant increase in the VIX level until we approach the July FOMC meeting.

Keep in mind, the July 4th holiday is major travel season and there isn’t likely to be much volatility around that period.

What To Do Next?

The above commentary will help you appreciate where the market is going. But if you want to know the best stocks to buy now, then please check out my new special report:

3 Stocks to DOUBLE This Year

What gives these stocks the right stuff to become big winners, even in this challenging stock market?

First, because they are all low priced companies with the most upside potential in today’s volatile markets.

But even more important, is that they are all top Buy rated stocks according to our coveted POWR Ratings system and they excel in key areas of growth, sentiment and momentum.

Click below now to see these 3 exciting stocks which could double or more in the year ahead.

3 Stocks to DOUBLE This Year

All the Best!


Jay Soloff
Chief Growth Strategist, StockNews
Editor, POWR Stocks Under $10 Newsletter


SPY shares closed at $439.46 on Friday, down $-3.14 (-0.71%). Year-to-date, SPY has gained 15.35%, versus a % rise in the benchmark S&P 500 index during the same period.


About the Author: Jay Soloff

Jay is the lead Options Portfolio Manager at Investors Alley. He is the editor of Options Floor Trader PRO, an investment advisory bringing you professional options trading strategies. Jay was formerly a professional options market maker on the floor of the CBOE and has been trading options for over two decades.

More…

The post Reading Between the Lines of the Latest FOMC Statement appeared first on StockNews.com

https://www.entrepreneur.com/finance/reading-between-the-lines-of-the-latest-fomc-statement/454316


Powell to Investors: Do You Feel Lucky Punk?

The “seeming” post Fed meeting rally for the S&P 500 is head scratcher for sure. That’s because as we dig below the surface, the overall market has not really rallied…just the usual suspects in the mega cap space. As you dissect the Fed statements there is a great divide in interpretation. One rational. And one borderline insane. To make sense of it all 43 year investment veteran, Steve Reitmeister, shares is updated market outlook and trading plan below….

There are only 2 possible ways to interpret the Fed statements from Wednesday.

First, take the Fed at their word that probably 2 more hikes are coming and unemployment will rise because of those efforts.

Second, assume they are bluffing and are actually done with rate hiking cycle.

Now let me ask you…Does chairman Powell look like the bluffing type? Or does he look like an Eagle Scout that has told the truth every time his mouth has opened since birth???

Hopefully the answer is obvious enough. The Fed is not bluffing. Which explains why the CME’s FedWatch Tool has risen to show 74% probability of a rate hike at their next meeting in late July.

More to the point, the Fed has consistently stated that high inflation is an economic disease that harms long term growth and employment. Thus, their goal is to wholly eradicate it and get back to 2% annual inflation target.

Their method to eradicate it is to “lower demand” by slowing down the economy. It is hard to lower demand if you have full employment and everyone’s wallet is full.

That is why time after time Powell’s press conference talks about the employment picture being too strong which leads to sticky wage inflation.

Adding these concepts together it is CLEAR that they will keep rates aloft until they have effectively caused unemployment to rise. That is why they are still anticipating a 1% increase in the unemployment rate before all is said and done.

Now let me say it another way.

They WANT unemployment to rise to put a final nail in the high inflation coffin. That is why so many commentators are saying they will keep rates aloft until “something breaks”.

That is why you should take them at their word that…

  • There is more work to be done to control inflation
  • 2 more rate hikes are likely in the forecast this year
  • Lower rates will NOT occur in 2023
  • And yes, unemployment will rise by 1%…or more!

Here is the real wakeup call friends.

The unemployment rate has never gone up by 1% and stopped there. Research shows that once you rise that much, it typically leads to a 2% or greater rise. Kind of like opening Pandoras Box which greatly increases the odds of future recession (and deeper bear market).

Do You Feel Lucky, Punk?

To the market bulls I repeat the point blank question from Dirty Harry “Do You Feel Lucky Punk?”

In that infamous scene Dirty Harry (Clint Eastwood) has fired several shots to apprehend a criminal on the run. And now he stands over him with gun pointed at his head with one of the greatest monologues of all time.

That being in all the flurry of activity Harry is not sure whether he shot 5 times or the full 6 in the gun. Thus, he asks the guy does he feel lucky as to whether the gun is empty and he should attempt to flee the scene. Of course, the criminal was wise to turn himself in because the risk of getting his head blown off was far too high.

Yes, the Fed has shot many rate hike bullets at the economy. So, when they tell you they are probably going to shoot twice more…and that will likely lead to a hike in unemployment…and history shows that comes hand in hand with recession…and recessions go hand in hand with lower stock prices…THEN it feels “straight jacket crazy” to keep buying stocks at this time.

Another Rally That Wasn’t a Rally

On the surface it sure looks like investors interpreted the Fed meeting as a green flag for the bull market. Yet as we dig deeper we find it was just more of the same insanity from earlier this year. Just all the money going to the usual suspects in the Mega Cap space.

This is why the Bond King, Jeffrey Gundlach, said on CNBC that that we are seeing a mania style bubble in mega caps because of the excitement over AI. But given the current valuation of the overall stock market, that bonds are the much better value at this time given the tremendous rise in yields. And yes, that stock prices should fall. His analysis is absolutely, historically, objectively true.

So as we dig below the surface we find that mid caps and small caps are actually down since the Wednesday afternoon Fed announcement. Not rallying with the mega cap dominated S&P 500.

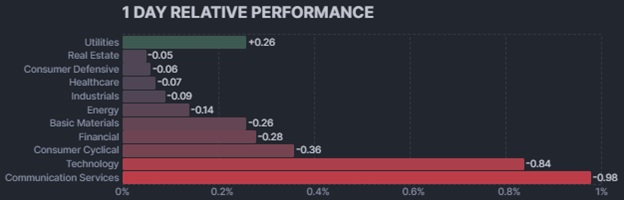
Meaning there is NO breadth…and therefore not much real substance in the rally. With that in mind, now take a look at this chart from Friday of the top performing sectors:

Look at the top 4 sectors. Those are defensive groups which means Risk Off market conditions. Not the bull market that is being too widely advertising in the media circles.

Can stocks keep rallying in the light of these facts?

Sadly yes. That is the very nature of manias and bubbles which brings to mind the famed quote from legendary economist John Maynard Keynes:

“Markets can remain irrational longer than you can remain solvent”.

Trading Plan

Given all the above is why my trading plan continues to be balanced. As in 50% invested.

That is the best way to straddle the bearish fundamental outlook against bullish price action. (Yet as shared above, the price action is not as bullish as it seems given not enough stocks are really participating in the good times…just the usual suspects in the mega cap space).

This balanced posture allows us to shift more bearish if a recession comes on the scene pushing investors to hit the SELL BUTTON in earnest.

And yes, we can still shift more bullish if the fundamental picture improves allowing the stock gains to broaden out to more groups.

Heck, Powell may be the greatest poker player on the planet and the Fed may be done raising rates. But with that rate hike gun pointed at my head…I am going to take him at his word that there are more bullets to be fired.

What To Do Next?

Discover my balanced portfolio approach for uncertain times.

It is perfectly constructed to help you participate in the current market environment while adjusting more bullish or bearish as necessary in the days ahead.

If you are curious in learning more, and want to see the hand selected trades in my portfolio, then please click the link below to what 43 years of investing experience can do for you.

Steve Reitmeister’s Trading Plan & Top Picks >

Wishing you a world of investment success!


Steve Reitmeister…but everyone calls me Reity (pronounced “Righty”)
CEO, StockNews.com and Editor, Reitmeister Total Return


SPY shares rose $0.14 (+0.03%) in after-hours trading Friday. Year-to-date, SPY has gained 15.35%, versus a % rise in the benchmark S&P 500 index during the same period.


About the Author: Steve Reitmeister

Steve is better known to the StockNews audience as “Reity”. Not only is he the CEO of the firm, but he also shares his 40 years of investment experience in the Reitmeister Total Return portfolio. Learn more about Reity’s background, along with links to his most recent articles and stock picks.

More…

The post Powell to Investors: Do You Feel Lucky Punk? appeared first on StockNews.com

https://www.entrepreneur.com/finance/powell-to-investors-do-you-feel-lucky-punk/454299


How To Profit By Combining The Power Of POWR Ratings And The Power Of Options

Using POWR Ratings along with technical and volatility analysis to uncover high probability trades. Then use the leverage of options to heighten the potential returns while lowering the risk.

POWR Ratings identify the best stocks using a proprietary model to put the odds of success in your favor. Since 1999, the highest A Rated POWR Stocks have outperformed the S&P 500 by more than 4X.

Pair that with in-depth technical and volatility analysis. Then overlay it with the greater leverage and much lower cost of options and the power increases to a much bigger degree.

A recently completed trade on Caterpillar (CAT) may help to provide further insight into just we look to do just that in the POWR Options service.

CAT was an A Rated -Strong Buy- stock in the POWR Ratings. It also was in the A Rated -Strong Buy-Industrial Machinery Industry. Ranked very highly at number 7 out of 78 within the industry. Strength across the board.

Yet, Caterpillar was a big underperformer compared to the overall market in 2023. The S&P 500 (SPY) had gained nearly 10% while CAT had dropped over 9% so far this year. Note how in the first two months of the year the SPY and CAT were much more highly correlated. (see chart below)

We expected CAT to start to head higher and close the comparative performance gap. A reversion back to a more traditional relationship with the S&P 500 seen earlier to start the year was the most probabilistic path. Not a guarantee, just a higher probability.

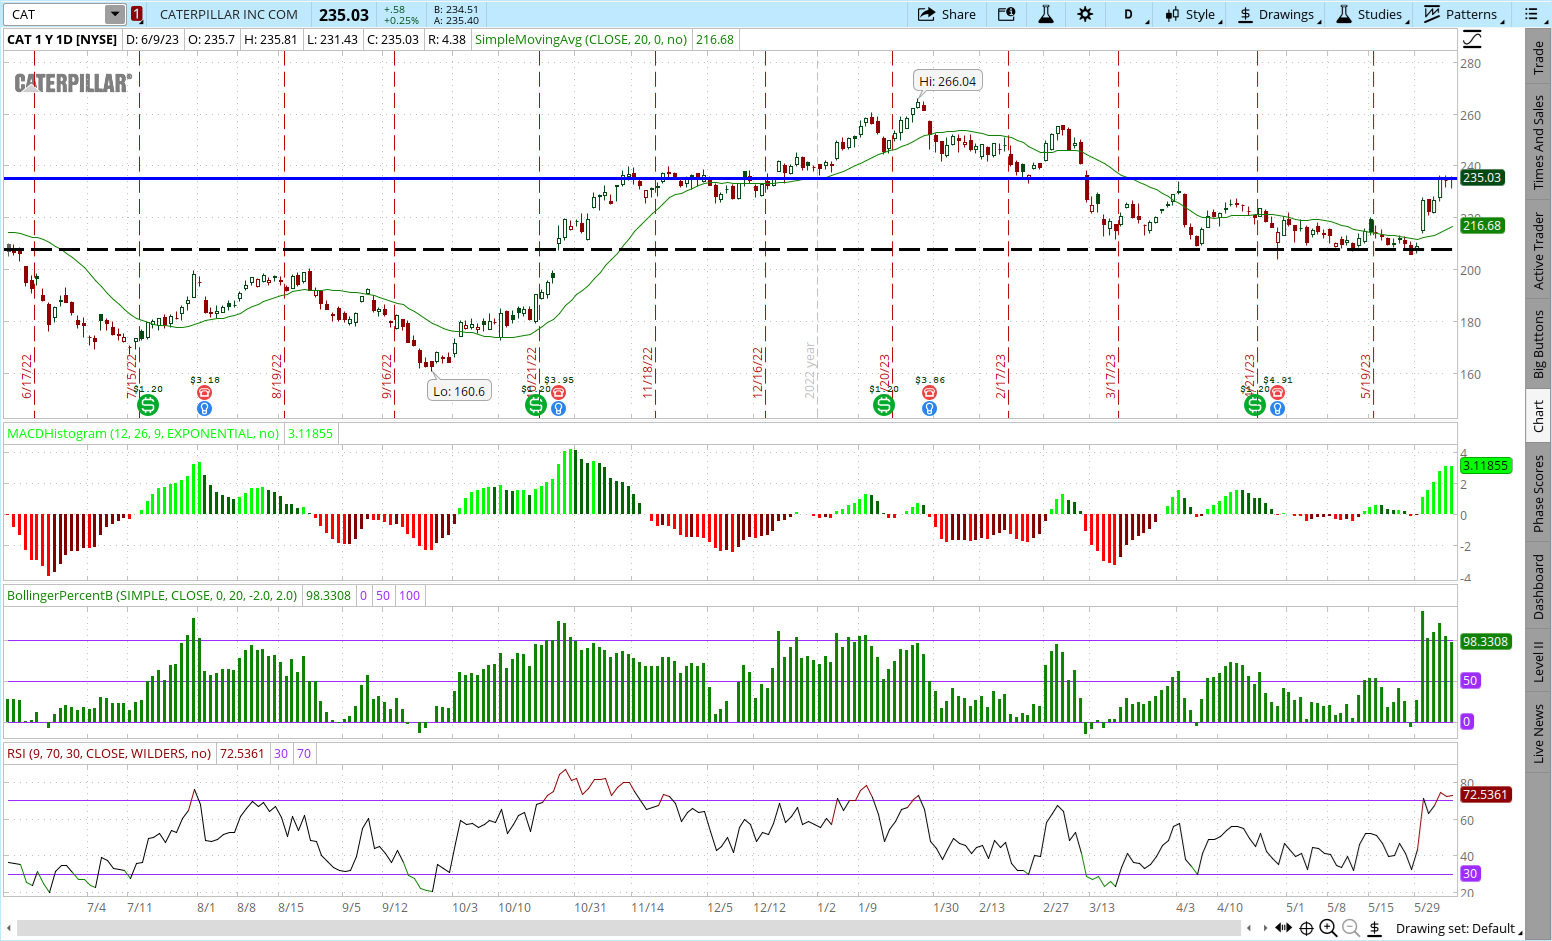
Caterpillar was also beginning to show some strength on a technical basis. Shares had once again held the critical $207 support level. 9-day RSI and Bollinger Percent B bounced off oversold readings. CAT broke above the downtrend line and the 20-day moving average. MACD generated a fresh new buy signal.

Caterpillar options were getting cheap as well. Current implied volatility (IV) stood at only the 20th percentile. This means option prices in CAT had been more expensive 80% of the time over the past 12 months.

On May 22, POWR Options entered a long call option position-buying the August $240 calls at $4.00. This is a bullish trade with a defined risk of $400 per option contract purchased. The most you can lose is the initial premium paid.

A few weeks later (June 7), POWR Options exited the CAT calls at $8.10. Net gain was $410 per contract, or just over 100%, given the original purchase price of $4.00 ($400) on May 22.

Why exit? The technicals had flipped from oversold to overbought and the comparative performance gap had converged.

Shares were stalling out at major resistance near $235. Bollinger Percent B hit an extreme well above 100. 9-day RSI exceeded overbought readings past 70. MACD also was getting overdone. Shares were now trading at a big premium to the 20-day moving average.

The chart below shows that CAT had made up a lot of lost ground versus the S&P 500 (SPY). While SPY did move higher by almost 3% since May 22, CAT had tripled that with a gain of 9%.

This trade highlights both the power of the POWR Ratings and the power of options. Certainly, buying CAT stock at around $215 on May 22 and selling it around $235 on June 7 would have been a nice trade. Net gain would have been just under 10%. Buying 100 shares would have required $21,500 in cash up front. Going fully margined still would have required $10,500. So not a cheap trade.

Compare that to buying the August $240 call in place of the stock.

The initial cost would have been just $400. Net gain would have been over 100%. So over 10 times the gain with under 2% of the cost compared to the stock trade in CAT.

Combining the POWR Ratings with the POWR Options methodology can provide traders with a powerful, safer way to lower the risk and increase potential returns. For those interested in learning further, you can find out more about POWR Options by checking it out below.

POWR Options

What To Do Next?

If you’re looking for the best options trades for today’s market, you should check out our latest presentation How to Trade Options with the POWR Ratings. Here we show you how to consistently find the top options trades, while minimizing risk.

If that appeals to you, and you want to learn more about this powerful new options strategy, then click below to get access to this timely investment presentation now:

How to Trade Options with the POWR Ratings

All the Best!

Tim Biggam

Editor, POWR Options Newsletter


CAT shares closed at $235.03 on Friday, up $0.58 (+0.25%). Year-to-date, CAT has declined -0.89%, versus a 12.84% rise in the benchmark S&P 500 index during the same period.


About the Author: Tim Biggam

Tim spent 13 years as Chief Options Strategist at Man Securities in Chicago, 4 years as Lead Options Strategist at ThinkorSwim and 3 years as a Market Maker for First Options in Chicago. He makes regular appearances on Bloomberg TV and is a weekly contributor to the TD Ameritrade Network “Morning Trade Live”. His overriding passion is to make the complex world of options more understandable and therefore more useful to the everyday trader. Tim is the editor of the POWR Options newsletter. Learn more about Tim’s background, along with links to his most recent articles.

More…

The post How To Profit By Combining The Power Of POWR Ratings And The Power Of Options appeared first on StockNews.com

https://www.entrepreneur.com/finance/how-to-profit-by-combining-the-power-of-powr-ratings-and/453911


How Lower Volatility and Oil Production Cuts Could Impact the Market…

I’m pleased with how the portfolio has shaped up over the last couple weeks. Of our 8 current positions, 6 are winners, one is breaking even, and one is a small loser. Several of the stocks have been in an uptrend as well. For the time being, we’re going to (likely) focus on smaller changes such as trimming or adding to positions. We’re at about 70% allocation of our cash, which I think is reasonable in this environment. Things can change in a hurry of course, but I’m content with the mix of stocks we have in the portfolio at this time. Let’s take a look at what’s going on in the S&P 500 (SPY) week. Read on for more….

(Please enjoy this updated version of my weekly commentary originally published June 8th in the POWR Stocks Under $10 newsletter).

Market volatility has really come crashing down since the debt ceiling scare ended with hardly a whimper. We’re seemingly experiencing the summer trading doldrums, where not much happens in the stock market from a macro perspective.

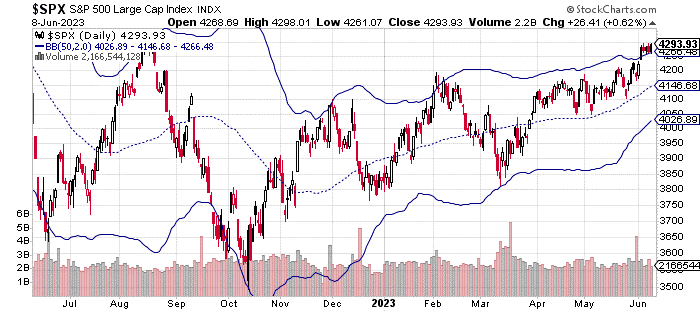
You can see in the chart above, the SPX (S&P 500 index) has breached the two-standard deviation upper barrier.

That doesn’t necessarily mean stocks are going to sell off as the bands are quite narrow due to a lower volatility environment. However, mean reversion is a definitely possibility in the coming days (just due to the law of averages).

Whether the market remains in this low volatility environment will mostly be determined by what the Fed says and does at the June and July FOMC meetings.

We have the June meeting coming next week and then it won’t be a shock to see a whole lot of nothing in the markets until after Independence Day.

The market continues to predict a pause in rate hikes for June. The futures market shows a 72.5% chance of the Fed doing nothing to rates next week.

Economic data has been mixed to the point where the Fed can likely justify not increasing rates (directly). Of course, they can accomplish some of their goals by jawboning (e.g. talking down the market).

In July, futures are showing a roughly 65% chance of a rate increase. That tracks with the mainstream narrative.

It has become apparent that the Fed isn’t done raising rates. However, at this stage, they aren’t in as much of a hurry to hike.

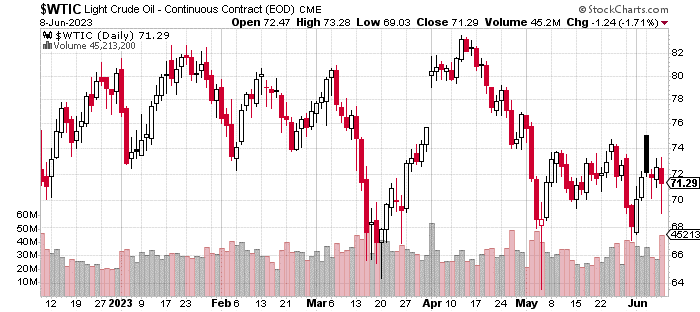
Moving on to oil, West Texas crude has been a bit volatile lately. Saudi Arabia announced production cuts, and the price of crude briefly spiked. However, it’s come back down to around $70 per barrel.

Keep an eye on oil as it could be a leading indicator for the economy (and thus, stocks). A price too high or too low is generally not good for stocks (for different reasons). However, where we are now in terms of price is pretty much a non-factor.

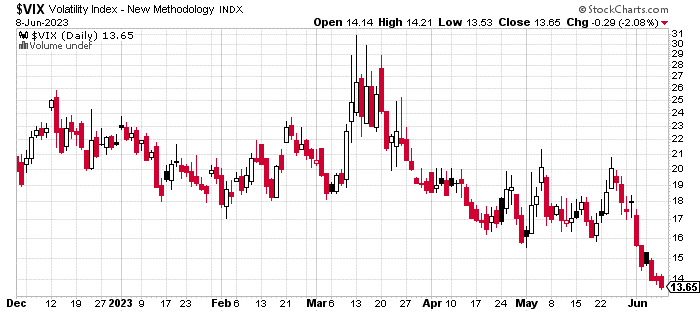
As mentioned earlier, volatility, as seen in the VIX chart below, has come crashing down in recent days. The price is now firmly below 15, which is often considered a low-volatility regime.

While we could see a short-term spike based on the news cycle or the Fed, I expect volatility to remain relatively low.

The summer months tend to be slower in terms of realized volatility (the actual movement of stocks). Thus, implied volatility (forward looking) tends to come down as well. That’s at least part of why the VIX is so low right now.

Let’s take a look at the portfolio.

What To Do Next?

The above commentary will help you appreciate where the market is going. But if you want to know the best stocks to buy now, then please check out my new special report:

3 Stocks to DOUBLE This Year

What gives these stocks the right stuff to become big winners, even in this challenging stock market?

First, because they are all low priced companies with the most upside potential in today’s volatile markets.

But even more important, is that they are all top Buy rated stocks according to our coveted POWR Ratings system and they excel in key areas of growth, sentiment and momentum.

Click below now to see these 3 exciting stocks which could double or more in the year ahead.

3 Stocks to DOUBLE This Year

All the Best!


Jay Soloff
Chief Growth Strategist, StockNews
Editor, POWR Stocks Under $10 Newsletter


SPY shares rose $0.19 (+0.04%) in after-hours trading Friday. Year-to-date, SPY has gained 12.84%, versus a % rise in the benchmark S&P 500 index during the same period.


About the Author: Jay Soloff

Jay is the lead Options Portfolio Manager at Investors Alley. He is the editor of Options Floor Trader PRO, an investment advisory bringing you professional options trading strategies. Jay was formerly a professional options market maker on the floor of the CBOE and has been trading options for over two decades.

More…

The post How Lower Volatility and Oil Production Cuts Could Impact the Market… appeared first on StockNews.com

https://www.entrepreneur.com/finance/how-lower-volatility-and-oil-production-cuts-could-impact/453906


Will the New Bull Market End on 6/14?

A new bull market began on Thursday and went a notch higher on Friday. That’s because the S&P 500 (SPY) has risen more than 20% from the October lows marking the beginning of a new bull market. Unfortunately signs point to it ending as early as 6/14. Why is that? And what happens next? 43 year investment veteran Steve Reitmeister spells out the rest in his newest market commentary below.

Bulls think there is no recession coming. And that the Fed is ready to pivot to lower rates. This has allowed stocks to “technically” start a new bull market given 2 closes above 4,292 for the S&P 500 (SPY) which marks 20% rise from October closing lows.

But why would the Fed pivot at this time to lower rates?

They have said all along that high rates were needed through end of the year. Plus all recent inflation data is still far too hot and nowhere near their 2% target. And let’s not forget that 2 other important central banks did recently raise rates as part of their plans to lower inflation (Canada & Australia).

So, what on earth would make bulls think a pivot to lower rates is coming anytime soon?

My sense is that we have a mild case of irrational exuberance taking place leading to some FOMO getting stocks to this elevated level. Next up comes the Fed announcement on Wednesday 6/14 where Chairman Powell will likely roll out his usual talking points:

  • More work to be done
  • Higher rates for longer
  • We will not be lowering rates before the end of 2023
  • A mild recession will likely take place before we start lowering rates
  • And yes, that will come with a rising of the unemployment rate

These statements would pour cold water on bulls leading to a fairly immediate 3-5% correction. And then the recession watch begins. If that takes place stocks go lower from there. And yes, that could very well be lower than we endured last October.

Reity, is it possible the Fed does pivot to lower rates on 6/14? And what would you do in that case?

Yes, it is possible…but like 5% chance given all the information in hand. Not to mention that the CME’s FedWatch Tool right now is predicting 69.4% chance of even higher rates by the time of 7/28 Fed meeting.

So even if they do hold rates steady this time around…they will likely raise the next time. Which means no pivot coming.

But if they did make that pivot to signal lower rates are imminent, then yes, I would become more bullish. That would lead to getting up towards 100% invested in stocks with a much more Risk On mix of small caps and growth stocks that are still trading under fair value.

The key with 6/14 is not to overreact to the 2pm ET press release. Investors often do a poor job of reading between the lines. The key is what Powell says at the press conference that starts at 2:30pm. That is often when he sets the record straight.

Whereas it is possible the Fed is ready to become more accommodative, I think all facts point to that being a foolish notion that likely will have stock retreating from current overripe levels.

Stay tuned and trade accordingly!

What To Do Next?

Discover my balanced portfolio approach for uncertain times.

This helps you participate in the current market environment while adjusting more bullish or bearish as necessary.

This strategy was constructed based upon over 40 years of investing experience to appreciate the unique nature of the current market environment.

Right now, it is neither bullish or bearish. Rather it is confused and uncertain.

Yet, given the facts in hand, we are most likely going to see the bear market coming out of hibernation mauling stocks lower once again.

Gladly we can enact strategies to not just survive that downturn…but even thrive. That’s because with 40 years of investing experience this is not my first time to the bear market rodeo.

If you are curious in learning more, and want to see the hand selected trades in my portfolio, then please click the link below to start getting on the right side of the action:

Steve Reitmeister’s Trading Plan & Top Picks >

Wishing you a world of investment success!


Steve Reitmeister…but everyone calls me Reity (pronounced “Righty”)
CEO, StockNews.com and Editor, Reitmeister Total Return


SPY shares rose $0.07 (+0.02%) in after-hours trading Friday. Year-to-date, SPY has gained 12.84%, versus a % rise in the benchmark S&P 500 index during the same period.


About the Author: Steve Reitmeister

Steve is better known to the StockNews audience as “Reity”. Not only is he the CEO of the firm, but he also shares his 40 years of investment experience in the Reitmeister Total Return portfolio. Learn more about Reity’s background, along with links to his most recent articles and stock picks.

More…

The post Will the New Bull Market End on 6/14? appeared first on StockNews.com

https://www.entrepreneur.com/finance/will-the-new-bull-market-end-on-614/453896


3 Education Stocks to Add to Your Watchlist

Advances in technology and the growing popularity of online learning have boosted the education industry. Therefore, it could be wise for investors to add fundamentally strong education stocks Stride (LRN), QuantaSing (QSG), and Lincoln Educational Services (LINC) to your watchlist. Read more.

The rapid shift towards online learning and technology-enabled education has emerged as a powerful force that shows no signs of slowing down.

Therefore, I think education stocks Stride, Inc. (LRN), QuantaSing Group Limited (QSG), and Lincoln Educational Services Corporation (LINC) might be ideal picks for your watchlist.

Escalating acceptance of online education over conventional modes owing to the COVID-19 outbreak is predicted to contribute majorly to the growth of the U.S. education market. Apart from this, the rise in popularity of online books as well as e-books is expected to embellish the growth of the industry.

The global U.S. education market is predicted to grow at a CAGR of nearly 4.5% until 2028 to reach approximately $2.30 trillion.

In addition, edTech is expected to continue leveraging technology and build complementarity with expertise across the learning ecosystem of trainers, learning consultants, universities, and coaches.

The worldwide EdTech market is anticipated to increase approximately $230 billion by 2028.

Take a look at the stocks mentioned above:

Stride, Inc. (LRN)

LRN is a technology-based education service company, provides proprietary and third-party online curriculum, software systems, and educational services to facilitate individualized learning for students primarily in kindergarten through 12th grade (K-12) in the United States and internationally.

LRN’s trailing-12-month asset turnover ratio of 1.10x is 9.9% higher than the 1.01x industry average. Its trailing-12-month return on total capital of 7.08% is 16.2% higher than the 6.10% industry average.

During the fiscal third quarter ended March 31, 2023, LRN revenues increased 11.5% year-over-year to $470.28 million. Its adjusted EBITDA increased 15% year-over-year to $103.89 million. Also, its net income per share increased 27.5% year-over-year to $1.30.

LRN’s EPS is expected to increase 38.5% year-over-year to $0.91 for the fiscal fourth quarter ending June 2023. The company’s revenue for the same quarter is expected to increase 1.2% year-over-year to $460.70 million. Also, it has surpassed revenue estimates in each of the trailing four quarters, which is impressive.

Shares of LRN have gained 32.8% year-to-date to close the last trading session at $41.53.

LRN’s POWR Ratings reflect its promising outlook. The stock has an overall rating of B, which translates to a Buy in our proprietary rating system. The POWR Ratings are calculated by considering 118 different factors, with each factor weighted to an optimal degree.

The stock has a B grade for Growth, Momentum, and Value. It is ranked #4 out of 20 in the B-rated Outsourcing – Education Services industry.

Beyond what is stated above, we’ve also rated LRN for Stability, Sentiment, and Quality. Get all LRN ratings here.

QuantaSing Group Limited (QSG)

Based in Beijing, QSG provides online learning services in the People’s Republic of China.

QSG’s trailing-12-month asset turnover ratio of 6.14x is 510.7% higher than the 1.01x industry average. Its trailing-12-month gross profit margin of 86.71% is 146.7% higher than the 35.15% industry average.

QSG’s revenue increased 16.8% year-over-year to RMB807.24 million ($117.54 million) in the fiscal first quarter that ended March 31, 2023. Its gross profit increased 22.5% year-over-year to RMB706.19 million ($102.83 million). Also, its adjusted net income per share increased 30% year-over-year to $0.13.

The stock has declined 2% over the past five days to close the last trading session at $8.87.

QSG’s robust prospects are reflected in its POWR Ratings. The stock has an overall B rating, equating to a Buy in our proprietary rating system.

QSG has a B grade for Sentiment. It is ranked #7 in the same industry.

Click here to see the additional POWR Ratings for QSG (Growth, Value, Stability, Quality, and Momentum).

Lincoln Educational Services Corporation (LINC)

LINC provides various career-oriented post-secondary education services to high school graduates and working adults in the United States. The company operates in two segments: Transportation and Skilled Trades; and Healthcare and Other Professions.

Its trailing-12-month asset turnover ratio of 1.24x is 23.4% higher than the 1.01x industry average. Its trailing-12-month gross profit ratio of 57.33% is 63.1% higher than the 35.15% industry average.

On May 16, LINC announced a new collaboration with Hunter Engineering, the leading name in the undercar service industry. Lincoln Tech’s Denver campus will become the latest site to house a Hunter Training Center, where students can train directly on patented Hunter equipment.

LINC’s revenue increased 5.7% year-over-year to $87.28 million in the fiscal first quarter, which ended March 31, 2023. Adjusted net income increased 82.6% year-over-year to $911 million. Also, adjusted EBITDA of campus operations increased 15.5% year-over-year to $11.55 million.

The stock has gained 16.9% over the past month to close the last trading session at $6.70.

LINC’s strong fundamentals are reflected in its POWR Ratings. The stock has an overall rating of B, equating to a Buy in our proprietary rating system.

LINC also has an A grade for Sentiment and a B in Value, Momentum, and Stability. It is ranked #3 in the same industry.

To access additional ratings for LINC’s Growth and Quality, click here.

What To Do Next?

Discover 10 widely held stocks that our proprietary model shows have tremendous downside potential. Please make sure none of these “death trap” stocks are lurking in your portfolio:

10 Stocks to SELL NOW! >


LRN shares were trading at $41.75 per share on Tuesday morning, up $0.22 (+0.53%). Year-to-date, LRN has gained 33.47%, versus a 12.32% rise in the benchmark S&P 500 index during the same period.


About the Author: Nidhi Agarwal

Nidhi is passionate about the capital market and wealth management, which led her to pursue a career as an investment analyst. She holds a bachelor’s degree in finance and marketing and is pursuing the CFA program.Her fundamental approach to analyzing stocks helps investors identify the best investment opportunities.

More…

The post 3 Education Stocks to Add to Your Watchlist appeared first on StockNews.com

https://www.entrepreneur.com/finance/3-education-stocks-to-add-to-your-watchlist/453633