Buy, Sell or Hold? Nike (NKE) and Foot Locker (FL)

Sticky inflation, the Fed’s aggressive rate hikes, and the US banking sector turmoil is paving the way for a recession this year. Thus, I think this is not the right time to consider investing in Foot Locker (FL) and NIKE (NKE). Read on.

Fed’s commitment to control inflation is taking a toll on consumer spending, impacting the recreation industry’s demand. Therefore, I think this is not the right time to invest in NIKE, Inc. (NKE) and Foot Locker, Inc. (FL).

The rise in obesity rates due to sedentary lifestyles and high-calorie diets, coupled with growing awareness of fitness benefits, is driving the growth of the Fitness and Recreational Sports Centers Market.

IMARC Group expects the global fitness and recreational sports centers market to reach $153.0 billion by 2028, exhibiting a CAGR of 4.9% until 2028.

On the other hand, in April 2023, prices had increased by 4.9% compared to April 2022, according to the 12-month percentage change in the Consumer Price Index, the monthly inflation rate for goods and services in the United States.

Inflation is still far from the Fed’s target rate of 2%, which might prompt the Fed to hike rates further.

Moreover, the economy saw a string of the biggest bank failures since the 2008-09 financial crisis, which had everyone from Federal Reserve staff economists to major banking CEOs talking about rising recession risks. Growing recessionary fear has dampened the consumer demand.

Stock to Hold:

NIKE, Inc. (NKE)

NKE designs, develops, markets, and sells men’s, women’s, and kids athletic footwear, apparel, equipment, and accessories worldwide.

On April 25, 2023, Cognizant Technology Solutions Corp. (CTSH) announced a new agreement to transform and support the technology operations of NKE, the world’s leading designer, marketer, and distributor of authentic athletic footwear, apparel, equipment, and accessories.

On May 4, NKE declared a quarterly dividend of $0.34, payable on July 5, 2023. The company pays an annual dividend of $1.36, which translates to a yield of 1.26% at the current price level. It has a four-year average dividend yield of 0.92%.

NKE’s forward EV/Sales of 3.29x is 189.8% higher than the industry average of 1.13x. Its forward P/S multiple of 3.25 is 293.8% higher than the industry average of 0.83.

NKE’s revenues increased 14% year-over-year to $12.39 billion in the fiscal first quarter that ended February 28, 2023. Its gross profit increased 6% year-over-year to $5.37 billion. However, its EPS declined 9.2% year-over-year to $0.79 and net income declined 11.2% year-over-year to $1.24 billion.

NKE’s revenue is expected to increase 2.8% year-over-year to $12.57 billion for the fiscal fourth quarter ended May 2023. On the other hand, its EPS is expected to decline 33.6% year-over-year to $0.66 in the same quarter. Also, it has surpassed revenue and EPS estimates in each of the trailing four quarters, which is impressive.

The stock has declined 15.3% over the past month to close the last trading session at $105.20.

The stock has an overall rating of C, which translates to a Neutral in our POWR Ratings system. The POWR Ratings are calculated by considering 118 different factors, with each factor weighted to an optimal degree.

NKE also has a C grade for Growth, Stability, Sentiment, and Momentum. It is ranked #10 out of 37 stocks in the Athletics & Recreation industry.

Click here to see the additional POWR Ratings for NKE (Value and Quality).

Stock to Sell:

Foot Locker, Inc. (FL)

FL is a footwear and apparel retailer in North America, Europe, Australia, New Zealand, Asia, and the Middle East.

FL’s forward EV/EBITDA of 10.55x is 11.8% higher than the industry average of 9.44x. Its forward EV/EBIT multiple of 17.62 is 37% higher than the industry average of 12.86.

On May 17, FL declared a quarterly dividend of $0.40, payable on July 28, 2023.

The company pays an annual dividend of $1.60, which translates to a yield of 6.18% at the current price level. It has a four-year average dividend yield of 3.33%.

During the fiscal first quarter that ended April 29, 2023, FL’s total revenue declined 11.3% year-over-year to $1.93 billion. Net income decreased 72.9% year-over-year to $36 million, while its EPS decreased 72.3% year-over-year to $0.38.

FL’s EPS is expected to decline 96.5% year-over-year to $0.04 in the fiscal second quarter ending July 2023. Its revenue is expected to decline 9% year-over-year to $1.88 billion for the same quarter.

The stock has plunged 44.9% over the past three months to close the last trading session at $24.61.

FL’s grim prospects are reflected in its POWR Ratings. The stock has an overall D rating, which translates to a Sell in our POWR Ratings system.

FL also has an F grade for Growth and Sentiment and a D in Momentum and Stability. It is ranked #36 in the same industry.

To access additional FL POWR Ratings for Value and Quality, click here.

10 Stocks to SELL NOW!

Discover 10 widely held stocks that our proprietary model shows have tremendous downside potential. Please make sure none of these “death trap” stocks are lurking in your portfolio:

10 Stocks to SELL NOW! >


NKE shares were trading at $105.84 per share on Tuesday morning, up $0.64 (+0.61%). Year-to-date, NKE has declined -8.99%, versus a 12.19% rise in the benchmark S&P 500 index during the same period.


About the Author: Nidhi Agarwal

Nidhi is passionate about the capital market and wealth management, which led her to pursue a career as an investment analyst. She holds a bachelor’s degree in finance and marketing and is pursuing the CFA program.Her fundamental approach to analyzing stocks helps investors identify the best investment opportunities.

More…

The post Buy, Sell or Hold? Nike (NKE) and Foot Locker (FL) appeared first on StockNews.com

https://www.entrepreneur.com/finance/buy-sell-or-hold-nike-nke-and-foot-locker-fl/453622



3 Energy Stocks to Add to Your Watchlist

The energy sector is expected to remain robust amid solid demand and the emergence of new oil and gas ventures. Hence, I think fundamentally strong Energy Transfer (ET), Valero Energy (VLO), and World Fuel Services (INT) could be ideal additions to your watchlist. Keep reading.

U.S. crude oil exports, already reaching impressive levels close to a record high in March, are poised to receive a significant boost next month. This surge is expected to be driven by substantial production cuts implemented by Saudi Arabia, which will also result in a further decline in U.S. crude inventories lingering near historic lows.

I think quality energy stocks Energy Transfer LP (ET), Valero Energy Corporation (VLO), and World Fuel Services Corporation (INT) might be poised to capitalize on industry tailwinds. So, these stocks might be ideal additions to your watchlist.

As per Forbes, U.S. oil production is on track to potentially set a new annual record this year, despite uncertainties. Monthly production figures for the first quarter of the year indicate a significant increase, surpassing the previous record set in 2019.

Additionally, the emergence of new oil and gas ventures in critical regions such as the Asia Pacific, the Middle East, and others is further fueling the demand for oilfield services.

According to a recent report by Consegic Business Intelligence, the global oilfield services market is expected to reach a value of $468.58 billion by 2030, expanding at a robust CAGR of 5.9%.

Furthermore, according to the International Energy Agency’s (IEA) recent Oil Market Report, global oil demand is projected to average 102 million barrels per day (mb/d) in 2023. This represents an increase of 1.3 mb/d compared to the demand levels seen in 2019.

Let us now discuss the stocks as mentioned earlier:

Energy Transfer LP (ET)

ET provides energy-related services and owns and operates one of the largest and most diversified portfolios of energy assets in the United States, with approximately 120,000 miles of pipeline and associated energy infrastructure.

ET’s trailing-12-month cash from operations of $10.03 billion is significantly higher than the $634.20 million industry average. Its trailing-12-month asset turnover ratio of 0.83x is 26.6% higher than the 0.65x industry average.

During the fiscal first quarter, ET completed the optimization project on Oasis Pipeline, adding more than 60,000 Mcf/d of natural gas takeaway capacity out of the Permian Basin. This expanded capacity allows ET to transport and deliver a greater volume of natural gas from the prolific Permian Basin, which is a major oil and gas producing region in the United States.

The company pays an annual dividend of $1.23, which translates to a 9.55% yield on the current share price. Its four-year dividend yield is 10.34%.

ET’s revenue amounted to $19 billion for the fiscal first quarter that ended March 31, 2023. Its operating income rose 11.7% year-over-year to $2.06 billion. The company’s adjusted EBITDA grew 2.8% year-over-year to $3.43 billion. Its net income attributable to partners came in at $1.11 billion, while net income per unit came in at $0.32.

The consensus EPS estimate of $0.30 for the fiscal third quarter ending September 2023 reflects a 5.1% year-over-year. Shares of ET have gained 8.6% year-to-date and 3.5% over the past month to close the last trading session at $12.89.

ET’s POWR Ratings reflect this promising outlook. The stock has an overall rating of B, which translates to a Buy in our proprietary rating system. The POWR Ratings are calculated by considering 118 different factors, with each factor weighted to an optimal degree.

It has a B grade for Value and Momentum. The stock ranks #12 in the 93-stock Energy – Oil & Gas industry.

In addition to the above-mentioned POWR Ratings, one can access ET’s additional ratings for Growth, Stability, Sentiment, and Quality here.

Valero Energy Corporation (VLO)

VLO manufactures and markets petroleum-based and low-carbon liquid transportation fuels and petrochemical products. The company operates in three segments: Refining; Renewable Diesel; and Ethanol.

VLO’s trailing-12-month cash from operations of $15.16 billion is significantly higher than the industry average of $634.20 million. Its trailing-12-month asset turnover ratio of 2.80x is 329.2% higher than the 0.65x industry average.

On May 9, VLO declared a regular quarterly cash dividend of $1.02 per share on common stock, payable on June 22, 2023.

The company pays an annual dividend of $4.08 per share, which yields 3.80% on the prevailing price level. Its dividend has grown at a 2.1% CAGR over the past three years and a 5.9% CAGR over the past five years.

VLO reported revenues of $36.44 billion in the fiscal 2023 first quarter (ended March 31, 2022). Its operating income improved 192.1% year-over-year to $4.04 billion. Adjusted net income attributable to VLO shareholders came in at $3.10 billion, up 228.4% year-over-year and its adjusted earnings per share grew 250% from the previous-year quarter to $8.27.

Street expects VLO’s EPS and revenue to amount to $5.31 and $37.21 billion in the fiscal second quarter ending June 2023. Moreover, the company surpassed the EPS estimates in each of the trailing four quarters, which is impressive.

The stock has gained marginally over the past five days to close the last trading session at $107.39.

VLO’s strong fundamentals are reflected in its POWR Ratings. It has an overall rating of B, which equates to Buy in our proprietary rating system.

It has an A grade for Quality and a B for Value. In the same industry, it is ranked #5.

Click here to see VLO’s additional ratings for Stability, Sentiment, Momentum, and Growth.

World Fuel Services Corporation (INT)

INT distributes fuel and related products and services in the aviation, marine, and land transportation industries worldwide.

INT’s trailing-12-month asset turnover ratio of 7.65x is remarkably higher than the 0.65x industry average. Its trailing-12-month cash per share of $3.49 is 347.7% higher than the industry average of $0.78.

On May 22, 2023, INT entered into a significant agreement with Neste, a leading energy company that creates solutions for combating climate change and accelerating a shift to a circular economy, for Sustainable Aviation Fuel (SAF), deepening their already strong partnership.

The deal aims to address the scarcity of SAF for European commercial, business, and general aviation customers by granting World Fuel greater access to this environmentally friendly fuel source.

By expanding the availability of renewable fuels such as SAF on a global scale, INT is actively advancing its mission to support customers and partners in reducing their carbon footprint and embracing sustainable practices.

INT’s revenue for the fiscal first quarter that ended March 31, 2023, increased marginally year-over-year to $12.48 billion. Its gross profit rose 13.8% year-over-year to $262.70 million and income from operation rose 56.4% over the prior-year quarter to $64.60 million.

Moreover, the company’s adjusted net income amounted to $22.80 million or $0.36 per share.

INT’s EPS for the fiscal second quarter ending June 2023, is expected to increase 20.7% year-over-year to $0.50. The company is expected to report revenue of $13.23 billion in the same quarter. The company has an excellent earnings surprise history, as it surpassed the consensus EPS estimates in each of the trailing four quarters.

The stock has gained 2.9% over the past month to close the last trading session at $23.84.

The stock has an overall rating of B, which equates to a Buy in our proprietary rating system.

In addition, the stock has an A grade for Value and a B for Growth and Sentiment. It is ranked #11 in the same industry.

Beyond what we have highlighted above, we have also given INT grades for Momentum, Stability, and Quality. Get all the INT ratings here.

10 Stocks to SELL NOW!

Discover 10 widely held stocks that our proprietary model shows have tremendous downside potential. Please make sure none of these “death trap” stocks are lurking in your portfolio:

10 Stocks to SELL NOW! >


ET shares were trading at $12.94 per share on Tuesday morning, up $0.05 (+0.39%). Year-to-date, ET has gained 14.37%, versus a 12.22% rise in the benchmark S&P 500 index during the same period.


About the Author: Kritika Sarmah

Her interest in risky instruments and passion for writing made Kritika an analyst and financial journalist. She earned her bachelor’s degree in commerce and is currently pursuing the CFA program. With her fundamental approach, she aims to help investors identify untapped investment opportunities.

More…

The post 3 Energy Stocks to Add to Your Watchlist appeared first on StockNews.com

https://www.entrepreneur.com/finance/3-energy-stocks-to-add-to-your-watchlist/453621


3 Pharmaceutical Stocks to Watch

The pharmaceutical industry is anticipated to grow due to rising chronic diseases and an aging population. Given the industry’s strong long-term prospects, quality stocks Novo Nordisk (NVO), Novartis (NVS), and Bristol-Myers Squibb (BMY) could be worth adding to your watchlist. Continue reading….

The pharmaceutical industry tends to perform steadily amid economic downturns, as it enjoys inelastic demand for its products and services. So, amid the possibility of a recession later this year or early next year, quality pharma stocks Novo Nordisk A/S (NVO), Novartis AG (NVS), and Bristol-Myers Squibb Company (BMY) could be wise investments.

According to the U.S. pharmaceutical industry statistics, the nation will represent 43.7% of the worldwide pharma market in 2023. In addition, the United States is estimated to spend $605 to $635 billion on pharmaceuticals by 2025.

The worldwide pharmaceutical industry is predicted to increase at a 5.4% CAGR to $1.44 trillion by 2027. Increasing chronic diseases and an aging population are two significant factors driving the pharmaceutical industry’s expansion.

Investors’ interest in pharma stocks is evident from VanEck Vectors Pharmaceutical ETF’s (PPH) 9.1% returns over the past nine months.

Let’s delve deeper into the fundamentals of the featured stocks.

Novo Nordisk A/S (NVO)

Headquartered in Bagsvaerd, Denmark, NVO is a global healthcare company engaged in discovering, developing, manufacturing, and marketing pharmaceutical products. It operates through two business segments: Diabetes and Obesity care; and Biopharm.

NVO’s trailing-12-month EBITDA of 46.13% is significantly higher than the industry average of 2.18%. Its trailing-12-month CAPEX/Sales of 8.14% is 75.2% higher than the industry average of 4.64%.

NVO has paid dividends for 40 consecutive years. Over the last three years, NVO’s dividend payouts have grown at 12.6% CAGR. NVO’s four-year average dividend yield is 1.71%. Its forward annual dividend of $2.36 translates to a 1.50% yield.

For the fiscal first quarter that ended March 31, 2023, NVO’s net sales increased 26.9% year-over-year to Kr53.37 billion ($7.68 billion), while its operating profit came in at Kr17.09 billion ($3.59 billion), up 30.6% year-over-year. The company’s net profit came in at Kr13.59 billion ($2.85 billion), and EPS Kr8.78, representing 39.4% and 41.2% increases year-over-year, respectively.

The consensus revenue estimate of $31.96 billion for the year ending December 2023 represents a 22.3% increase year-over-year. Its EPS is expected to grow 40% year-over-year to $5.05 for the same period. It surpassed EPS estimates in all four trailing quarters. NVO’s shares have gained 53.7% over the past nine months to close the last trading session at $157.14.

NVO’s POWR Ratings reflect this promising outlook. The stock has an overall rating of A, equating to a Strong Buy in our proprietary rating system. The POWR Ratings assess stocks by 118 different factors, each with its own weighting.

NVO has an A grade for Quality and a B for Stability, Growth, Value, Momentum, and Sentiment. It is ranked #3 out of 167 stocks in the Medical – Pharmaceuticals industry. Click here for the additional POWR Ratings for NVO.

Novartis AG (NVS)

Headquartered in Basel, Switzerland, NVS researches, develops, manufactures, and markets healthcare products worldwide through two segments: Innovative Medicines and Sandoz.

On May 4, 2023, Sandoz signed a distribution and collaboration deal with Adalvo for the exclusive rights to commercialize six pharmaceuticals in the major therapeutic areas of anti-infectives and oncology. These drugs, which are scheduled to launch in the mid-term of 2024 and have a market value of roughly $3 billion, will advance Sandoz’s product pipeline in the critical U.S. generics market.

NVS’ trailing-12-month gross profit margin of 71.17% is 27.6% higher than the industry average of 55.77%. Its trailing-12-month EBITDA margin of 35.60% is significantly higher than the industry average of 2.18%.

NVS has paid dividends for 26 consecutive years. Over the last three years, NVS’ dividend payouts have grown at 4.3% CAGR. NVS’ four-year average dividend yield is 3.60%. Its forward annual dividend of $3.50 translates to a 3.54% yield.

For the fiscal first quarter that ended March 31, 2023, NVS’ net sales increased 3.4% year-over-year to $12.95 billion. Its operating income grew marginally from the year-ago value to $2.86 billion. Also, its net income and EPS came in at $2.29 billion and $1.09, representing 3.4% and 9% year-over-year increases, respectively.

Analysts expect NVS’ revenue to increase 5.3% year-over-year to $53.21 billion for the fiscal year ending December 2023. Its EPS is expected to grow 14.3% year-over-year to $6.99 for the same period. It surpassed EPS estimates in all four trailing quarters. Over the past nine months, the stock has gained 24.1% to close its last trading session at $98.91.

NVS has an overall A rating, translating to Strong Buy in our POWR Ratings system. It has an A grade for Growth, Stability, and Quality and a B for Value and Sentiment. It is ranked first in the same industry.

Beyond what is stated above, we’ve also rated NVS for Momentum. Get all NVS ratings here.

Bristol-Myers Squibb Company (BMY)

BMY is a biopharmaceutical company offering pharmaceutical products for treating hematology, oncology, cardiovascular, immunology, fibrotic, neuroscience, and COVID-19 diseases.

BMY’s trailing-12-month gross profit margin of 78.46% is 40.7% higher than the industry average of 55.77%. Its trailing-12-month EBITDA margin of 42.79% is significantly higher than the industry average of 2.18%.

BMY has paid dividends for 33 consecutive years. Over the last three years, BMY’s dividend payouts have grown at 8.9% CAGR. BMY’s four-year average dividend yield is 3%. Its forward annual dividend of $2.28 translates to a 3.47% yield.

BMY’s net earnings increased 77% year-over-year to $2.27 billion in the fiscal first quarter that ended March 31, 2023. The company’s EPS came in at $1.07, up 81.4% year-over-year in the same period. Also, its total expenses decreased 14% year-over-year to $8.57 billion.

Street expects BMY’s revenue to increase marginally year-over-year to $46.68 billion for the year ending December 2023. Its EPS is expected to increase 4.4% year-over-year to $8.04 for the same period. It surpassed EPS estimates in all four trailing quarters. BMY’s shares have gained marginally intraday to close the last trading session at $65.66.

BMY’s strong fundamentals are reflected in its POWR Ratings. The stock has an overall rating of A, which equates to a Strong Buy in our proprietary rating system.

It is ranked #4 in the same industry. It has an A grade for Value and a B for Stability, Growth, and Quality. To see additional BMY ratings for Sentiment and Momentum, click here.

The Bear Market is NOT Over…

That is why you need to discover this timely presentation with a trading plan and top picks from 40 year investment veteran Steve Reitmeister:

REVISED: 2023 Stock Market Outlook >


NVO shares rose $1.35 (+0.86%) in premarket trading Monday. Year-to-date, NVO has gained 17.78%, versus a 12.40% rise in the benchmark S&P 500 index during the same period.


About the Author: Rashmi Kumari

Rashmi is passionate about capital markets, wealth management, and financial regulatory issues, which led her to pursue a career as an investment analyst. With a master’s degree in commerce, she aspires to make complex financial matters understandable for individual investors and help them make appropriate investment decisions.

More…

The post 3 Pharmaceutical Stocks to Watch appeared first on StockNews.com

https://www.entrepreneur.com/finance/3-pharmaceutical-stocks-to-watch/453501


Is This the Week to Buy Visa (V)?

Digital payments major Visa (V) reported strong growth across its business during the second quarter. Amid the uncertain macroeconomic environment, will it be wise to buy the stock this week? Read on to learn my view….

With the proliferation of the Internet, a radical shift from cash to digital transactions has enabled digital payment companies like Visa Inc. (V) to thrive. V should benefit as digital transactions continue to grow along with rising consumer spending.

In this piece, I have discussed several reasons why it could be wise to buy the stock now.

Online banking, mobile wallets, and payment apps have made digital payments increasingly convenient. The popularity of e-commerce has also contributed to the growth of digital transactions. Global digital payment revenues are expected to grow at a CAGR of 20.8% to reach $361.30 billion by 2030.

During the second quarter, V’s EPS and revenue exceeded analyst estimates. Its EPS came 5.2% above the consensus estimate, while its revenue beat analyst estimates by 2.5%. The company’s global quarterly payments volume increased 13% year-over-year, excluding Russia and China. Also, its processed transactions during the second quarter grew 12% year-over-year.

In the U.S., quarterly payments volume rose 10%, while its payments volume outside the U.S., excluding Russia and China, increased 17.5% year-over-year. Excluding intra-Europe, the total cross-border volume is up 32%, with cross-border travel volume at 130% in 2019. Visa Direct cross-border P2P transactions, excluding Russia, grew by nearly 50%.

V’s CEO Ryan Mclnerney said, “Visa’s strong fiscal second quarter performance reflects continued focus on our growth levers – consumer payments, new flows, and value-added services. While there is macroeconomic uncertainty, I feel confident in Visa’s ability to manage through changing environments.”

V’s stock has gained 15.7% in price over the past nine months and 6.4% over the past year to close its last trading session at $228.79.

Here’s what could influence V’s performance in the upcoming months:

Robust Financials

For the fiscal second quarter that ended March 31, 2023, V’s net revenues increased 11% year-over-year to $7.99 billion. The company’s non-GAAP net income increased 14.3% over the year-ago quarter to $4.38 billion. In addition, its non-GAAP EPS came in at $2.09, representing a 16.8% increase from the prior-year quarter.

Favorable Analyst Estimates

Analysts expect V’s EPS for fiscal 2023 and 2024 to increase 14.4% and 13.8% year-over-year to $8.58 and $9.77. Its fiscal 2023 and 2024 revenue is expected to increase 11% and 11.1% year-over-year to $32.55 billion and $36.15 billion.

V’s EPS and revenue for the quarter ending June 30, 2023, are expected to increase 6.6% and 10.8% year-over-year to $2.11 and $8.06 billion, respectively.

High Profitability

In terms of the trailing-12-month EBIT margin, V’s 66.94% is 222.8% higher than the 20.74% industry average. Its 50.59% trailing-12-month levered FCF margin is 233.7% higher than the 15.16% industry average. Likewise, its 0.37x trailing-12-month asset turnover ratio is 83.6% higher than the industry average of 0.20x.

Solid Historical Growth

V’s EBIT grew at a CAGR of 9% over the past three years. Its net income grew at a CAGR of 8.1% over the past three years. In addition, its EPS grew at a CAGR of 10.4% in the same time frame.

POWR Ratings Show Promise

V has an overall B rating, equating to a Buy in our proprietary POWR Ratings system. The POWR Ratings are calculated considering 118 distinct factors, with each factor weighted to an optimal degree.

Our proprietary rating system also evaluates each stock based on eight distinct categories. V has an A grade for Quality, consistent with its high profitability.

It has a B grade for Stability, in sync with its 0.97 beta. Its favorable analyst estimates justify its B grade for Sentiment.

V is ranked #3 out of 47 stocks in the Consumer Financial Services industry. Click here to access V’s Growth, Value, and Momentum ratings.

Bottom Line

V’s stock is trading above its 50-day and 200-day moving averages of $228.54 and $213.45, respectively, indicating an uptrend. Despite the current macroeconomic headwinds, V reported solid payments volume, earnings, and revenue growth in the first quarter.

Digital payments have grown significantly over the past few years, but there exists tremendous potential for long-term growth in consumer payments. According to PwC Global, the number of cashless transactions is expected to triple by 2030. Moreover, amid high-interest rates, credit card processors like V should benefit.

Given its robust financials, favorable analyst estimates, solid historical growth, and high profitability, it could be wise to buy the stock now.

How Does Visa Inc. (V) Stack Up Against Its Peers?

V has an overall POWR Rating of B, equating to a Buy rating. Check out these other stocks within the Consumer Financial Services industry with a B (Buy) rating: Regional Management Corp. (RM), EZCORP, Inc. (EZPW), and Mastercard Incorporated (MA).

The Bear Market is NOT Over…

That is why you need to discover this timely presentation with a trading plan and top picks from 40 year investment veteran Steve Reitmeister:

REVISED: 2023 Stock Market Outlook >


V shares fell $228.79 (-100.00%) in premarket trading Monday. Year-to-date, V has gained 10.55%, versus a 12.32% rise in the benchmark S&P 500 index during the same period.


About the Author: Dipanjan Banchur

Since he was in grade school, Dipanjan was interested in the stock market. This led to him obtaining a master’s degree in Finance and Accounting. Currently, as an investment analyst and financial journalist, Dipanjan has a strong interest in reading and analyzing emerging trends in financial markets.

More…

The post Is This the Week to Buy Visa (V)? appeared first on StockNews.com

https://www.entrepreneur.com/finance/is-this-the-week-to-buy-visa-v/453496


3 Big Changes Since The S&P 500 Was Trading This High

Higher interest rates and more expensive stock valuations combined with the cheapest implied volatility prices in years sets up ideally for a couple option strategies in SPY.

The last time the S&P 500 (SPY) was at such lofty levels was in August of last year. Back then the S&P 500 closed at $4305.20 on August 16 before plummeting to a low of just under $3500 in less than two months.

The S&P 500 has now regained virtually all the lost ground, finishing at $4282.37 on Friday.

But while things may seem very little changed from a price perspective, several other things have changed dramatically since the most recent highs in price last August. Let’s take a look at three of the biggest.

Interest Rates

Last August, interest rates were decidedly much lower than they are currently. The Fed Funds rate was at 2.25% back then versus the current Fed Funds rate of roughly 5%. This is more than double now than just less than nine months ago.

The widely followed 10-year interest rate has moved higher by just under 1% from 2.8% in August 2022 to the current yield of 3.7%. That may not seem like much, but it equates to more than a 30% increase.

Plus, recent Fed speak is pointing at even more potential rate increases in 2023. The CME Fed Watch tool is pointing at two additional ones.

Normally, higher interest rates tend to be a headwind for stock prices. Or at least traditional valuation multiples such as Price/Earnings (P/E) ratios. Yet, the past year has seen an expansion, not contraction, in the P/E ratio for the S&P 500.

Valuation

As we noted, the P/E multiple on the S&P 500 has actually expanded since last August even in the face of sharply higher interest rates. S&P 500 Price/Earnings was at 22.55 on August 16, 2022. The current P/E now stands at 24.79-or roughly a 10% expansion.

A look at the two biggest components of the S&P 500 (Apple and Microsoft) shows just how much their individual P/E ratios went up since the last time the S&P 500 was at this level. Apple P/E and MSFT P/E are both at by far the richest multiples over the past year-and far above last August.

Investors are placing a lot of faith in companies to improve their earnings over the coming quarters given the increased P/E and higher interest rate environment. We shall see if it is justified.

Implied Volatility (IV)

The VIX is a measure of 30-day implied volatility in the S&P 500. It tends to rise when stocks fall and fall when stocks. VIX is sometimes referred to as the “Fear Gauge” for this reason.

While the S&P 500 is on the verge of making new highs that exceed last August, the VIX just made a new multi-year low last seen in February 2020. Although the S&P 500 was a little bit higher last August 16 at $4305.20, VIX back then closed at 19.69. Compare that to Friday’s S&P 500 close of $4282.37 but with a corresponding VIX close of 14.60.

This huge drop in VIX from 19.69 back then to 14.60 now means option prices are currently way cheaper now than last time the S&P 500 was at a similar price last August.

How much cheaper? Let’s take a look!

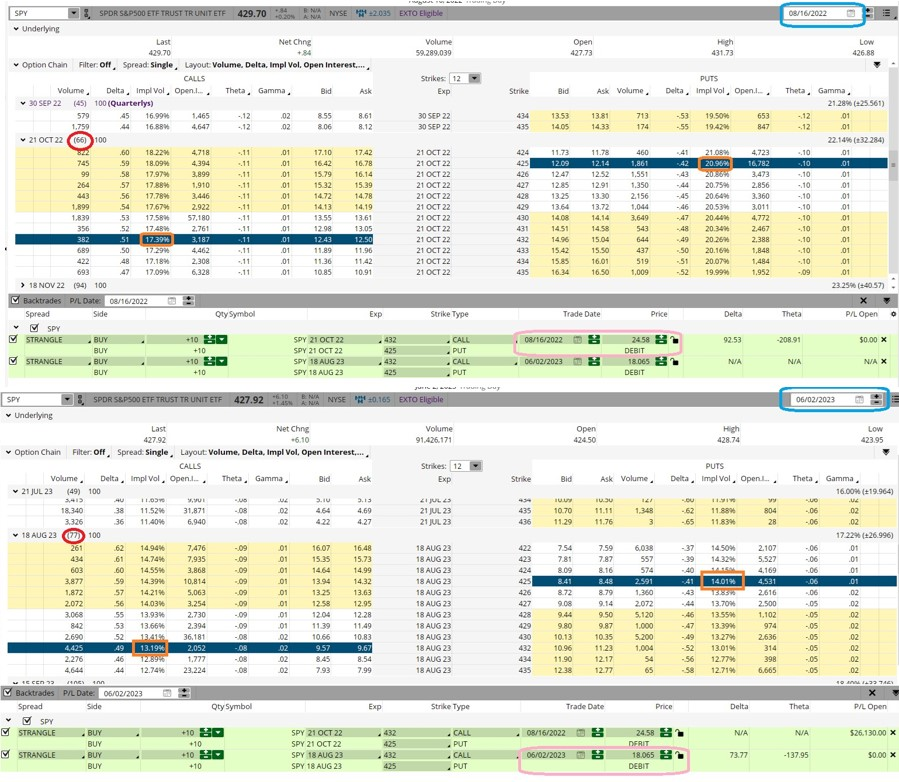
Below are two option montages showing option prices from August 16, 2022 and this past Friday- 6/2/2023.

The top montage shows the prices from 8/16/2022, the lower montage the prices from last Friday June 2, 2023. We used SPY instead of SPX for simplicity’s sake since more retail traders use SPY as the preferred way to trade the S&P 500.

As you can see, the SPY was slightly higher on 8/16/2022 by $1.78. We also looked at options that were expiring in just over two months-October 2022 expiration options (66 days to expiration or DTE) and August 2023 options (77 DTE). So, the August 2023 options back then had 11 more DTE.

A couple things jump out.

Buying the 66 DTE $432 call and $425 put (called a strangle) cost just over $24.50 back in August. This equates to roughly 5.7% of the $429.70 price of the SPY. We chose the two strikes since sPY is roughly in the middle of $432 and $425.

Compare that to buying the same $432 call/$425 put strangle but with 77 DTE now. It closed at just over $18 on Friday-or only 4.2% the $427.92 closing price of the SPY.

Usually, longer DTE makes option prices more, not less, expensive. So why is it so much cheaper now? Implied volatility.

The VIX back then was 19.69. Now it is at multi-year lows of 14.60.

That is reflected in the strangle IV of 19.17 from August 2022 (average the IV of $432 call and $425 put) versus only 13.60 average IV now.

Just looking at the put prices can help illuminate further.

Back in August, the $425 put was priced at roughly $12.10. This equates to 2.8% the price of the SPY at $429.70. DTE was 66.

Now the $425 put is trading at $8.45-or $3.65 cheaper. This now equates to under 2% the $427.92 closing price of SPY. Plus, there are 11 more days until expiration now on the August $425 puts. SPY is lower now than back then as well.

More DTE and a lower underlying price should cause put prices to go up, not down sharply. But thanks to the huge drop in IV, the puts are a heckuva lot cheaper now.

Investors and traders alike may want to consider playing option strangles as a defined risk way to play for a bona-fide breakout or breakdown. More bearish traders or investors looking to protect gains but leave the upside open should look at buying puts for a pullback or downside protection.

This is especially true given that rates have risen sharply and valuations have gone up as well. Plus, the drop in IV means it hasn’t been this cheap in years.

POWR Options

What To Do Next?

If you’re looking for the best options trades for today’s market, you should check out our latest presentation How to Trade Options with the POWR Ratings. Here we show you how to consistently find the top options trades, while minimizing risk.

If that appeals to you, and you want to learn more about this powerful new options strategy, then click below to get access to this timely investment presentation now:

How to Trade Options with the POWR Ratings

All the Best!

Tim Biggam

Editor, POWR Options Newsletter


SPY shares rose $0.16 (+0.04%) in premarket trading Monday. Year-to-date, SPY has gained 12.32%, versus a % rise in the benchmark S&P 500 index during the same period.


About the Author: Tim Biggam

Tim spent 13 years as Chief Options Strategist at Man Securities in Chicago, 4 years as Lead Options Strategist at ThinkorSwim and 3 years as a Market Maker for First Options in Chicago. He makes regular appearances on Bloomberg TV and is a weekly contributor to the TD Ameritrade Network “Morning Trade Live”. His overriding passion is to make the complex world of options more understandable and therefore more useful to the everyday trader. Tim is the editor of the POWR Options newsletter. Learn more about Tim’s background, along with links to his most recent articles.

More…

The post 3 Big Changes Since The S&P 500 Was Trading This High appeared first on StockNews.com

https://www.entrepreneur.com/finance/3-big-changes-since-the-sampp-500-was-trading-this-high/453495


Moving on From the Debt Ceiling…

Now that the debt ceiling debate appears to have been resolved, we could see more risk-taking among investors. That’s a good thing for smaller stocks, like the ones we buy for our portfolio. Below I take a closer look at what’s going on this week in the S&P 500 (SPY) and how this impacts our next move. Read on for more….

(Please enjoy this updated version of my weekly commentary originally published June 1st in the POWR Stocks Under $10 newsletter).

The debt ceiling deal has passed the House and looks set to pass the Senate. That’s been marginally good for stocks, with the S&P 500 (SPY) up about 3% over the last week.

There are still plenty of concerns for the economy, but it looks like the debt ceiling won’t be one of them.

It’s not really a surprise that the US avoided a default (the consequences of which could have been catastrophic).

The real surprise is that it didn’t come down to the very last minute for Washington to get a deal done. Attention will now shift back to the Fed and the fight against inflation.

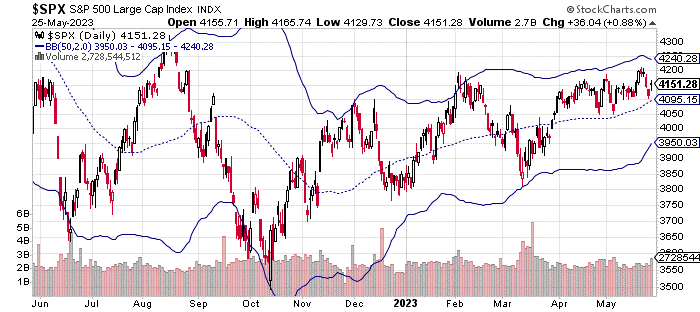
You can see in the chart above, the SPX (S&P 500 index) is near the top of its two standard deviation range.

That doesn’t necessarily imply it’s going to pull back, but mean reversion is a real thing with stocks, so there could be some selling pressure in the near future – albeit short-lived, most likely.

With the debt ceiling issues mostly out of the way, the jobs report tomorrow will be front and center for many investors.

The job market remains strong, which is both good and bad. It’s good because people have jobs (obviously). It’s bad because it makes it more likely that the Fed will continue raising rates to fight inflation.

The Fed doesn’t appear to be in a rush to raise rates at this stage, though. There’s currently an 80% chance of a rate hike pause at the June FOMC meeting (according to the futures market).

However, there’s over a 50% chance the Fed hikes rate at the July meeting.

The Fed is attempting to achieve a soft landing. That is, they want to combat inflation (sending it lower) without torpedoing the economy.

I’m not sure it’s possible, although it has been achieved in the past. We’ll have to wait and see if they can capture that magic this time around.

Volatility, as seen in the VIX chart below, wavered during heading into the final days of the debt ceiling debate.

However, you can see where the VIX is now approaching 15. Below 15 is generally considered a low volatility regime for the market.

It’s not unusual for market volatility to soften as we move into the summer vacation months.

However, it’s a bit different this year with at least one interest rate hike expected over the summer period.

Despite the Fed doing a reasonable job of telegraphing their moves, further rate hikes could introduce a measure of volatility into stocks in the coming weeks.

Ultimately though, we may be approaching a period where investors are willing to take more risks on stocks.

Lower volatility typically means investors will take more chances on small stocks and value names. That certainly implies good things for us, which is the area we tend to operate in.

What To Do Next?

If you’d like to see more top stocks under $10, then you should check out our free special report:

3 Stocks to DOUBLE This Year

What gives these stocks the right stuff to become big winners, even in this challeging stock market?

First, because they are all low priced companies with the most upside potential in today’s volatile markets.

But even more important, is that they are all top Buy rated stocks according to our coveted POWR Ratings system and they excel in key areas of growth, sentiment and momentum.

Click below now to see these 3 exciting stocks which could double or more in the year ahead.

3 Stocks to DOUBLE This Year

All the Best!

Jay Soloff
Chief Growth Strategist, StockNews
Editor, POWR Stocks Under $10 Newsletter


SPY shares closed at $427.92 on Friday, up $6.10 (+1.45%). Year-to-date, SPY has gained 12.32%, versus a % rise in the benchmark S&P 500 index during the same period.


About the Author: Jay Soloff

Jay is the lead Options Portfolio Manager at Investors Alley. He is the editor of Options Floor Trader PRO, an investment advisory bringing you professional options trading strategies. Jay was formerly a professional options market maker on the floor of the CBOE and has been trading options for over two decades.

More…

The post Moving on From the Debt Ceiling… appeared first on StockNews.com

https://www.entrepreneur.com/finance/moving-on-from-the-debt-ceiling/453462


NOW is it a Bull Market?

The tremendous rally for S&P 500 (SPY) this week has more people believing the bull market is at hand. 43 year investment veteran Steve Reitmeister weighs in with his updated market outlook at trading plan. (Spoiler alert: the future for stock prices may not be as bright as advertised). Get the full story below.

Stocks burst through stiff resistance at 4,200 for the S&P 500 (SPY) on Thursday. Then Friday put an exclamation point on the move by closing all the way up at 4,282.

Can we finally call this the new bull market?

And what does that mean for stocks in the days ahead?

These timely topics will be the focus of today’s commentary as well as our trading strategy going forward.

Market Commentary

There are already many people claiming this is the new bull market. And it might be true in time. However, right now stocks fail the official definition which is a 20% gain from the closing low.

So back on October 12, 2022 the S&P 500 closed at its lowest level of 3,577.03. Now add 20% to that equates to stocks needing to close above 4,292.44 to technically be called a new bull market.

(Yes, the market did hit an intraday low of 3,491 in October. But the official measure of bull and bear markets is based on closing prices like shared above).

So as of Friday’s close we are just 10 points away from an official crowning of a new bull market. That event would likely would spark a serious FOMO rally as more bears would throw in the towel, but first a word of caution…

DON’T BELIEVE THE HYPE!

Please remember that this rally was all about the announcement of a debt ceiling deal. Yet as shared in my recent article, that outcome was never in doubt because allowing a default is a nuclear option that neither party can afford.

When the irrational exuberance clears out next week investors will be right back to the same bull/bear debate as to whether we could be heading into a future recession. The most recent economic data was a mixed bag in that regard starting with ISM Manufacturing coming in well under expectations at 46.9. Plus, the forward-looking New Orders component plummeted to 42.6 point to weaker results ahead.

Yes, below 50 = contraction. And yes, we have been under 50 since November without a recession forming. But with it directionally getting worse, it is certainly not a positive for those calling for a bull market.

But Reity, how about the strong employment report Friday morning…certainly that is cause for some bullish cheer, right?

Wrong.

In general, the market should feel good about signs of economic strength like 339K jobs added which was a whopping 80% better than expected. However, it’s not a positive thing when the Fed is still very much pressing on the brakes of the economy to tamp down inflation.

One of the most resilient (aka sticky) forms of inflation is wage inflation. That is still too high because the labor market too strong. Thus, if you are a Fed official relying upon the recent data to make your next rate decision…then today’s far too strong employment report will only stiffen their hawkish resolve.

Today’s news still has the odds of a 6/14 rate hike at only 30%. Meaning investors are expecting a pause which the Fed has signaled is most likely. BUT the odds of a rate increase again in July just spiked to 70% which says that investors realize the Fed is not done with their hawkish regime (and that is NOT bullish).

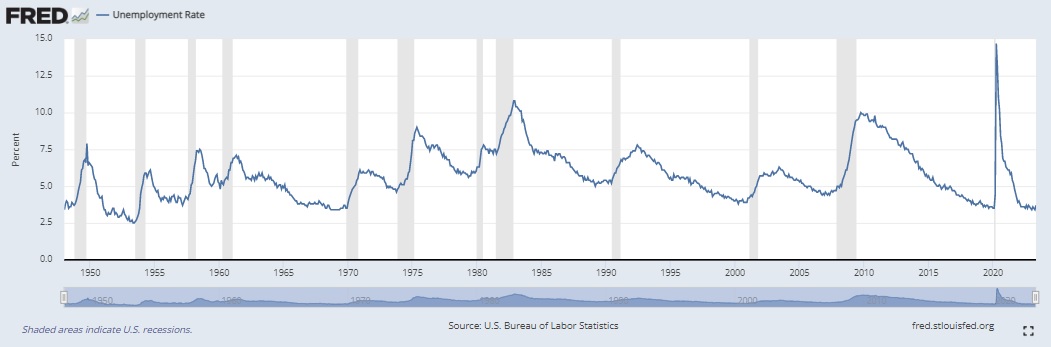
Now consider this chart of the unemployment rate just before the start of each recession:

It is abundantly clear that the unemployment rate is a lagging indicator of recessions as it is looking its effervescent best just before the next recession begins.

But indeed, we do need to see job adds actually roll negative, and unemployment rate spike to confirm that a recession is at hand. Given all the previous false signals of a recession forming…this is what will be necessary to convince investors to sell stocks in earnest once again.

Reity, is it possible that you are wrong and that this is actually the start of the new bull market?

Yes. That is possible which is why my 2 newsletter portfolios are basically 50% long at this time. What you might call balanced and ready to shift more bullish or bearish when more concrete evidence avails itself.

The key at this time is to remember the painful lessons from the 2007 to 2009 bear market (aka Great Recession). Stocks technically rang in a new bull market given a 20% rally from the November 2008 lows into early January 2009. Next thing you know stocks fall another 28% to a final and painful low in March 2009.

These false breakouts are far too common in the modern era given the undue influence played by computer based traders. Their favorite game is pushing stocks past key levels of resistance and support to draw in the suckers…then they reverse course locking in ample profits at the expense of others.

I will get more bullish when the odds of recession truly diminish. As already shared, that is not the case leaving my balanced approach in place.

At this stage I suspect stocks will play around in a range of 4,200 to 4,300 into the 6/14 Fed announcement where they likely to remind folks ONCE AGAIN that there is more work to do. And rates will stay higher for longer. And still don’t plan to lower rates til 2024. And that inflation is too sticky. And that their base case is that a recession will form before they are done with their efforts to get inflation down to 2% target.

Investors seem to have a monthly case of amnesia between Fed announcements. Then sell off as they are somehow surprised by what Powell says time and again at the press conferences. So, I think getting more aggressively long stocks before that mid June announcement seems quite unwise.

What To Do Next?

Discover my balanced portfolio approach for uncertain times. The same approach that has beaten the S&P 500 by a wide margin in recent months.

This strategy was constructed based upon over 40 years of investing experience to appreciate the unique nature of the current market environment.

Right now, it is neither bullish or bearish. Rather it is confused and uncertain.

Yet, given the facts in hand, we are most likely going to see the bear market coming out of hibernation mauling stocks lower once again.

Gladly we can enact strategies to not just survive that downturn…but even thrive. That’s because with 40 years of investing experience this is not my first time to the bear market rodeo.

If you are curious in learning more, and want to see the hand selected trades in my portfolio, then please click the link below to start getting on the right side of the action:

Steve Reitmeister’s Trading Plan & Top Picks >

Wishing you a world of investment success!


Steve Reitmeister…but everyone calls me Reity (pronounced “Righty”)
CEO, StockNews.com and Editor, Reitmeister Total Return


SPY shares rose $0.08 (+0.02%) in after-hours trading Friday. Year-to-date, SPY has gained 12.32%, versus a % rise in the benchmark S&P 500 index during the same period.


About the Author: Steve Reitmeister

Steve is better known to the StockNews audience as “Reity”. Not only is he the CEO of the firm, but he also shares his 40 years of investment experience in the Reitmeister Total Return portfolio. Learn more about Reity’s background, along with links to his most recent articles and stock picks.

More…

The post NOW is it a Bull Market? appeared first on StockNews.com

https://www.entrepreneur.com/finance/now-is-it-a-bull-market/453446


What’s the Better Foreign Telecom Stock? VEON Ltd. (VEON) vs. SoftBank Group (SFTBY)

The telecom industry is well-poised for robust long-term growth, driven by high demand for efficient data connectivity and managed services amid rapid digital transformation worldwide. Foreign telecom stocks VEON (VEON) and SoftBank (SFTBY) should benefit from the industry’s promising growth prospects. But let’s find out which of these stocks is a better buy now. Read on….

In this article, I evaluated two foreign telecom stocks, VEON Ltd. (VEON) and SoftBank Group Corp. (SFTBY), to determine which could generate better returns. I believe VEON is the better investment for reasons explained throughout this piece.

Despite several macroeconomic headwinds, the telecom industry is expected to maintain its growth trajectory this year and beyond, thanks to strong demand for high-speed data connectivity and value-added managed services. With the growing use of smartphones across the globe, the need for high-speed internet is increasing exponentially.

Furthermore, factors including improving operational efficiency, cutting operating costs, and rising use of advanced technologies like automation, IoT, cloud computing, blockchain, machine learning, AR&VR, and AI to encourage digital transformation are boosting the demand for telecom-managed services among enterprises across various industries such as retail, e-commerce, transport, and healthcare.

According to a report by Grand View Research, the global managed services market is expected to grow at a 13.6% CAGR from 2023 to 2030.

The continued importance of efficient connectivity worldwide brings numerous opportunities for communications service providers (CSPs). CSPs are delivering value to consumer and enterprise customers with connectivity options such as 5G fixed wireless access (FWA) and fiber and meeting the increasing demand for edge computing.

As per a report by Grand View Research, the global telecom services market size is projected to reach $2.87 trillion by 2030, growing at a 6.2% CAGR. Rising spending on next-gen wireless communication infrastructures due to the rapid shift in customer preferences toward the 5G network and cloud-based technology should primarily bolster the market’s growth.

VEON is a clear winner in three-month price performance, with 8.6% returns compared to SFTBY’s 2.8% decline. VEON has gained 27.6% over the past six months, while SFTBY plunged 10.4%. Also, VEON’s 56.2% gains over the past year are significantly higher than SFTBY’s decline of 7%.

Here are the reasons why we think VEON could perform better in the near term:

Latest Developments

On May 30, 2023, VEON announced that it had submitted the necessary documentation to Euroclear, Clearstream, and registrars for the cancellation of VEON’s Eurobonds held by its subsidiary, PJSC VimpelCom.

“The cancellation of VEON’s Eurobonds will pave the way for VEON to exit Russia in a way that we believe to be the optimal outcome for all our stakeholders – including our investors, creditors, customers and employees This cancellation is a non-cash transaction necessary for our timely exit from Russia; and protects VEON and its investors from a risk of double payments in the future,” said Kaan Terzioğlu, CEO of VEON Group.

On April 26, VEON incorporated a dedicated AdTech company, wholly owned by the VEON Group, to offer digital marketing services supporting VEON Group companies in addressing the rising digital advertising opportunity in VEON markets. With headquarters in Tashkent, Uzbekistan, VEON AdTech might help VEO digital operators in addressing a $1.30 billion market opportunity.

Recent Financial Results

According to preliminary results of the fiscal year that ended December 31, 2022, VEON’s mobile customers grew 2.7% year-over-year to 156.9 million, and its 4G users were 84.6 million, up 19.4% year-over-year. The company’s cash and cash equivalents came in at $3.11 billion, an increase of 27.9% from the previous year. Also, its net debt stood at $4.46 billion, down 45.1% year-over-year.

SFTBY’s net sales for the year that ended March 31, 2023, rose 5.6% year-over-year to ¥6.57 trillion ($47.19 billion). Its loss before income tax came in at ¥469.13 billion ($3.37 billion). The company reported net loss and loss per share of ¥970.14 billion ($6.97 billion) and ¥662.41, respectively. As of March 31, 2023, its total assets were ¥43.94 trillion ($315.58 billion) versus ¥47.54 trillion ($341.44 billion) as of March 31, 2022.

Valuation

In terms of trailing-12-month Price/Sales, VEON is currently trading at 0.17x, 86.1% lower than SFTBY, which is trading at 1.22x. VEON’s trailing-12-month EV/Sales ratio of 1.57 is 53% lower than SFTBY’s 3.34. Likewise, VEON’s trailing-12-month EV/EBITDA of 2.22x is significantly lower than SFTBY’s 14.37x.

Furthermore, VEON’s trailing-12-month Price/Cash Flow of 0.50x is 95.2% lower than SFTBY’s 10.30x.

Profitability

SFTBY’s trailing-12-month revenue is 13.5 times what VEON generates. However, VEON is more profitable, with a gross profit margin of 100% compared to SFTBY’s 50.65%. VEON’s EBITDA margin of 70.89% compared with SFTBY’s 23.23%.

In addition, SFTBY’s ROE and ROTC of 53.92% and 4.49% compared with SFTBY’s negative 7.1% and 1.21%, respectively.

POWR Ratings

VEON has an overall rating of B, which equates to a Buy in our proprietary POWR Ratings system. Conversely, SFTBY has an overall rating of D, translating to a Sell. The POWR Ratings are calculated considering 118 different factors, with each factor weighted to an optimal degree.

Our proprietary rating system also evaluates each stock based on eight distinct categories. VEON has a grade of B for Value, consistent with its lower-than-industry valuation. VEON’s trailing-12-month EV/Sales and EV/EBITDA of 1.57x and 2.22x are 12.1% and 76.8% lower than the respective industry averages of 1.79x and 9.58x.

SFTBY, on the other hand, has a grade of D for Value, consistent with its higher valuation relative to its peers. SFTBY’s trailing-12-month EV/Sales and EV/EBITDA of 3.34x and 14.37 are 86.4% and 50% higher than the industry averages of 1.79x and 9.58x, respectively.

Of the 45 stocks in the A-rated Telecom – Foreign industry, VEON is ranked #5, while SFTBY is ranked last.

Beyond what we’ve stated above, we have also rated both stocks for Growth, Stability, Momentum, Quality, and Sentiment. Click here to view VEON Ratings.  Get all SFTBY ratings here.

The Winner

Given sustained demand for high-speed internet and managed services among consumers and enterprises, growing spending on wireless communication infrastructures, and rapid technological innovation, the long-term prospects of the telecom industry look bright. Therefore, leading foreign telecom companies VEON and SFTBY are positioned to benefit significantly from the industry tailwinds.

However, SFTBY’s relatively poor financials, elevated valuations, low profitability, and weak growth prospects make its rival, VEON, a better buy now.

Our research shows that the odds of success increase when one invests in stocks with an Overall Rating of Strong Buy or Buy. View all the top-rated stocks in the Telecom -Foreign industry here.

What To Do Next?

Get your hands on this special report with 3 low priced companies with tremendous upside potential even in today’s volatile markets:

3 Stocks to DOUBLE This Year >


SFTBY shares were unchanged in premarket trading Friday. Year-to-date, SFTBY has declined -0.83%, versus a 10.72% rise in the benchmark S&P 500 index during the same period.


About the Author: Mangeet Kaur Bouns

Mangeet’s keen interest in the stock market led her to become an investment researcher and financial journalist. Using her fundamental approach to analyzing stocks, Mangeet’s looks to help retail investors understand the underlying factors before making investment decisions.

More…

The post What’s the Better Foreign Telecom Stock? VEON Ltd. (VEON) vs. SoftBank Group (SFTBY) appeared first on StockNews.com

https://www.entrepreneur.com/finance/whats-the-better-foreign-telecom-stock-veon-ltd-veon/453390


Buy, Hold or Sell: Target (TGT) vs. Walmart (WMT)

US retail sales rebounded in April as consumers showed resiliency. The strength in the retail market should bode well for retail giants Target (TGT) and Walmart (WMT). But should one buy, hold, or sell these stocks? Read more to find out.

The retail industry has showcased remarkable resilience and stability despite the macroeconomic headwinds. Factors such as moderated price levels, strength in the labor market, and wage growth have bolstered consumers’ purchasing power, thereby benefiting retail businesses and driving up their stock prices.

Retail behemoths Target Corporation (TGT) and Walmart Inc. (WMT) are both among the largest retail businesses in the US. However, after carefully examining their fundamental aspects, I conclude that WMT might be an ideal buy, while investors might wait for a better entry point in TGT. The reasons supporting this conclusion are explained throughout the article.

As per the latest data from the US Census Bureau, the US overall retail sales last month were up 0.4% from March and up 1.6% year over year. NRF chief economist Jack Kleinhenz added, “Shoppers are being selective and price-sensitive, but we continue to expect that spending will see modest gains through the course of the year.”

Greater internet accessibility and governmental emphasis on digitalization are poised to create attractive opportunities for retail investment in emerging markets.

While TGT has declined 6.8% year-to-date, WMT has gained 3.3% over the same time period. Moreover, TGT has declined 14.9% over the past year, but WMT has gained 16.2% over the same year. TGT closed its last trading session at $138.93, and WMT closed at $146.42.

Here are the reasons why I believe WMT could be a better pick:

Recent Financial Results

During the fiscal first quarter that ended April 29, 2023, TGT’s total revenue rose marginally year-over-year to $25.32 billion. Its selling, general and administrative expenses grew 5.5% from the previous-year quarter to $5.03 billion

Its operating income declined 1.4% year-over-year to $1.33 billion. Additionally, its adjusted EPS decreased 6.2% from the prior-year quarter to $2.05.

On the other side, WMT’s total revenue increased 7.6% year-over-year to $152.30 billion in the fiscal first quarter that ended April 30, 2023. Its operating income increased 17.3% from the previous-year quarter to $6.24 billion. WMT’s adjusted EPS grew 13.1% year-over-year to $1.47.

Analysts Expectations

TGT’s revenue is expected to decline 1.1% year-over-year to $25.76 billion in the fiscal second quarter ending July 2023. However, WMT’s revenue is expected to increase 4.6% year-over-year to $158.35 billion in the same quarter.

Moreover, both the companies’ revenue is expected to rise marginally and 3.2% year-over-year to $26.58 billion and $156.28 billion in the fiscal third quarter ending October 2023.

Past Performance

While TGT’s EBIT and EBITDA have declined at CAGRs of 1.3% and 2.8% over the past three years, WMT’s EBIT and EBITDA have increased at CAGRs of 3.7% and 5.4% in the same period.

Profitability

TGT’s 3.61% trailing-12-month EBIT margin is lower than WMT’s 4.09%. TGT’s trailing-12-month levered FCF margin of negative 0.74% is lower than WMT’s 3.38%. Moreover, TGT’s trailing-12-month cash from operations of $6.68 billion is lower than WMT’s $32.23 billion.

Valuation

In terms of forward EV/Sales, TGT is currently trading at 0.74x, which is higher than WMT’s 0.72x. TGT’s 5.00 forward Price/Book multiple is higher than WMT’s 4.82.

POWR Ratings

WMT has an overall rating of A, which equates to a Strong Buy in our proprietary POWR Ratings system. On the other hand, TGT has an overall rating of C, translating to a Neutral. The POWR Ratings are calculated considering 118 different factors, each weighted to an optimal degree.

Our proprietary rating system also evaluates each stock based on eight distinct categories. While TGT’s 24-month beta of 1.21 complements its D grade in Stability, WMT’s 24-month beta of 0.64 justifies its B grade in Stability.

Moreover, TGT has a C grade for Sentiment, in sync with its mixed analyst estimates. On the other side, WMT has an A grade for the same, consistent with its optimistic analysts’ estimates.

Among the 37 stocks in the A-rated Grocery/Big Box Retailers industry, TGT is ranked #31, while WMT is ranked #7.

Beyond what we’ve stated above, we have also rated both stocks for Value, Momentum, Sentiment, and Quality. Click here to view TGT’s ratings. Access all the ratings of WMT here.

The Winner

The US retail industry seems resilient in the face of uncertainties. Both companies operating in this sector are well-positioned to capitalize on the growing market opportunities.

However, as discussed above, rising expenses and declining profits might weigh further on TGT’s performance. So, I think one could wait for a better entry point for TGT.

On the other hand, considering WMT’s superior year-to-date performance, the impressive one-year gain, and the higher closing price, WMT is a better buy here.

Our research shows that the odds of success increase when one invests in stocks with an Overall Rating of Strong Buy or Buy. View all the top-rated stocks in the Grocery/Big Box Retailers industry here.

10 Stocks to SELL NOW!

Discover 10 widely held stocks that our proprietary model shows have tremendous downside potential. Please make sure none of these “death trap” stocks are lurking in your portfolio:

10 Stocks to SELL NOW! >


WMT shares were trading at $146.42 per share on Monday afternoon, up $0.26 (+0.18%). Year-to-date, WMT has gained 4.08%, versus a 10.25% rise in the benchmark S&P 500 index during the same period.


About the Author: Kritika Sarmah

Her interest in risky instruments and passion for writing made Kritika an analyst and financial journalist. She earned her bachelor’s degree in commerce and is currently pursuing the CFA program. With her fundamental approach, she aims to help investors identify untapped investment opportunities.

More…

The post Buy, Hold or Sell: Target (TGT) vs. Walmart (WMT) appeared first on StockNews.com

https://www.entrepreneur.com/finance/buy-hold-or-sell-target-tgt-vs-walmart-wmt/453088


Will Resolving the Debt Ceiling Touch Off the Next Market Rally?

We continue to put our idle money to work in our portfolio. For the time being, we’ll be focusing on additions rather than deletions (although that could change based on new info). Once the debt ceiling stuff is resolved, I think the market will be in a nice position to rally for the second half of the year. Hopefully, we’ll have that purely political headache out of the way by next week. Let’s take a look at what’s going on this week….

(Please enjoy this updated version of my weekly commentary originally published May 25th in the POWR Stocks Under $10 newsletter).

Stocks have pulled back a bit and volatility has gone up as we approach the debt ceiling. This is no surprise (both the behavior of the market and the fact that the ceiling has yet to be resolved).

That being said, I still think there’s a less than a 1% chance we actually default on debt. One way or another, something will get worked out.

In the meantime, life goes on. Tech stocks jumped 2.5% on Thursday after great earnings from NVIDIA (NVDA).

Speaking of NVDA, as overvalued as it may be (trading at 218x earnings), the company has posted some very positive news.

The stock is now valued at almost a trillion dollars and it’s the 5th largest component of the S&P 500 (SPY).

The S&P 500 pulled back to its 50-day moving average before the NVDA news sent it back higher. It remains within the 2 standard deviation range that you can see on the chart above. Positive news on a debt ceiling deal could send the index much higher in a hurry.

Of course, as we get closer to the actual debt limit, volatility will go up and stocks will go down. Most people don’t believe an actual default will happen, but the financial markets have no choice but to react as we come down to the wire.

There isn’t a whole lot of meaningful economics news this week, although PCE comes out after this issue is released. The metric (which is an alternative to CPI in terms of looking at inflation) could potentially move the market if the results are a big surprise.

The markets are now at about a 50/50 chance on a rate increase at the next Fed meeting in June.

We have a few more weeks until then, so things can obviously change. PCE results may go some way towards convincing the markets one way or the other what the Fed is going to decide.

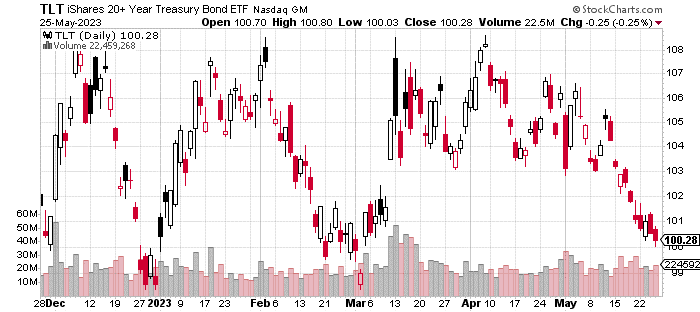
Looking at the chart of iShares 20+ Year Treasury Bond ETF (TLT), bond prices have come back down recently.

Keep in mind, bond prices move inverse to bond yields, so this move is likely due to the greater expectations of a rate hike than what we saw a few weeks ago. If there is a rate hike, I strongly suspect it will be the last one of the year.

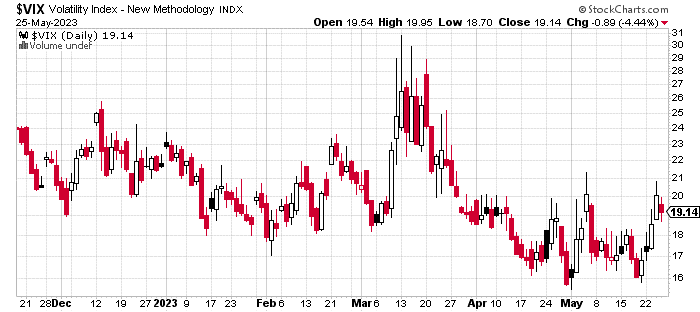
The VIX (the market volatility index) has climbed a fair amount over the last week as a response to the approaching debt ceiling.  Again, this isn’t really a surprise under the circumstances. The index is still under 20, which is about the long-term median level. .

The 18-20 level in the VIX doesn’t tend to be a place the index sits at for very long (as you can see in the chart above). It’s kind of a transition level historically.

Whether market volatility goes higher or lower depends almost entirely on what happens with the debt negotiations. We’ll know a lot more next week.

What To Do Next?

If you’d like to see more top stocks under $10, then you should check out our free special report:

3 Stocks to DOUBLE This Year

What gives these stocks the right stuff to become big winners, even in this challeging stock market?

First, because they are all low priced companies with the most upside potential in today’s volatile markets.

But even more important, is that they are all top Buy rated stocks according to our coveted POWR Ratings system and they excel in key areas of growth, sentiment and momentum.

Click below now to see these 3 exciting stocks which could double or more in the year ahead.

3 Stocks to DOUBLE This Year

All the Best!

Jay Soloff
Chief Growth Strategist, StockNews
Editor, POWR Stocks Under $10 Newsletter


SPY shares were unchanged in after-hours trading Friday. Year-to-date, SPY has gained 10.25%, versus a % rise in the benchmark S&P 500 index during the same period.


About the Author: Jay Soloff

Jay is the lead Options Portfolio Manager at Investors Alley. He is the editor of Options Floor Trader PRO, an investment advisory bringing you professional options trading strategies. Jay was formerly a professional options market maker on the floor of the CBOE and has been trading options for over two decades.

More…

The post Will Resolving the Debt Ceiling Touch Off the Next Market Rally? appeared first on StockNews.com

https://www.entrepreneur.com/finance/will-resolving-the-debt-ceiling-touch-off-the-next-market/453029