The Fallacy of the Bullish Argument

40 year investment veteran Steve Reitmeister does not buy the bullish argument that is gaining speed as the S&P 500 (SPY) closes above 4,200. In fact, he says the set up for a serious correction and thus warns investors not to get SUCKED into this rally as the rug is about to get pulled out. Discover why along with a timely trading plan in the fresh commentary below.

The headlines on Friday are bragging about stocks making new highs since the bear market began a year ago. This is breeding a fresh round of optimism that the new bull market is soon at hand.

Yes, technically speaking stocks are up over 20% on the S&P 500 from the October lows. But digging below the surface shows a much less bullish picture making this feel like yet another in a long line of sucker’s rallies before stocks head lower again.

Full details on why that is the case along with trading plan to follow in this week’s market commentary.

Market Commentary

Let’s start with the headline statements.

That being with the S&P 500 (SPY) closing at 4,205 today it has risen just over 20% from the October lows of 3,491.

Second, the S&P 500 is up +9.5% in 2023 alone and made new highs today.

These are both very bullish statements and will make some bears consider throwing in the towel. But before doing that please consider the following chart comparing the equally balanced version of the S&P 500 (RSP) versus the index which is dominated by technology mega caps:

Yes, that -0.4% loss for the equal weighed version of the S&P 500 provides a stark contrast from the bullish version of the market that some are trying to sell us.

Now let’s share some corresponding facts from FinViz as we break down year to date results by market cap:

There we see that the S&P 500 gain of 9.5% on the year is a total fallacy as it is ONLY accumulating to the few mega caps that have bolted ahead by 23%.

These moves were only amplified this week as NVDA had that stellar beat on Wednesday evening engorging the mega caps once again into the Friday close.

What Does It REALLY Mean?

That investors are in actually in Risk Off mode. That they only feel safe invested in a small group of the best long term holdings like FAANG and a few of their closest buddies. Very few other groups are feeling the love…and thus, hard to say that this feels like the start of the new bull market.

Remember that new bull markets are brought on by BROAD BASED buying of stocks with smaller, growthier stocks leading the way. That’s because those same stocks were the most beaten down allowing for dramatic bounces from oversold bottoms.

THAT IS NOT HAPPENING NOW!

And thus, there is just no way for me to be bullish. Especially as the recent round of enthusiasm was about the resolution of the debt ceiling deal which I discussed earlier in the week as a side show distraction.

This feels like there are only 2 choices from here:

First, the bull market is real which leads to a broadening out of stock groups moving higher. Especially small caps which again are flat on the year.

For this to happen bears would need to throw in the towel. This is going to be hard to do at the moment with the Fed committed to higher rates through end of the year where they even admit that they except a recession to happen before inflation is finally under control.

A true Fed pivot to start lowering rates is the likely catalyst to get the bears on board of the bullish bandwagon. Those thinking that will happen at the upcoming meeting on June 14th are hitting the meth pipe a bit too hard given an array of recent statements from multiple Fed officials that they have MORE WORK TO DO.

Also emboldening the Feds view was a higher than expected PCE Price Index report on Friday. With the Fed being “data dependent” this sign of inflation still being too hot will only further embolden them to keep rates aloft through end of the year.

The second, and more likely outcome, at this stage is that we are getting set up for a serious correction.  This is where this mega cap mirage of a runs rally out of steam allowing the real Risk Off trepidation of investors to head into a broad based retreat for the overall market.

And yes, this sell off could extend to a return of the bear market…but for that to happen we need to see stronger proof that a recession is a near certainty reawakening the bear from its recent slumber.

The reason for PROOF of recession is that investors are tired of hearing about the “possibility” of recession. That is kind of like the Boy Who Cried Wolf at this stage. Investors will need to see blood dripping from those fangs to believe recession is truly here and thus time to sell off stocks in earnest.

For me this continues to be the highest probable outcome. I explained it in full in this recent article: Why Steve Reitmeister is Becoming More Bearish.

The quicker version is to remind folks that 12 of the last 15 times the Fed has raised rates they created a recession…not a soft landing as intended.

This time around the Fed is enacting the most aggressive rate hiking regime in history. And they admit that a recession is the likely outcome to put an end to inflation.

So, if the Fed is predicting this outcome…and usually becomes worse than they expect…and they have their hands on the driving wheel…then recession and deeper bear market is the most likely outcome.

That potential correction probably starts once the Debt Ceiling deal is done and investors look around to find nothing more to cheer. Or perhaps its right after the 6/14 Fed rate hike announcement where Powell has to remind investors ONCE AGAIN that their work is far from done…and rates will not go down til 2024…and yes, they still predict a recession before all is done.

Again, I think this is the most likely outcome. But still possible that recession never comes and a real bull market emerges. The environment for that just is not at hand…and thus warning folks not to get pulled into the suckers rally underway now.

How should you invest at this time?

More on that in the section below…

What To Do Next?

Discover my balanced portfolio approach for uncertain times. The same approach that has beaten the S&P 500 by a wide margin in recent months.

This strategy was constructed based upon over 40 years of investing experience to appreciate the unique nature of the current market environment.

Right now, it is neither bullish or bearish. Rather it is confused and uncertain.

Yet, given the facts in hand, we are most likely going to see the bear market coming out of hibernation mauling stocks lower once again.

Gladly we can enact strategies to not just survive that downturn…but even thrive. That’s because with 40 years of investing experience this is not my first time to the bear market rodeo.

If you are curious in learning more, and want to see the hand selected trades in my portfolio, then please click the link below to start getting on the right side of the action:

Steve Reitmeister’s Trading Plan & Top Picks >

Wishing you a world of investment success!


Steve Reitmeister…but everyone calls me Reity (pronounced “Righty”)
CEO, StockNews.com and Editor, Reitmeister Total Return


SPY shares rose $0.53 (+0.13%) in after-hours trading Friday. Year-to-date, SPY has gained 10.25%, versus a % rise in the benchmark S&P 500 index during the same period.


About the Author: Steve Reitmeister

Steve is better known to the StockNews audience as “Reity”. Not only is he the CEO of the firm, but he also shares his 40 years of investment experience in the Reitmeister Total Return portfolio. Learn more about Reity’s background, along with links to his most recent articles and stock picks.

More…

The post The Fallacy of the Bullish Argument appeared first on StockNews.com

https://www.entrepreneur.com/finance/the-fallacy-of-the-bullish-argument/453014


Investors: DON’T Get Fooled by This Suckers Rally

The S&P 500 (SPY) seems to be breaking out into bull market territory above 4,200. However, history shows many examples of how this could be nothing more than a Suckers Rally. That’s why you should tune into Steve Reitmeister’s most recent market commentary including a clear trading plan and top picks for this unique market environment. Get the full story below.

Stocks rallied this past week on the news that a debt ceiling showdown is likely to be averted. To that I say a big, hearty…

DUH!

That’s because politicians never leave their finger in this light socket for long. It is always magically resolved in the nick of time.

When the smoke cleared from this rally investors realized they do not have the resolve to truly break into bullish territory above 4,200 for the S&P 500 (SPY). This likely means more limbo and trading range lie ahead as investors await a REAL catalyst to resolve the bull/bear debate once and for all.

Let’s review why this is the case…and what potential catalysts are on the calendar that could produce the next big move for the stock market.

Market Commentary

The short version of my current market outlook was nicely summarized as follows from my previous commentary:

“There has been a tug of war taking place all year between bulls and bears. It would seem that bulls grabbed the early lead given how stocks shot up near 4,200 by early February…but since then stocks have traded in a narrow range where bulls & bears seem fairly balanced.

Bears will say that the storm clouds are still forming for a recession and deeper bear market thanks to a hawkish Fed dead set on creating a recession to put an end to high inflation.

Bulls will say that the long feared recession keeps NOT happening. And maybe never will. Thus, the lows are already in and the new long term bull market has already begun.

Right now, these 2 opposing views are pretty evenly matched creating a narrow trading range and a considerable drop in volatility. That sleepy action will end when the bulls or bears can wave the victory flag. Until then…the sleepy range bound action will continue.”

(Read the full version of the above commentary here: The WORST Stock Market Ever- Part 2)

Even though stocks rallied this week up to 4,200. Truly nothing has changed to convincingly win the bull/bear battle. In fact, most of the substantive recent news has been negative.

Like Retail Sales coming in at only +1.6% year over year. When you remove +4.9% for inflation (CPI) it shows a -3.3% drop for US retail.

This fits in with the general high inflation narrative that consumers become fearful of waiting to purchase products that leads to a seeming boom in GDP in the near term. This is followed by an economic cliff as demand has been pulled forward. Indeed, that precursor to recession may be happening now.

Those looking to the Fed for signs of a pivot to lower rates should be disappointed by what they heard this week.

First was the Dallas Fed President Logan who said current data does not justify pausing rates hikes yet. Next on Friday morning Chairman Powell was giving a speech reemphasizing that inflation is still far too high and that the Fed would stay “steadfast” in their goal to lower prices.

This means that bulls should once again be disappointed to hear the hawkish resolve the Fed is likely to reiterate at the next announcement on June 14th. But even that is not enough to win the day for bears either.

Investors will need to see unequivocal proof of a recession on the way for the bear market to reemerge. This would have stocks breaking below the 200 day moving average at 3,976 and likely retesting the October lows of 3,491…if not lower. (That break below 3,976 should be your trigger to get more bearish).

This has us back on “catalyst watch” for any events that end this bull/bear stand off in convincing fashion. Here is the roll call of the key events on the calendar that could serve as that catalyst:

5/25 Jobless Claims– This will not be strong enough by itself as investors would look for collaboration from the 6/2 Government Employment Situation report. However, if Jobless Claims start to approach 300,000 per week, then historically that has pointed to the time that the unemployment rate is about to rise for quite a while.

5/31 ADP Employment, JOLTs– 2 other jobs reports that often serve as leading indicators of what is in store with monthly Government Employment Situation.

6/1 ISM Manufacturing, Jobless Claims- there have been MANY weak readings for ISM Manufacturing without truly signaling a recession was at hand. However, this is still one of the key monthly reports to monitor on the health of the economy.

6/2 Government Employment Situation- Job adds are expected to keep ebbing lower down to 180,000 this month. Note that population growth demands 150,000 job adds per month to keep the unemployment rate level. So, any movement under that mark could have investors predicting even worse readings ahead. Also, many eyes will be on the Wage Inflation component as that sticky inflation has been clearly bothersome to the Fed.

6/5 ISM Services- Has been in positive territory at 53.4 last month. But if that cracks under 50 into contraction territory it definitely would increase the odds of a recession ahead.

6/14 Fed Meeting- More investors are expecting that they will pause raising rates. But that is quite different than pivoting to lower rates which they still claim is a 2024 event. So, the Powell press conference that follows the rate hike decision will be closely watched for clues of what comes next.

All in all, I still believe we should take the Fed at their word that a recession will take place before inflation is properly tamed. And once that Pandoras Box is opened…then things can get ugly in a hurry with much lower stock prices on the way. That is why I am not tempted to join the bulls even as they are knocking on the door with a potential breakout above 4,200.

Reity, are you saying its not possible to break out above 4,200 now?

I am not saying that because with the stock market anything is possible.

However, looking back at history there have been many false starts to a new bull market that later failed…and failed miserably.

Most notable is the greater than 20% rally from November 2008 through early Jan 2009 that technically marked a new bull market. This sucked in a lot of excited investors only for the bear market to return with a vengeance with lower lows on the way (focus on the arrows in the chart below).

So just breaking above 4,200 for a little while without a clear fundamental catalyst would not entice me to chase stocks because of the great likelihood of it being a “suckers rally“.

Yes, at some point the emergence of the next bull market will make a lot of sense. Right now it simply doesn’t given the still high odds of recession ahead which begets lower corporate earnings and lower share prices (the market has always worked this way…and suspect always will).

So, please continue to stay balanced with in your portfolio which means about 50% long stocks. Then when the CLEAR bull or bear catalyst emerges, then make the rest of your moves to join that bandwagon.

What To Do Next?

Discover my balanced portfolio approach for uncertain times. The same approach that has beaten the S&P 500 by a wide margin in recent months.

This strategy was constructed based upon over 40 years of investing experience to appreciate the unique nature of the current market environment.

Right now, it is neither bullish or bearish. Rather it is confused and uncertain.

Yet, given the facts in hand, we are most likely going to see the bear market coming out of hibernation mauling stocks lower once again.

Gladly we can enact strategies to not just survive that downturn…but even thrive. That’s because with 40 years of investing experience this is not my first time to the bear market rodeo.

If you are curious in learning more, and want to see the hand selected trades in my portfolio, then please click the link below to start getting on the right side of the action:

Steve Reitmeister’s Trading Plan & Top Picks >

Wishing you a world of investment success!


Steve Reitmeister…but everyone calls me Reity (pronounced “Righty”)
CEO, StockNews.com and Editor, Reitmeister Total Return


SPY shares fell $0.64 (-0.15%) in after-hours trading Friday. Year-to-date, SPY has gained 9.88%, versus a % rise in the benchmark S&P 500 index during the same period.


About the Author: Steve Reitmeister

Steve is better known to the StockNews audience as “Reity”. Not only is he the CEO of the firm, but he also shares his 40 years of investment experience in the Reitmeister Total Return portfolio. Learn more about Reity’s background, along with links to his most recent articles and stock picks.

More…

The post Investors: DON’T Get Fooled by This Suckers Rally appeared first on StockNews.com

https://www.entrepreneur.com/finance/investors-dont-get-fooled-by-this-suckers-rally/452555


Keep Tabs on These 3 Promising Bank Stocks

The risks pertaining to the U.S. banking system continue to make investors and depositors jittery. However, some foreign banks present an attractive investment opportunity. Given the concerns over the prospects of domestic banks, it could be wise to add fundamentally strong foreign bank stocks Barclays (BCS), Deutsche Bank (DB), and Erste Group Bank (EBKDY) to one’s watchlist. Read more….

The recent troubles of the U.S. banking industry are well known. The Federal Reserve’s aggressive rate hikes since last year were one of the reasons for the collapse of the three regional banks this year. These bank failures were the biggest since the financial crisis of 2008.

Despite assurances that the banking system is safe, investors remain concerned. In this scenario, investors could look beyond boundaries as foreign banks have stable growth prospects and are available at attractive valuations. To that end, it could be wise to add fundamentally strong foreign bank stocks Barclays PLC (BCS), Deutsche Bank Aktiengesellschaft (DB), and Erste Group Bank AG (EBKDY) to one’s watchlist.

Before diving deeper into the fundamentals of these stocks, let’s discuss what’s happening in the U.S. banking industry and why it could be prudent to add these foreign bank stocks to one’s watchlist.

The failures of Silicon Valley Bank, Signature Bank, and the First Republic Bank were largely due to depositors’ lack of confidence in their ability to stay afloat, leading them to panic. Investors took their deposits out in a hurry, causing a bank run. A chunk of those deposits has now reached the higher-yielding money market funds. For the week ended May 17, 2023, total money market fund assets increased by $13.56 billion to $5.34 trillion.

Investors’ angst remains elevated after regional bank PacWest Bancorp (PACW) confirmed it was exploring strategic options, including a sale. The bank has said that it is in talks with investors. The bank recently reported that its deposits declined by 9.5% for the week ended May 5, 2023. Fitch downgraded the Long-Term Issuer Default Rating for PACW.

Furthermore, U.S. banks are also highly likely to face several regulatory challenges like increased capital requirements, heightened supervision, stricter risk management, increased disclosure, etc.

Tighter credit standards are also expected to lead to an increase in their operational costs and reduce their lending volumes, piling further pressure on their profitability. Citing a rapidly deteriorating operating environment, Moody’s cut the outlook on the U.S. banking system to Negative from Stable.

Considering these factors, adding these featured foreign banking names to one’s watchlist could be wise, given their growth prospects amid higher interest rates and discounted valuation.

Let’s take a closer look at their fundamentals.

Barclays PLC (BCS)

Headquartered in London, the United Kingdom, BCS provides various financial services in the United Kingdom, Europe, the Americas, Africa, the Middle East, and Asia. The company operates through two segments, Barclays UK and Barclays International divisions. It offers financial services, such as retail banking, credit cards, wholesale banking, investment banking, wealth management, and investment management services.

On April 24, 2023, BCS announced a strategic partnership with British Gas. The partnership was launched with an offer of a 50% discount on a Hive Thermostat Mini for Barclays UK residential mortgage customers.

Barclays UK’s Head of Sustainability, Nick Stace, said, “We want it to be easier and more affordable for customers to make their homes more efficient. Offering the Hive Thermostat Mini at a discount is one way we can do this for our UK residential mortgage customers, alongside our Greener Home Reward, which provides a cash reward of up to £2,000 towards the cost of making bigger energy efficiency-related home improvements.”

In terms of forward non-GAAP P/E, BCS’ 5.29x is 37.7% lower than the 8.49x industry average. Its 0.92x forward Price/Sales is 54.1% lower than the 2.01x industry average. Likewise, its 0.36x trailing-12-month Price/Book is 63% lower than the 0.97x industry average.

BCS’ total income for the first quarter ended March 31, 2023, increased 11.4% year-over-year to £7.24 billion ($9 billion). Its profit after tax increased 25.7% over the prior-year quarter to £2.04 billion ($2.54 billion). In addition, its attributable profit increased 27% year-over-year to £1.78 billion ($2.21 billion).

Its EPS came in at 11.3p, representing an increase of 34.5% year-over-year. Also, its return on average tangible shareholders’ equity came in at 15%, compared to 11.5% in the prior-year quarter.

Analysts expect BCS’ revenue for the quarter ending June 30, 2023, to increase 4.2% year-over-year to $8.50 billion. Its EPS for fiscal 2024 is expected to increase 13% year-over-year to $1.69. Over the past six months, the stock has gained 4.2% to close the last trading session at $7.92.

BCS’ POWR Ratings reflect this positive outlook. BCS has an overall rating of B, which translates to a Buy in our proprietary rating system. The POWR Ratings assess stocks by 118 different factors, each with its own weighting.

It is ranked #4 out of 88 stocks in the Foreign Banks industry. It has an A grade for Momentum and a B for Value and Sentiment. Click here to see the other ratings of BCS for Growth, Stability, and Quality.

Deutsche Bank Aktiengesellschaft (DB)

Based in Frankfurt am Main, Germany, DB provides corporate and investment banking and asset management products and services to private clients, corporate entities, and institutional clients worldwide. It operates through the Corporate Bank, Private Bank, and Asset Management segments.

In terms of forward non-GAAP P/E, DB’s 5.65x is 33.4% lower than the 8.49x industry average. Its 0.69x forward Price/Sales is 65.5% lower than the 2.01x industry average. Likewise, its 0.28x trailing-12-month Price/Book is 71.6% lower than the 0.97x industry average.

For the first quarter ended March 31, 2023, DB’s net interest income increased 19% year-over-year to €3.42 billion ($3.69 billion). Its net revenue increased 4.8% year-over-year to €7.68 billion ($8.30 billion). The company’s profit attributable to DB shareholders rose 9.2% year-over-year to €1.30 billion ($1.40 billion). Also, its EPS came in at €0.61, representing an increase of 10.9% year-over-year.

For the quarter ending June 30, 2023, DB’s revenue is expected to increase 15.3% year-over-year to $7.82 billion. Its EPS for fiscal 2023 is expected to increase 2.2% year-over-year to $1.87. Over the past nine months, the stock has gained 18.1% to close the last trading session at $10.58.

DB’s POWR Ratings reflect solid prospects. It has an overall rating of B, which translates to Buy in our proprietary rating system.

Within the same industry, it is ranked #7. It has an A grade for Momentum and a B for Value and Sentiment. To see the other ratings of DB for Growth, Stability, and Quality, click here.

Erste Group Bank AG (EBKDY)

Headquartered in Vienna, Austria, EBKDY provides a range of banking and other financial services to retail, corporate, and public sector customers. The company operates through Retail, Corporates, Group Markets, Asset/Liability Management & Local Corporate Center, Savings Banks, and Group Corporate Center segments. It provides mortgage and consumer loans, investment products, current accounts, and savings products.

In terms of forward GAAP P/E, EBKDY’s 5.13x is 42.3% lower than the 8.89x industry average. Its 1.25x forward Price/Sales is 37.9% lower than the 2.01x industry average. Likewise, its 0.61x trailing-12-month Price/Book is 36.7% lower than the 0.97x industry average.

EBKDY’s net interest income for the first quarter ended March 31, 2023, increased 27.1% year-over-year to €1.77 billion ($1.91 billion). Its net result attributable to owners of the parent increased 32.3% year-over-year to €593.60 million ($641.18 million). The company’s operating result rose 56.9% year-over-year to €1.26 billion ($1.36 billion).

Analysts expect EBKDY’s revenue for the quarter ending June 30, 2023, to increase 27.5% year-over-year to $2.76 billion. Its EPS for fiscal 2023 is expected to increase 21.2% year-over-year to $3.26. Over the past nine months, the stock has gained 40.3% to close the last trading session at $16.72.

EBKDY’s strong fundamentals are reflected in its POWR Ratings. It has an overall rating of B, which translates to Buy in our proprietary rating system.

It is ranked #5 in the Foreign Banks industry. It has a B grade for Value, Stability, and Sentiment. Click here to see the other ratings of EBKDY for Growth, Momentum, and Quality.

10 Stocks to SELL NOW!

Discover 10 widely held stocks that our proprietary model shows have tremendous downside potential. Please make sure none of these “death trap” stocks are lurking in your portfolio:

10 Stocks to SELL NOW! >


BCS shares rose $0.01 (+0.13%) in premarket trading Friday. Year-to-date, BCS has gained 4.63%, versus a 10.42% rise in the benchmark S&P 500 index during the same period.


About the Author: Dipanjan Banchur

Since he was in grade school, Dipanjan was interested in the stock market. This led to him obtaining a master’s degree in Finance and Accounting. Currently, as an investment analyst and financial journalist, Dipanjan has a strong interest in reading and analyzing emerging trends in financial markets.

More…

The post Keep Tabs on These 3 Promising Bank Stocks appeared first on StockNews.com

https://www.entrepreneur.com/finance/keep-tabs-on-these-3-promising-bank-stocks/452511


Bulls Back in Charge?

It has been a nice week for stocks, and if the debt ceiling issue gets resolved without too much hassle, we could see further rallying. It goes without saying, but it’s a lot easier to make money when the S&P 500 (SPY) is going up, even if our portfolio is less correlated than large caps to the broad market. That said we still made additional changes to the portfolio this week to prepare ourselves for what’s ahead. Read on to get my latest take on the current market conditions and where I think it heads next….

(Please enjoy this updated version of my weekly commentary originally published in the POWR Stocks Under $10 newsletter).

As I mentioned above, stocks are looking a lot stronger this week. While the debt-ceiling is the primary issue to investors, the odds are that it will get resolved before any sort of actual default happens.

Once the self-inflicted drama passes us by, the focus will return to inflation, Fed meetings, and other economics news.

The summer tends to slow down in terms of market action. However, this year may be a bit different as the summer FOMC meetings will be closely watched.

As I said last week, I prefer a bigger picture of market conditions rather than looking at day to day moves.

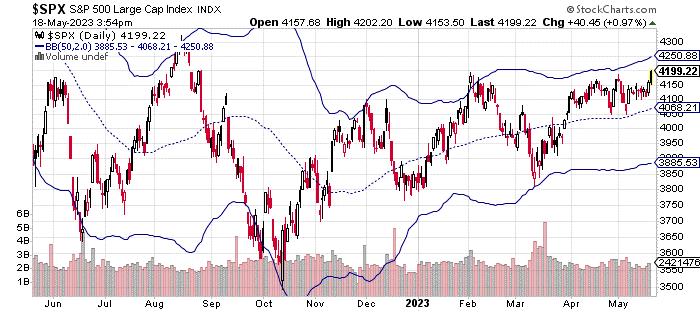
The S&P 500 (SPY) has had a nice week so far, but as you can see in the chart above, we aren’t even 2 standard deviations from the 50-day moving average.

Obviously, this doesn’t mean the rally will continue. However, we also haven’t seen a sharp enough move higher to necessarily expect a bout of profit taking before the weekend.

Economics and earnings news were fairly uneventful this week. Walmart (WMT) posted stronger than expected results, raising profit and revenue guidance for the year.

Retail sales numbers were also solid for the month of April. All in all, the consumer spending picture still looks positive.

With the economy remaining resilient, it’s difficult to say whether the Fed will raise rates at the next meeting (in June).

The market is about 65% sure they won’t raise rates, but that could change pretty quickly based on new economic data.

I don’t think we need another quarter point rate hike, but the Fed generally doesn’t ask for my opinion.

A brush with default (the debt-ceiling stuff) could change the Fed’s mind, but once again, I don’t expect an actual default to occur.

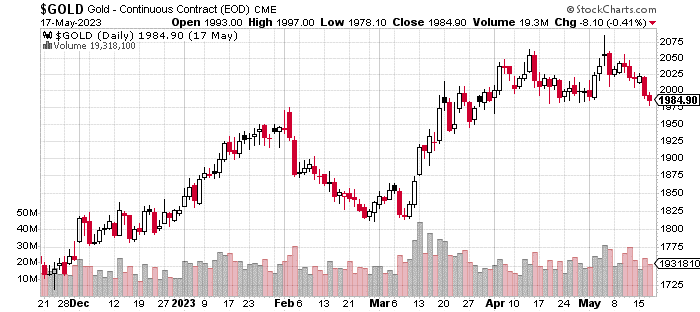
The drop in the price of gold below $2000/ounce, seen above, may be a sign that investors are less concerned about being in safe-haven investments.

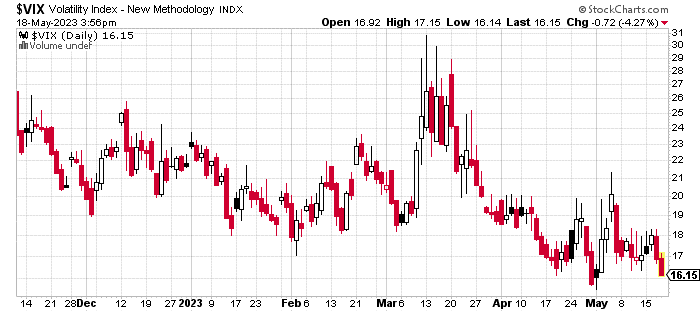
The VIX (the market volatility index) also continues its slow trend downwards. The VIX will have short-term spikes based on one-off news events.

However, its general direction in most years is going to be down or sideways (depending on what kind of year we had previously).

You can see that the VIX is approaching 16. That implies roughly a 1% move per day in stocks. Under 15 is typically considered a low-volatility environment. We may get there this summer, assuming nothing crazy happens with the debt-ceiling or the Fed.

What To Do Next?

If you’d like to see more top stocks under $10, then you should check out our free special report:

3 Stocks to DOUBLE This Year

What gives these stocks the right stuff to become big winners, even in this challeging stock market?

First, because they are all low priced companies with the most upside potential in today’s volatile markets.

But even more important, is that they are all top Buy rated stocks according to our coveted POWR Ratings system and they excel in key areas of growth, sentiment and momentum.

Click below now to see these 3 exciting stocks which could double or more in the year ahead.

3 Stocks to DOUBLE This Year

All the Best!

Jay Soloff
Chief Growth Strategist, StockNews
Editor, POWR Stocks Under $10 Newsletter


SPY shares . Year-to-date, SPY has gained 10.04%, versus a % rise in the benchmark S&P 500 index during the same period.


About the Author: Jay Soloff

Jay is the lead Options Portfolio Manager at Investors Alley. He is the editor of Options Floor Trader PRO, an investment advisory bringing you professional options trading strategies. Jay was formerly a professional options market maker on the floor of the CBOE and has been trading options for over two decades.

More…

The post Bulls Back in Charge? appeared first on StockNews.com

https://www.entrepreneur.com/finance/bulls-back-in-charge/452460


Why Are Investors in a “Sticky Situation”?

The S&P 500 (SPY) seems to be going trading in a fairly tight trading range. Yet there are more facts emerging that would lead one to a bearish conclusion. That includes the discussion of Sticky Inflation. You may not have thought much about that…but let me assure you that is Public Enemy #1 for the Fed. Read on below to understand how Sticky Inflation is increased the odds of bear market downside in the weeks ahead.

Earlier this week I shared an important proclamation that I was getting more bearish. The reasons for which are clearly spelled out here.

One of the key points is that inflation is still too high which is why the Fed is still slamming on the brakes of the economy with their hawkish regimen. This may be hard for some to see who point to a great reduction in gas prices as proof the inflationary beast has been tamed.

Unfortunately, we still have a “sticky” situation at hand thanks to sticky inflation. Let’s dive into this too little discussed subject to appreciate why the odds are pointing more bearish in the weeks ahead.

Market Commentary

The conventional view of inflation is to watch the movement of the Consumer Price Index (CPI). See below the clear and steady decline of that key measure over the past year:

That is serious and consistent improvement that gives some the sense that we don’t need to do that much more to coast down to the Fed’s stated 2% inflation target. This is why so many investors keep betting on a Fed pivot to let off the brakes and start lowering rates.

THAT IS NOT GOING TO HAPPEN ANY TIME SOON!

First, because the Fed keeps repeating that rates will not be lowered this year. This happens at every single Fed announcement much to the chagrin of investors who oddly suspect they will change their tune by September. I almost feel like Powell wants to say things like “Read my lips” or “Did I stutter?”.

Second, and more importantly, because the Fed is basing their decisions on sound logic. That being that there is more to the inflation equation than just CPI. And that not all inflation elements are made equal.

Enter the Conversation About “Sticky Inflation”

The Atlanta Fed leads this effort to break up the CPI report into 2 sub indices:

  • Flexible CPI (where prices change quickly)
  • Sticky CPI (where prices change slowly)

As you will see in their most recently updated chart below, overall inflation may be down, but Sticky inflation is stubbornly high at +6.5% year over year (yes, even more than the +4.9% CPI reading).

Below is a good summary of what is in each sub index. But for simplicity the majority of the problem in Sticky Inflation comes from housing/shelter (OER below), medical services, recreation & restaurant prices.

Plain and simple, the Fed is on a mission to stamp out inflation. And no matter what some investors think they see in the improvement of CPI or gas prices…they are not economists and don’t appreciate the totality of the inflation story.

Now let’s remember that Fed officials are indeed economists and academics who fully understand these intricate concepts. They absolute see and understand the problem with sticky inflation and are firmly planning to eradicate it which is why rates will stay high through years end…or even longer.

And yes, the Fed is FULLY aware that this likely will create a recession. In fact, that is still their base case by years end. (This concept is the cornerstone of my argument for becoming more bearish as shared in my recent commentary).

This brings us back to the importance of being vigilant on our recession watch as more signs of that becoming a reality will wake the bear from hibernation leading to new stock lows. The key to the recession watch has been employment which has been incredibly resilient.

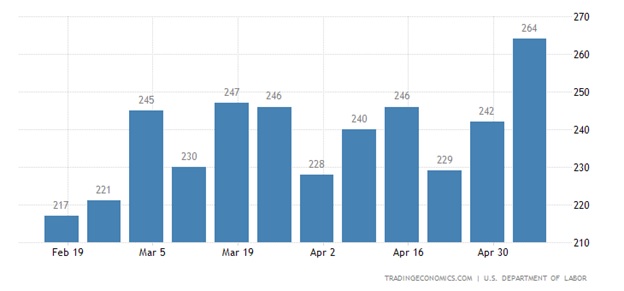
The leading indicator of the monthly Government Employment Situation report is the weekly Jobless Claims report every Thursday. As you will see in the chart below this has been ticking up little by little over time. The key for most is if it reaches 300,000+ per week which is usually a sign that the unemployment rate is about to rise.

Jumping of the chart above is the 10% week over week spike in claims to 264,000. So this indicator is not in troubling territory yet, but directionally we are getting closer to the point where unemployment may rise, which would most certainly sound more recessionary alarms…and get stocks moving lower.

How Does This Affect Our Trading Plan?

Let me borrow some key statements from my 5/9/23 Reitmeister Total Return commentary which applies just as well here.

“My recommendation is to stay balanced (bullish/bearish) like we are doing in Reitmeister Total Return until the recession starts to rear its ugly head. That because there have been many false recessionary alarms over the past 15 months that did not come to fruition leading to a rise in stock prices.

Your best bear trading signal is when the market finally cracks below the 200 day moving average (currently at 3,975). From there a bearish FOMO rally should kick in with 10-20% more downside to eventual bottom.

Why not shift more bearish now?

Because if only 65% certain of bearish outcome…that means I still see a 35% chance that recession and deeper bear does NOT happen. So, we want more of the cards to be put on the table before we make a deeper bearish bet.”

What To Do Next?

Discover my balanced portfolio approach for uncertain times. The same approach that has beaten the S&P 500 (SPY) by a wide margin in recent months.

This strategy was constructed based upon over 40 years of investing experience to appreciate the unique nature of the current market environment.

Right now, it is neither bullish or bearish. Rather it is confused…volatile…uncertain.

Yet, given the facts in hand, we are most likely going to see the bear market coming out of hibernation mauling stocks lower once again.

Gladly we can enact strategies to not just survive that downturn…but even thrive. That’s because with 40 years of investing experience this is not my first time to the bear market rodeo.

If you are curious in learning more, then please click the link below to start getting on the right side of the action:

Steve Reitmeister’s Trading Plan & Top Picks >

Wishing you a world of investment success!


Steve Reitmeister…but everyone calls me Reity (pronounced “Righty”)
CEO, StockNews.com and Editor, Reitmeister Total Return


SPY shares fell $0.59 (-0.14%) in after-hours trading Friday. Year-to-date, SPY has gained 8.04%, versus a % rise in the benchmark S&P 500 index during the same period.


About the Author: Steve Reitmeister

Steve is better known to the StockNews audience as “Reity”. Not only is he the CEO of the firm, but he also shares his 40 years of investment experience in the Reitmeister Total Return portfolio. Learn more about Reity’s background, along with links to his most recent articles and stock picks.

More…

The post Why Are Investors in a “Sticky Situation”? appeared first on StockNews.com

https://www.entrepreneur.com/finance/why-are-investors-in-a-sticky-situation/452105


Best Tech Stock to Buy in A Recession

Although recession concerns affect most tech stocks, Adobe (ADBE) is able to maintain and grow its margins during any economic cycle due to its strong business model. With a recession expected by the end of the year, I believe it could be worth buying software giant Adobe (ADBE). Keep reading.

Tech stocks have been under pressure since last year due to the Federal Reserve’s aggressive interest rate hikes. After announcing its tenth interest rate hike of 25 basis points last week, the central bank has signaled that there could be a pause in the tightening cycle. While this could be good news for tech stocks, one must be careful with the spate of macroeconomic data due for release.

With a recession likely this year, not all tech stocks are good investment options. However, investors could look to buy software giant Adobe Inc. (ADBE) during a recession.

In this piece, I have discussed several reasons why it could be wise to buy the stock.

The Software-as-a-Service (SaaS) giant enjoys customer stickiness due to its vast array of products and services. ADBE is able to maintain its margins irrespective of an economic cycle due to its solid user base. Moreover, its subscriber base remains intact due to the high switching costs.

During the first quarter, ADBE’s EPS and revenue came above analyst estimates. Its EPS was 3.3% higher than the consensus estimate, while its revenue beat the analyst estimates by 0.7%.

ADBE’s Executive VP and CFO, Dan Durn, stated, “Our strong engine of innovation combined with world-class operational rigor drove profitable growth in Q1, setting us up to deliver another strong fiscal year. Adobe is better positioned today than we’ve ever been to serve our customers globally.”

The company reported record revenue during the first quarter. Revenue grew 13% year-over-year in constant currency. ADBE’s Chairman and CEO Shantanu Narayen said, “Adobe drove record Q1 revenue, and we are raising our annual targets based on the tremendous market opportunity and continued confidence in our execution.”

ADBE updated its targets for fiscal 2023, with its digital media net new ARR is expected to be approximately $1.70 billion, while its non-GAAP EPS is expected to come between $15.30 and $15.60.

For the second quarter, the company expects its total revenue to come between $4.75 billion and $4.78 billion. Its Digital Media net new ARR is expected to be approximately $420 million, while its Digital Media segment revenue is expected to come between $3.45 billion and $3.47 billion. Its non-GAAP EPS is expected to come between $3.75 and $3.80.

ADBE’s stock has gained 13.9% in price over the past six months and 2.2% year-to-date to close the last trading session at $344.06.

Here’s what could influence ADBE’s performance in the upcoming months:

Positive Latest Developments

On March 23, 2023, BlackBerry Limited (BB) and ADBE announced that they have partnered to deliver a secure forms solution for mobile.

ADBE’s Vice President and Chief Technology Officer for Public Sector, John Landwehr, claimed, “The partnership between BlackBerry and Adobe enhances operational processing and workforce efficiency for hiring and onboarding, procurement of goods and services, medical readiness, maintenance, and logistics, and so many more use cases, that require signed approvals at any time, on any device.”

On February 23, 2023, ADBE announced a collaboration with Qualcomm Incorporated (QCOM) to help fuel its digital strategy and that of its affiliated companies.

ADBE’s president of digital experience business, Anil Chakravarthy, said, “By adopting Adobe’s enterprise applications, Qualcomm has an end-to-end solution that will enhance omnichannel experiences for business customers and improve marketing performance.”

“The partnership will help Qualcomm take its own digital transformation to the next level and deliver new ways to showcase the transformative technologies it is delivering to the world,” he added.

Robust Financials

For the fiscal first quarter that ended March 31, 2023, ADBE’s total revenue increased 9.2% year-over-year to $4.66 billion. The company’s gross profit increased 9% from the year-ago value to $4.09 billion. Its non-GAAP operating income increased 6.9% year-over-year to $2.13 billion.

Its non-GAAP net income increased 9% year-over-year to $1.75 billion. In addition, its non-GAAP EPS came in at $3.80, representing an increase of 12.8% year-over-year.

High Profitability

In terms of the trailing-12-month EBIT margin, ADBE’s 33.91% is 627.7% higher than the 4.66% industry average. Its 26.32% trailing-12-month net income margin is 909.3% higher than the 2.61% industry average. Likewise, its 33.86% trailing-12-month Return on Common Equity is significantly higher than the industry average of 1.11%.

Positive Analyst Estimates

Analysts expect ADBE’s EPS for fiscal 2023 and 2024 to increase 12.3% and 13.3% year-over-year to $15.40 and $17.44. Its revenue for fiscal 2023 and 2024 is expected to increase 9.6% and 11.9% year-over-year to $19.30 billion and $21.59 billion.

ADBE’s EPS and revenue for the quarter ending May 31, 2023, are expected to increase 13% and 8.8% year-over-year to $3.79 and $4.77 billion, respectively. The company has an impressive earnings surprise history, surpassing the consensus EPS estimates in each of the trailing four quarters.

Solid Historical Growth

ADBE’s EBIT grew at a CAGR of 20.3% over the past three years. Its EPS grew at a CAGR of 15.4% over the past three years. In addition, its net income grew at a CAGR of 13.6% in the same time frame.

POWR Ratings Show Promise

ADBE has an overall B rating, equating to a Buy in our proprietary POWR Ratings system. The POWR Ratings are calculated considering 118 distinct factors, with each factor weighted to an optimal degree.

Our proprietary rating system also evaluates each stock based on eight distinct categories. ADBE has an A grade for Quality, consistent with its high profitability. It also has a B for Sentiment, in sync with its favorable analyst estimates.

Within the Software – Application industry, ADBE is ranked #17 out of 135 stocks. Click here to access ADBE ratings for Growth, Value, Momentum, and Stability.

Bottom Line

ADBE reported record revenue in the first quarter. Despite the uncertain macroeconomic environment, the company has raised its Digital Media net new ARR and EPS targets for fiscal 2023. Unlike its other tech counterparts, ADBE enjoys recurring revenues which helps it not only maintain its margins but also grow them over time, helping it remain insulated during a recession.

Given its robust financials, favorable analyst estimates, solid historical growth, and high profitability, it could be wise to buy the stock now.

How Does Adobe Inc. (ADBE) Stack up Against Its Peers?

ADBE has an overall POWR Rating of B. Check out these other stocks within the Software – Application industry with A (Strong Buy) or B (Buy) ratings: eGain Corporation (EGAN), Commvault Systems, Inc. (CVLT), and Karooooo Ltd. (KARO).

What To Do Next?

Get your hands on this special report with 3 low priced companies with tremendous upside potential even in today’s volatile markets:

3 Stocks to DOUBLE This Year >


ADBE shares were trading at $343.97 per share on Tuesday afternoon, down $0.09 (-0.03%). Year-to-date, ADBE has gained 2.21%, versus a 7.87% rise in the benchmark S&P 500 index during the same period.


About the Author: Malaika Alphonsus

Malaika’s passion for writing and interest in financial markets led her to pursue a career in investment research.With a degree in Economics and Psychology, she intends to assist investors in making informed investment decisions.

More…

The post Best Tech Stock to Buy in A Recession appeared first on StockNews.com

https://www.entrepreneur.com/finance/best-tech-stock-to-buy-in-a-recession/451819


Why Are Bear Market Odds on the Rise?

The S&P 500 (SPY) has been up, down and all around this past week thanks to the Fed statement followed by the Government Employment report on Friday. On some levels nothing has changed in the market outlook. However, looking further down the road some important things happened this week that increase the odds of recession and deeper bear market downside. Get the full story in the article below.

Lots of economic fireworks this past week.

Lots of stock price movement day to day.

But unfortunately, not much has really changed for the near term market outlook. Meaning that limbo and trading range remain the base case til a new catalyst arises to put the bull/bear argument to rest once and for all.

However, in the long run I think the odds of the bearish outcome have increased. So be sure to read on below for the full story including our trading plan in this unique environment.

Market Commentary

Before we get into the thick of things today, I wanted to get something on your radar. And that is about the rise of Artificial Intelligence (AI) for investing.

Every day we get more and more emails from customers about how they might use AI and tools like Chat GPT to improve their investing.

Indeed, this is a topic I have thought a lot about since StockNews is part of the Tifin Group; a fintech company specializing in the use of artificial intelligence for the benefit of investors. Most notably through the AI powered investment website Magnifi.com.

In fact, I recently wrote a long review of the many features and benefits of Magnifi. If this topic of AI driven investing interests you, then please click below to discover the full story:

How AI Improves Your Investing Process

Now back to today’s market commentary…

Let’s start by rolling out what we learned this week followed by how it effects the market outlook and our corresponding trading plan.

On Monday 5/1 we started the month off with the ISM Manufacturing coming in at 47.1. Sadly that is well below 50 showing that things are contracting. The forward-looking New Orders component was even worse at 45.7. The S&P 500 (SPY) was flat on this news.

Then on Tuesday 5/2 came the 3rd straight monthly drop in the JOLTs report (Job Openings and Labor Turnover). In fact, there are 20% less job openings now than a year ago.

This fits in with the idea that the surprisingly resilient employment market may finally be showing signs of cracking. That is because before you consider laying off employees, you first stop hiring more employees. That is what the JOLT report is starting to convey.

Stocks tanked -1.16% on the day…partially from this news…partially from taking some profits off the table before the Fed announcement that follows.

Indeed, the Fed announcement on Wednesday was the main event of the week. In my book everything went exactly according to plan. That being a quarter point rate hike with language that there is much more work to do to bring inflation back to their 2% target level.

Bulls will point to the clear change in language that this might be the last rate hike. However, bears can point to the statements that even if there are no more rate hikes, they still expect to maintain this high level at least through end of 2023.

Plus, the weakness in the banks IS having a negative impact on the economy…which is why they may not need to raise rates more. This event is like a rate hike or two on its own.

Most importantly, their base case still calls for a mild recession to unfold before their inflation fight is over. That includes the unemployment rate rising 1% from 3.5% to 4.5%.

Here is the problem with that math. Only one time in history has the unemployment moved that much and no further. Meaning that typically when the Pandoras Box of recession is opened, then the unemployment rate goes much higher. Thus, to predict only a mild recession could be somewhat fanciful. The sum total of this negativity explains why stocks ended lower on Wednesday and Thursday.

Interestingly, the script got flipped on Friday with a better than expected Government Employment report where 253K jobs were added (30% above forecast). Hard to see a recession forming in those details leading to a spike in stock prices.

However, for as sweet as that employment rose smells, it also comes with some serious thorns. That being higher than expected wage inflation at +0.5% month over month. This “sticky” inflation measure computes to 6% annual run rate which is far too hot for the Fed which only bolsters their hawkish resolve…which only bolsters the likelihood of recession.

As things stand now, the market remains in limbo. Which means trading range that is neither bullish or bearish.

I would say the upper limit is 4,200 which has been serious resistance 2 times over (early Feb and early May before Fed meeting). And the lower end is the 200 day moving average currently at 3,970.

All movement inside the range is meaningless noise and thus no change in strategy. Breaking above will likely be a signal that the new bull market is upon us and get more aggressively Risk On. Whereas a break below would have us considering more Risk Off measures.

However, I think the probability of bearish case rose this week because of some key concepts Powell discussed on Wednesday. That being where they still predict a recession forming as part of the process to rein in inflation.

Here again, they only predict a mild recession with unemployment rising to 4.5%. Yet history proves that is highly unlikely and will be worse. Please consider that the Fed can’t say out loud:

“Hey, we are going to crush the economy and many of you will lose your jobs. You’re welcome.”

Until more investors see this recession forming, then limbo and the aforementioned trading range will be in place. Just want folks out there to appreciate that the odds of recession and deeper bear market are now higher given the fresh information in hand.

What To Do Next?

Discover my balanced portfolio approach for uncertain times. The same approach that has beaten the S&P 500 by a wide margin in recent months.

This strategy was constructed based upon over 40 years of investing experience to appreciate the unique nature of the current market environment.

Right now, it is neither bullish or bearish. Rather it is confused…volatile…uncertain.

Yet, even in this unattractive setting we can still chart a course to outperformance. Just click the link below to start getting on the right side of the action:

Steve Reitmeister’s Trading Plan & Top Picks >

Wishing you a world of investment success!


Steve Reitmeister…but everyone calls me Reity (pronounced “Righty”)
CEO, StockNews.com and Editor, Reitmeister Total Return


SPY shares were trading at $412.63 per share on Friday afternoon, up $7.50 (+1.85%). Year-to-date, SPY has gained 8.31%, versus a % rise in the benchmark S&P 500 index during the same period.


About the Author: Steve Reitmeister

Steve is better known to the StockNews audience as “Reity”. Not only is he the CEO of the firm, but he also shares his 40 years of investment experience in the Reitmeister Total Return portfolio. Learn more about Reity’s background, along with links to his most recent articles and stock picks.

More…

The post Why Are Bear Market Odds on the Rise? appeared first on StockNews.com

https://www.entrepreneur.com/finance/why-are-bear-market-odds-on-the-rise/451123


Profit From the Best AND Worst Stocks!

Stock markets suffered through a rough year in 2022. Major indices like the S&P 500 (SPY) and NASDAQ 100 were down double digits across the board. Yet this simple strategy showed a solid double-digit gain by taking profitable positions in both good AND bad stocks. This type of balanced approach will likely continue to outperform in what looks like to be a tough second half of 2023. Read on below to find out more.

2022 was one of the worst years for stocks in a long time. After a strong start to 2023, stocks are failing to break out at recent highs. What happens the rest of the year remains to be seen. The recent rise in interest rates along with a continued earnings recession is likely to be an overhang that will continue to stall stocks for the final two quarters of 2023.

The average annual return for stocks (S&P 500) over the past 150 years is roughly 9%, including dividends. Without dividends it drops to just over 4.5%. Inflation shaves about half off those returns.

A return back towards more historic returns may look pretty good in the coming 12 months. Stock selection will be critical to performing well in 2023, rather than just buying any stock -which was seemingly the way to easy gains up until 2022.

The POWR Ratings can certainly provide investors and traders with a clear edge when selecting stocks. Over the past 20 plus years, the A Rated strong buys in the POWR Ratings have outperformed the S&P 500 by over 22% annually.

While this level of outperformance is truly eye-opening, selling the F rated strong sell stocks would have beaten the overall market by an even greater degree.

These lowest rated stocks actually fell over 21% per year while the S&P 500 gained nearly 7% annually. This equates to an underperformance of roughly 28%! This means the bad stocks fell a bit worse than the good stocks rose in comparison to the S&P 500.

Many investors and traders are not comfortable shorting stocks. Unlimited potential loss increases the fear factor even more. Luckily, the options market provides a defined risk solution to profit from a pullback in stocks. Puts.

Owning a put option gives you the ability to sell a stock at a specific price before a certain time. The put buyer pays money upfront – called the option premium.

For instance, buying the Apple July $155 put at $4.30 gives the buyer the right to sell AAPL stock at $155 until expiration on 7/21/2023 (the third Friday in July).

The price of these bearish put options will increase as the stock goes down and decrease if the stock rises. The most at risk is $430 ($4.30 premium x 100)

Buying put options is a simple, but very effective way, to take a bearish stance on bad stocks (using Apple as an example, not that is a bad stock).

To help offset this bearish view, POWR Options combines it with a bullish trade that is done with a call purchase.

Owning a call option gives you the ability to buy a stock at a specific price before a certain time. The call buyer again pays money upfront – called the option premium.

For instance, buying the Apple July $175 call at $4.50 gives the buyer the right to buy AAPL stock at $175 until expiration on 7/21/2023 (the third Friday in July).

The price of these bullish call options will increase as the stock goes up and decrease if the stock drops. The most at risk is $450 ($4.50 premium x 100).

But instead of just combining puts and calls on the same stock, POWR options uses the power of the POWR Ratings to combine puts on the lowest rated (D and F) names along with bullish calls on the highest rated (A and B) stocks.

Sell the worst and buy the best-but define the risk.

Pairing a bearish put and bullish call together is called a “Pairs Trade”. These two trades together combine for a much more neutral outlook.

It is a strategy we successfully use day in and day out in the POWR Options Portfolio to take a more balanced “Pairs Trade” approach by combining bearish puts with bullish calls. It worked very well in 2022 and continues to work very well so far in 2023.

A recent example of this POWR Pairs approach using the power of the POWR ratings for bearish put plays and bullish call plays may help shed some light on things.

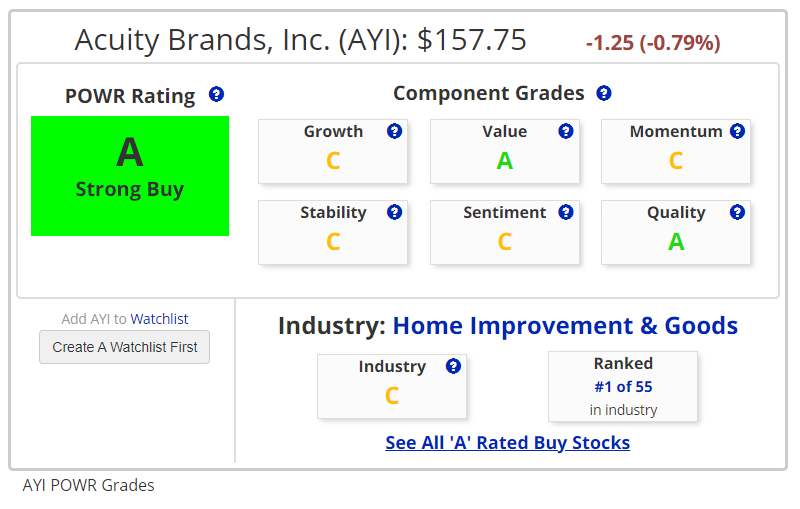
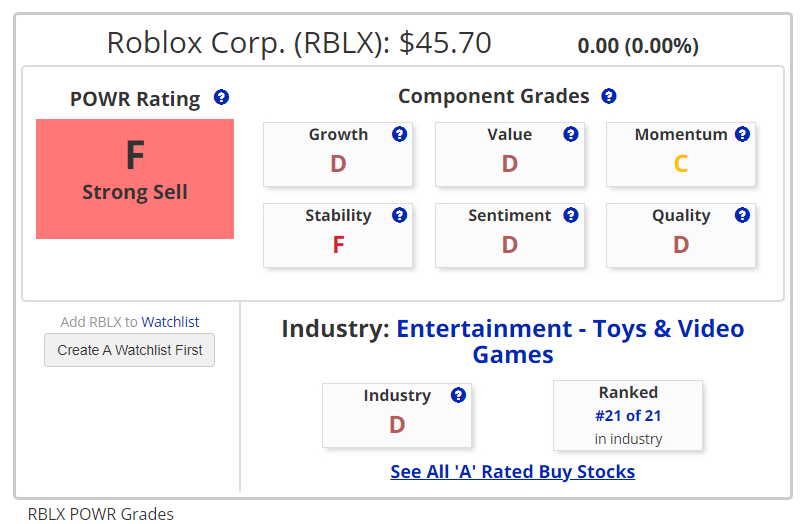
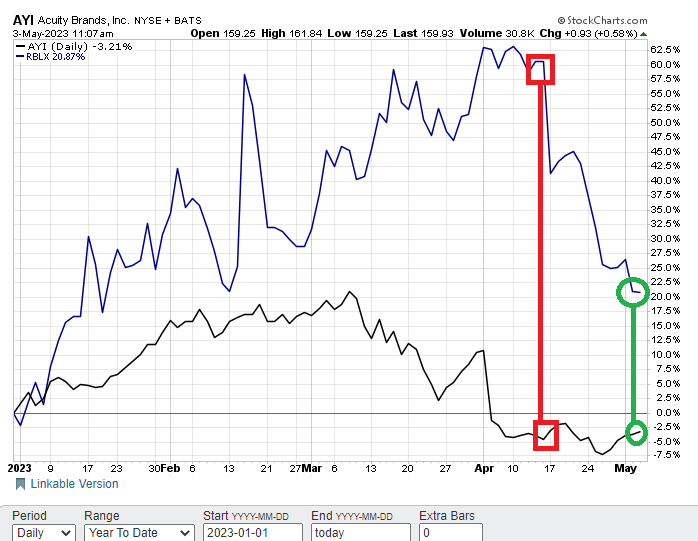
Below is a recent POWR Pairs trade done in the POWR Options Portfolio on Acuity Brands (AYI) and Roblox (RBLX).

AYI was an A rated- Strong Buy -stock in a C rated Industry. Number one in the industry. Strong stock in a strong position.

RBLX was an F rated -Strong Sell – stock in a D rated industry. Ranked at the bottom in the industry group as well, so pretty much the worst of the worst.

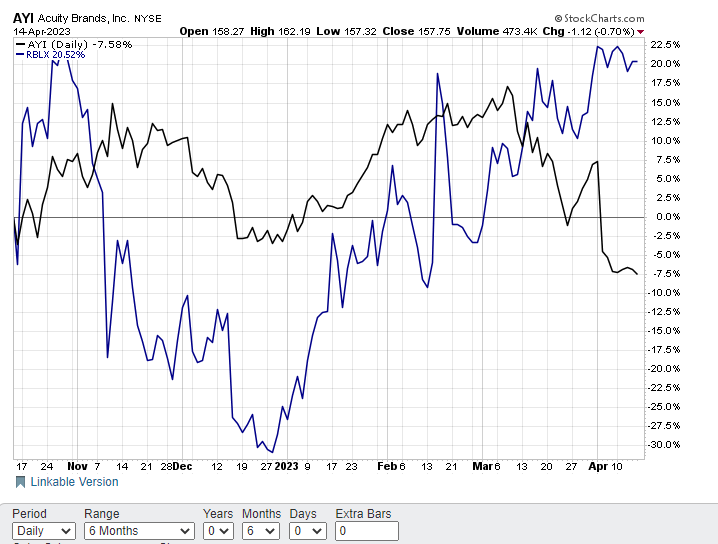
Yet over the past few weeks, much lower rated Roblox had been outperforming much higher rated Acuity by a wide margin.

In fact, since the beginning of the year A rated AYI was lower by almost 5% while F rated RBLX screamed much higher-up 60%!.

This set up ideally for a POWR Pairs trade. Buying bullish calls on the big-time underperforming Strong Buy AYI and bearish puts on the hugely outperforming Strong Sell RBLX.

The expectation was for the spread between the two to converge back towards a more normal comparative performance with AYI outperforming RBLX.

That proved to be the case. RBLX dropped sharply while AYI traded sideways. The spread converged from over 60% at trade inception (red) to 25% at close out (green).

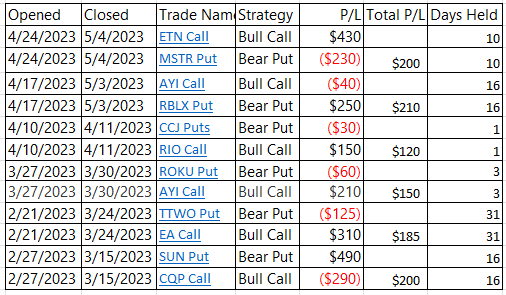
POWR Options closed out the POWR Pairs trade for a $210 overall gain. $40 loss on the AYI calls and a $250 gain on the RBLX puts. Trade took 16 days from start to finish. Over a 20% gain on the $970 invested in both the AYI calls ($500) and RBLX puts ($470). Not bad for a few weeks work on a neutral trade.

This table below shows the most recent six closeouts for POWR Options. All 6 were overall winning trades with a holding period averaging just a few weeks. All very similar to the AYI/RBLX POWR Pairs trade.

The ability to say nimble and be more neutral has served the POWR Options Portfolio so far. Our trading showed solid gains since inception versus losses for stocks in that same time frame.

Using the POWR ratings to help us select the best of the best stocks to be bullish on with call buys, along with the worst of the worst stocks to be bearish on with put purchases, will likely continue to prove profitable in 2023.

What To Do Next?

If you’re looking for the best options trades for today’s market, you should definitely check out this key presentation How to Trade Options with the POWR Ratings. Here we show you how to consistently find the top options trades, while minimizing risk.

Using this simple but powerful strategy I have delivered a market beating +55.24% return, since November 2021, while most investors have been mired in heavy losses.

If that appeals to you, and you want to learn more about this powerful new options strategy, then click below to get access to this timely investment presentation now:

How to Trade Options with the POWR Ratings

Here’s to good trading!

Tim Biggam
Editor, POWR Options Newsletter


SPY shares fell $0.44 (-0.11%) in after-hours trading Friday. Year-to-date, SPY has gained 8.31%, versus a % rise in the benchmark S&P 500 index during the same period.


About the Author: Tim Biggam

Tim spent 13 years as Chief Options Strategist at Man Securities in Chicago, 4 years as Lead Options Strategist at ThinkorSwim and 3 years as a Market Maker for First Options in Chicago. He makes regular appearances on Bloomberg TV and is a weekly contributor to the TD Ameritrade Network “Morning Trade Live”. His overriding passion is to make the complex world of options more understandable and therefore more useful to the everyday trader. Tim is the editor of the POWR Options newsletter. Learn more about Tim’s background, along with links to his most recent articles.

More…

The post Profit From the Best AND Worst Stocks! appeared first on StockNews.com

https://www.entrepreneur.com/finance/profit-from-the-best-and-worst-stocks/451109


The Power of Branding: 3 Stocks With Strong Brand Recognition to Buy

Looming concerns of a recession and the banking crisis might keep the stock market under pressure for longer. Amid heightened volatility in the stock market, Coca-Cola (KO), Starbucks (SBUX), and Chipotle Mexican Grill (CMG), which have solid brand recognition, might be ideal buys. Keep reading.

US stocks fell on Thursday due to concerns over turmoil in the banking sector, with all three indexes closing lower. Amid the macroeconomic headwinds, investing in stocks with strong brand recognition that often command higher prices and enjoy more customer loyalty might be viable.

Hence, I present stocks with solid brand recognition: The Coca-Cola Company (KO), Starbucks Corporation (SBUX), and Chipotle Mexican Grill, Inc. (CMG), which have higher profit margins than their industry peers. Moreover, despite a weak economic outlook, these companies have reported strong earnings in their recent fiscal quarter.

This week, the Federal Reserve approved its 10th interest rate hike in just over a year, raising its benchmark borrowing rate by 0.25 percentage point to a target range of 5%-5.25%, the highest since August 2007.

Although this decision was widely expected by markets, concerns over economic growth and a banking crisis have unsettled Wall Street. Stocks initially rose while Treasury yields were mostly lower after the announcement, but stocks struggled to hold onto the gains due to market volatility.

In addition, House Speaker Kevin McCarthy recently offered a bill to lift the debt ceiling in exchange for cuts to government spending of about 8% next year and a cap on its growth of 1% each year after that.

However, Moody’s Analytics chief economist Mark Zandi has warned that this proposal would adversely affect the economy. Zandi testified to the Senate Budget Committee that the proposed reductions could result in the loss of 800,000 jobs by the end of 2024 and raise the jobless rate.

Furthermore, he noted that this plan could reduce economic growth to 1.61% by 2024 and increase the likelihood of a recession.

Take a look at the stocks mentioned above:

The Coca-Cola Company (KO)

Beverage giant KO manufactures, markets, and sells various non-alcoholic beverages. It has a market capitalization of $277.12 billion.

KO’s trailing-12-month EBIT margin of 28.19% is 268.4% higher than the 7.64% industry average. Its 21.04% trailing-12-month levered FCF margin is 614% higher than the industry average of 2.95%. Moreover, the stock’s trailing-12-month net income margin of 22.69% is 608.1% higher than the industry average of 3.20%.

KO announced in its fiscal first quarter that it is collaborating with OpenAI and Bain & Company to leverage ChatGPT and DALL-E to enhance marketing capabilities and business operations through cutting-edge AI.

Within a month of this collaboration, KO launched the “Create Real Magic” platform, which allows consumers to use AI to generate original artwork using creative assets from the Coca-Cola archives. The company is also exploring the use of AI to improve customer service, ordering, and point-of-sale material creation with its bottling partners.

KO’s four-year average dividend yield is 3.03%, and its forward annual dividend of $1.84 per share translates to a yield of 2.89% on the prevailing market price. Over the last three years, KO’s dividend payouts have grown at a CAGR of 3.4%. The company has been raising its dividend payouts for 60 years, which is an incredible feat.

KO’s net operating revenues increased 4.7% year-over-year to $10.98 billion for the fiscal first quarter ending March 31, 2023. Its gross profit increased 4.1% year-over-year to $6.66 billion. The company’s net income rose 11.7% from the previous-year quarter to $3.11 billion and non-GAAP EPS grew 5% year-over-year to $0.68.

Street expects KO’s EPS and revenue for the current quarter ending June 2023 to increase 2.7% and 3.5% year-over-year to $0.72 and $11.70 billion, respectively. The company has a commendable earnings surprise history, surpassing the consensus EPS and revenue estimates in each of the trailing four quarters.

Over the past six months, the stock has gained 7.5% to close the last trading session at $63.72.

KO’s POWR Ratings reflect its promising outlook. The stock has an overall rating of B, which translates to a Buy in our proprietary rating system. The POWR Ratings are calculated by considering 118 different factors, with each factor weighted to an optimal degree.

It also has a B grade for Stability, Sentiment, and Quality. Within the A-rated Beverages industry, KO is ranked #15 out of 37 stocks.

Click here to see the additional POWR Ratings of KO for Growth, Value, and Momentum.

Starbucks Corporation (SBUX)

SBUX and its subsidiaries, operate as a roaster, marketer, and retailer of specialty coffee worldwide. The company operates through three segments: North America; International; and Channel Development. Its market cap is $131.55 billion.

SBUX’s trailing-12-month net income and levered FCF margins of 10.46% and 7.16% are 138.9% and 155.3% higher than the 4.38% and 2.80% industry averages. Its trailing-12-month EBIT margin of 14.13% is 83.4% higher than the 7.70% industry average.

On April 20, SBUX announced the launch of an innovative line of coffee beverages called “Oleato” an alchemy of SBUS’s finest arabica coffee infused with Partanna extra virgin olive oil on April 20, 2023, at more than 60 select stores across Japan, including Starbucks Reserve Roastery Tokyo.

The launch of a new coffee line might potentially increase sales and revenue for Starbucks and help differentiate it from competitors.

On April 3, 2023, SBUX declared a quarterly cash dividend of $0.53 per share of outstanding common stock. The dividend will be payable in cash on May 26, 2023.

While SBUX’s four-year average dividend yield is 1.89%, its current annual dividend of $2.12 translates to a yield of 1.99% on the current market price. SBUX has paid dividends for 12 consecutive years. SBUX’s dividend payouts have grown at CAGRs of 9.8% over the past three years and 13.2% over the past five years.

SBUX’s total net revenue increased 14.2% year-over-year to $8.72 billion for the fiscal first quarter that ended April 2, 2023. Its company-operated stores’ revenues grew 13.8% year-over-year to $7.14 billion, while its licensed stores’ revenues came in at $1.07 billion, up 25.9% year-over-year.

Moreover, its non-GAAP operating income rose 25% from the previous-year quarter to $1.25 billion. Net earnings attributable to SBUX grew 34.7% year-over-year to $908.30 million and its non-GAAP EPS increased 25.4% from the previous-year quarter to $0.74.

Analysts expect SBUX’s revenue to increase 14.7% year-over-year to $9.34 billion in the fiscal third quarter ending June 2023. Its EPS is expected to increase 14.6% year-over-year to $0.96 in the same quarter. The company has surpassed the consensus revenue and EPS estimates in three of the trailing four quarters, which is impressive.

Over the past six months, the stock has gained 28.3% to close the last trading session at $104.72.

SBUX’s Strong fundamentals are reflected in its POWR Ratings. The stock’s overall B rating equates to a Buy in our proprietary rating system.

SBUX has a B grade for Momentum, Stability, Sentiment, and Quality. Within the A-rated Restaurants industry, it is ranked #11 of 46 stocks.

To access SBUX ratings for Value and Growth, click here.

Chipotle Mexican Grill, Inc. (CMG)

CMG owns and operates Chipotle Mexican Grill restaurants. It offers burritos, burrito bowls, quesadillas, tacos, and salads. The company has a market of $56.10 billion.

CMG’s trailing-12-month ROCE, ROTC, and ROTA of 44.74%, 14.27%, and 14.64% are higher than the industry average of 11.05%, 6.34%, and 3.89%.

On April 11, 2023, CMG announced a new all-electric restaurant design that maximizes energy efficiency and uses 100% renewable energy from wind and solar power through certified renewable energy credits. The company has already opened restaurants with these features in Virginia and Florida and will open a third location in Colorado later this summer.

This new restaurant design will help Chipotle achieve its science-based targets to reduce greenhouse gas emissions by 50% by 2030 compared to a 2019 baseline.

During the fiscal first quarter that ended March 31, 2023, CMG’s total revenue increased 17.2% year-over-year to $2.37 billion. The company’s income from operations increased 93.3% year-over-year to $367.61 million. Its adjusted net income increased 80.7% year-over-year to $291.64 million.

In addition, its adjusted EPS rose 84.2% year-over-year to $10.50.

CMG’s EPS and revenue for the current quarter ending June 2023, are expected to increase 30.8% and 14.2% year-over-year to $12.16 and $2.53 billion, respectively. It has a remarkable earnings surprise history, surpassing its consensus EPS estimates in three of the trailing four quarters.

The stock has gained 46.6% year-to-date to close the last trading session at $2033.51.

CMG’s POWR Ratings reflect its robust outlook. The stock has an overall rating of B, equating to a Buy in our proprietary rating system.

In addition, it has a B grade for Momentum, Sentiment, and Quality. It is ranked #15 in the Restaurant industry.

Beyond what is stated above, we’ve also rated CMG for Growth, Value, and Stability.  Get all CMG ratings here.

The Bear Market is NOT Over…

That is why you need to discover this timely presentation with a trading plan and top picks from 40 year investment veteran Steve Reitmeister:

REVISED: 2023 Stock Market Outlook > 


KO shares rose $0.02 (+0.03%) in premarket trading Friday. Year-to-date, KO has gained 0.86%, versus a 7.19% rise in the benchmark S&P 500 index during the same period.


About the Author: Kritika Sarmah

Her interest in risky instruments and passion for writing made Kritika an analyst and financial journalist. She earned her bachelor’s degree in commerce and is currently pursuing the CFA program. With her fundamental approach, she aims to help investors identify untapped investment opportunities.

More…

The post The Power of Branding: 3 Stocks With Strong Brand Recognition to Buy appeared first on StockNews.com

https://www.entrepreneur.com/finance/the-power-of-branding-3-stocks-with-strong-brand/451067


3 of the Worst Consumer Financial Services Stocks to Own in May

Despite the rising interest rates, the consumer financial services industry could remain under pressure due to the tighter lending standards and the chances of a recession later this year. Therefore, it could be wise to avoid fundamentally weak consumer financial services stocks Sunlight Financial (SUNL), Guardforce AI (GFAI), and Sentage Holdings (SNTG). Read more….

Consumer financial services companies offer financial products and services to individuals, households, and small businesses. Although rising interest rates benefit financial companies, tighter lending standards in the wake of bank failures will pressure consumer financial services companies.

Therefore, it could be wise to avoid fundamentally weak consumer financial services stocks Sunlight Financial Holdings Inc. (SUNL), Guardforce AI Co., Limited (GFAI), and Sentage Holdings Inc. (SNTG).

Before diving deeper into the fundamentals of these stocks, let’s discuss what’s happening in the financial sector.

With the failures of the SVB and Signature Bank, the credit standards will likely be tighter amid a high-interest rate environment, indicating lesser lending activity in the financial sector.

Earlier this week, the Fed announced its tenth interest rate hike of 25 basis points, taking the Fed funds rate to between 5% and 5.25%, the highest since September 2007.

Rising interest rates help financial companies expand their top line. On the flip side, higher interest rates also impact the demand for loans as it becomes expensive to borrow money. Moreover, with fears of a recession later this year, economic activity is expected to take a hit which could further affect the demand for credit.

Given this scenario, avoiding the featured consumer financial services stocks could be wise.

Let’s discuss their fundamentals in detail.

Sunlight Financial Holdings Inc. (SUNL)

SUNL operates a business-to-business-to-consumer technology-enabled point-of-sale financing platform. Its platform provides secured and unsecured loans for homeowners originated by third-party lenders to purchase and install residential solar energy systems and other home improvements.

SUNL’s 0.14x trailing-12-month asset turnover ratio is 28.3% lower than the 0.20x industry average. Likewise, its trailing-12-month EBIT margin is negative 67.25% compared to the 21.80% industry average. Furthermore, the stock’s negative 15.95% trailing-12-month EBITDA margin compares to the industry average of 20.78%.

For the fourth quarter ended December 31, 2022, SUNL’s total revenue declined 82.7% year-over-year to $6.34 million. The company’s adjusted net loss came in at $3.07 million, compared to an adjusted net income of $10.26 million in the year-ago quarter.

Its adjusted EBITDA loss came in at $23.29 million, compared to an adjusted EBITDA of $18.55 million in the prior-year quarter. In addition, its adjusted loss per Class A share came in at $0.02, compared to an adjusted net income per Class A share of $0.06 in the prior-year quarter.

Analysts expect SUNL’s EPS for the quarter ended March 31, 2023, to be negative. Its revenue for the same quarter is expected to decline 39.5% year-over-year to $17.08 million. Over the past year, the stock has declined 90.3% to close the last trading session at $0.43.

SUNL’s weak fundamentals are reflected in its POWR Ratings. The stock has an overall D rating, equating to a Sell in our proprietary rating system. The POWR Ratings are calculated by considering 118 different factors, with each factor weighted to an optimal degree.

It is ranked #45 out of 48 stocks in the D-rated Consumer Financial Services industry. It has an F grade for Quality and a D for Momentum and Stability. Click here to see the other ratings of SUNL for Growth, Value, and Sentiment.

Guardforce AI Co., Limited (GFAI)

Based in Singapore, GFAI offers cash solutions and cash handling services in Thailand. The company’s services include cash-in-transit, vehicles to banks, ATM management, cash center operations, cash processing, coin processing, cheque center services, and cash deposit machine solutions, such as cash deposit management and express cash services. Its customers include local commercial banks and chain retailers.

GFAI’s 9.54% trailing-12-month gross profit margin is 68.2% lower than the 30.01% industry average. Its trailing-12-month EBIT margin is negative 34.90% compared to the 9.60% industry average. Furthermore, the stock’s negative 63.56% trailing-12-month levered FCF margin compares to the industry average of 4.81%.

For the fiscal year ended December 31, 2022, GFAI’s revenue declined 1.9% year-over-year to $34.48 million. Its operating loss widened 356% over the prior-year period to $16.89 million. The company’s net loss attributable to equity holders of the company widened 238.7% year-over-year to $18.56 million. In addition, its loss per share widened 25.8% year-over-year to $14.97.

Over the past year, the stock has declined 74% to close the last trading session at $6.70.

GFAI’s weak prospects are reflected in its POWR Ratings. It has an overall F rating, equating to a Strong Sell in our proprietary rating system.

Within the same industry, it is ranked last. It has an F grade for Value and Stability and a D for Growth and Quality. To see the other ratings of GFAI for Momentum and Sentiment, click here.

Sentage Holdings Inc. (SNTG)

SNTG provides a range of financial services. The company offers consumer loan repayment and collection management, loan recommendation, and prepaid payment network services in China. It is based in Shanghai, China.

SNTG’s 0.01x trailing-12-month asset turnover ratio is 98.7% lower than the 0.80x industry average. Its trailing-12-month Return on Common Equity is negative 16.53% compared to the 13.83% industry average. Furthermore, the stock’s negative 17.48% trailing-12-month Return on Total Assets compares to the industry average of 5.07%.

For the fiscal year ended December 31, 2022, SNTG’s total operating revenue declined 92.9% year-over-year to $161,372. Its net loss widened 134.3% year-over-year to $2.56 million. In addition, its loss per share widened 134.8% year-over-year to $1.08.

Over the past six months, SNTG’s stock has declined 14.4% to close the last trading session at $3.50.

SNTG’s POWR Ratings reflect this weak outlook. It has an overall rating of D, which translates to a Sell in our proprietary rating system.

It is ranked #47 in the Consumer Financial Services industry. It has a D grade for Value, Stability, and Quality. Click here to see the other ratings of SNTG for Growth, Momentum, and Sentiment.

The Bear Market is NOT Over…

That is why you need to discover this timely presentation with a trading plan and top picks from 40 year investment veteran Steve Reitmeister:

REVISED: 2023 Stock Market Outlook >


SUNL shares were unchanged in premarket trading Friday. Year-to-date, SUNL has declined -66.67%, versus a 6.34% rise in the benchmark S&P 500 index during the same period.


About the Author: Dipanjan Banchur

Since he was in grade school, Dipanjan was interested in the stock market. This led to him obtaining a master’s degree in Finance and Accounting. Currently, as an investment analyst and financial journalist, Dipanjan has a strong interest in reading and analyzing emerging trends in financial markets.

More…

The post 3 of the Worst Consumer Financial Services Stocks to Own in May appeared first on StockNews.com

https://www.entrepreneur.com/finance/3-of-the-worst-consumer-financial-services-stocks-to-own-in/451062