3 High-Risk Stocks to Avoid in April With Poor Growth Prospects

Recent weak economic data, disappointing earnings reports, and turmoil in the financial sector have raised recessionary pressures of late, dragging down equities. As the stock market is expected to remain under immense pressure, investors should avoid high-risk stocks Roku (ROKU), Bitfarms (BITF), and CleanSpark (CLSK) this month, with weak growth prospects. Read on….

The latest batch of economic data, disappointing corporate earnings, and the banking crisis has elevated recession fears lately. Given an uncertain macroeconomic backdrop, it could be wise to stay away from risky stocks Roku, Inc. (ROKU), Bitfarms Ltd. (BITF), and CleanSpark, Inc. (CLSK) in April, with fundamental weakness and gloomy growth prospects.

Stocks finished lower yesterday as disappointing corporate earnings and signs of an economic slowdown weighed on investor sentiment. The Dow Jones tumbled 0.3%, while the S&P 500 and the Nasdaq Composite lost 0.6% and 0.8%, respectively. EV maker Tesla’s (TSLA) first-quarter earnings took a hit, and its automotive gross profit margins highly disappointed Wall Street.

AT&T (T) also announced a slowdown in subscriber growth for its postpaid phone plans. Further, American Express (AXP) missed earnings estimates as the company braced for debt struggles among credit cardholders. According to Robert Schein, chief investment officer at Blanke Schein Wealth Management, the major takeaway from earnings season so far is that consumer demand is weakening.

Furthermore, more economic data was released yesterday. The Labor Department reported that weekly jobless claims climbed to 245,000, more than economists expected.

Jobless claims continue their steady but slow rise,” said Edward Moya, senior market strategist at currency data provider OANDA. “The labor market is softening but nowhere near levels that will alleviate wage pressures, which means inflationary pressures will remain strong.”

In addition, the Philadelphia Fed manufacturing index was weaker than expected, coming in at negative 31.3 for April, while the March existing home sales also missed the mark.

With continuing signs that inflation is proving stronger than hoped, there are rising expectations of more rate hikes by the Federal Reserve. Traders are pricing in more than an 80% chance of another 25-basis-point hike in May, according to the CME FedWatch Tool

Amid higher interest rates, recent turmoil in the banking sector, and growing recession fears, the stock market is expected to remain highly volatile in the upcoming months. So, risky stocks ROKU, BITF, and CLSK, with weak fundamentals and poor growth prospects, should be avoided.

Let’s discuss the fundamentals of these stocks in detail:

Roku, Inc. (ROKU)

Roku operates a TV streaming platform through two segments: Platform and Devices. Its platform enables users to discover and access streaming content, including TV shows, movies, sports, and others and offers digital advertising and related services. Furthermore, the company provides streaming players, audio products, and smart home products under the Roku brand name. It has a 2.05 beta.

ROKU’s trailing-12-month gross profit margin of 46.09% is 8.21% lower than the industry average of 50.32%, while its trailing-12-month negative EBITDA margin of negative 6.74% is lower than the industry average of 4.58%. In addition, the stock’s trailing-12-month net income margin of negative 15.93% compares to the 3.38% industry average.

For the fourth quarter that ended December 31, 2022, ROKU’s net revenue from the Devices segment decreased 18.4% year-over-year to $135.80 million, while its gross profit came in at $364.38 million, down 4% year-over-year. Also, the company’s loss from operations was $249.90 million, compared to income from operations of $21.36 million.

Also, the company’s adjusted EBITDA loss came in at $95.23 million versus an adjusted EBITDA of $86.73 million in the prior-year quarter. The company’s net loss and net loss per share stood at $237.20 million and $1.70, compared to a net income and net income per share of $23.69 million and $0.17 in the year-ago period, respectively.

Analysts expect ROKU’s revenue to decline 3.7% year-over-year to $706.92 million for the first quarter that ended March 2023. The company’s loss per share of $1.49 for the same quarter is expected to widen by 685.1% year-over-year to $1.49. Furthermore, the company is expected to incur losses for at least two fiscal years.

The stock has declined 46.2% over the past year to close the last trading session at $58.92.

ROKU’s POWR Ratings reflect its poor prospects. The stock has an overall grade of F, translating to a Strong Sell in our proprietary rating system. The POWR Ratings assess stocks by 118 different factors, each with its own weighting.

ROKU has an F grade for Growth and Sentiment. The stock also has a D grade for Momentum, Stability, Value, and Quality. It is ranked last among 53 stocks in the Consumer Goods industry.

Click here to access all POWR Ratings for ROKU.

Bitfarms Ltd. (BITF)

Headquartered in Toronto, Canada, BITF engages in the mining of cryptocurrency coins and tokens in Canada, the United States, Paraguay, and Argentina. The company operates server farms that validate transactions on the Bitcoin Blockchain and earn cryptocurrency from block rewards and transaction fees. BITF has a high beta of 4.55.

On December 13, 2022, BITF received a written notification from the Nasdaq Stock Market LLC indicating that for the last thirty straight business days, the bid price for the company’s common shares had closed below the minimum $1 per share requirement for continued listing on Nasdaq. The company has been provided an initial period of 180 calendar days, or until June 12, 2023, to regain compliance.

BITF’s trailing-12-month gross profit margin of 7.38% is 85.4% lower than the industry average of 50.63%. Likewise, its trailing-12-month EBIT and net income margins of negative 28.78% and 167.84% compare to the respective industry averages of 4.53% and 2.69%.

For the fourth quarter that ended December 31, 2022, BITF’s revenues decreased 54.6% year-over-year to $27.04 million, while its gross loss came in at $12.08 million, compared to gross profit of $38.99 million in the previous year’s quarter. Also, the company’s operating loss was $20.02 million, compared to an operating income of $15 million in the prior-year period.

Furthermore, BITF’s adjusted EBITDA declined 97.2% from the year-ago value to $1.13 million. The company’s net loss and total comprehensive loss was $16.84 million, versus a net income of $9.68 million in the same period in 2021. Also, its loss per share stood at $0.08, compared to EPS of $0.05 in the prior-year quarter.

Street expects the company to report a loss per share of $0.25 for the fiscal year (ending December 2023). The company’s revenue for the ongoing year is estimated to decrease 11% year-over-year to $126.75 million. Shares of BITF have plunged 66.6% over the past year to close the last trading session at $1.07.

BITF’s POWR Ratings reflect this weak outlook. It has an overall rating of F, translating to a Strong Sell in our proprietary rating system.

The stock has an F grade for Stability and Growth and a D for Quality. It is ranked #93 out of 100 stocks in the F-rated Financial Services (Enterprise) industry. 

Beyond what has been stated above, we’ve also given BITF grades for Value, Sentiment, and Momentum. Get all BITF ratings here.

CleanSpark, Inc. (CLSK)

CLSK engages in the mining of Bitcoin operations. Additionally, the company offers data center services, such as rack space, power, and equipment, and cloud services, including virtual, virtual storage, and data backup services. It has a 2.55 beta.

CLSK’s trailing-12-month EBITDA margin of negative 52.86% is significantly lower than the industry average of 4.53%. And its trailing-12-month EBITDA margin of negative 3.00% compares to the industry average of 9.25%. Also, the stock’s trailing-12-month net income margin of negative 82.51% compares to the 2.69% industry average.

CLSK’s net revenues declined 25.1% year-over-year to $27.82 million in the fiscal 2023 first quarter ended December 31, 2022. Its total costs and expenses increased 159.9% year-over-year to $56.70 million. The company reported a loss from operations of $28.88 million, compared to income from operations of $15.31 million in the previous year’s quarter.

In addition, CLSK’s adjusted EBITDA loss was $1.37 million, compared to adjusted EBITDA of $25.12 million in the same period last year. The company’s net loss stood at $29.03 million versus a net income of $14.49 million in the prior year’s quarter. Also, its loss from continuing operations per common share came in at $0.46 for the quarter.

Analysts expect CLSK to report a loss per share of $1.32 for the current year (ending September 2023). Furthermore, the company’s loss per share for the fiscal year 2024 is expected to worsen by 17.9% from the prior year to $1.56. Moreover, it has missed the consensus EPS estimates in each of the trailing four quarters, which is disappointing.

Over the past year, CLSK has slumped 56.7% to close the last trading session at $3.90.

CLSK’s POWR Ratings are consistent with its bleak fundamentals. The stock has an overall rating of F, equating to a Strong Sell in our proprietary rating system.

CLSK has an F grade for Stability, Growth, and Quality. It also has a D grade for Value. The stock is ranked last among 135 stocks in the D-rated Software-Application industry.

To see CLSK’s POWR Ratings for Sentiment and Momentum, click here.

What To Do Next?

Get your hands on this special report with 3 low priced companies with tremendous upside potential even in today’s volatile markets:

3 Stocks to DOUBLE This Year >


ROKU shares fell $0.27 (-0.46%) in premarket trading Friday. Year-to-date, ROKU has gained 44.77%, versus a 8.11% rise in the benchmark S&P 500 index during the same period.


About the Author: Mangeet Kaur Bouns

Mangeet’s keen interest in the stock market led her to become an investment researcher and financial journalist. Using her fundamental approach to analyzing stocks, Mangeet’s looks to help retail investors understand the underlying factors before making investment decisions.

More…

The post 3 High-Risk Stocks to Avoid in April With Poor Growth Prospects appeared first on StockNews.com

https://www.entrepreneur.com/finance/3-high-risk-stocks-to-avoid-in-april-with-poor-growth/450127

Cloud Stocks NOW and SPLK See High Demand With Buy Ratings 

The cloud computing market is growing amid organizations investing in digitization and emerging technologies. Given the solid prospects of the industry, investors could consider adding fundamentally sound cloud stocks, ServiceNow (NOW) and Splunk (SPLK), which seem poised to see high demand. These stocks are Buy-rated in our proprietary rating system. Read on.

The software industry has not just weathered the pandemic-driven disruptions of the past few years, it has flourished. The industry is expected to continue to witness solid demand due to digital adoption, increasing automation, and demand for cloud services.

Here are two cloud stocks, ServiceNow, Inc. (NOW) and Splunk Inc. (SPLK), which are rated B (Buy) in our proprietary POWR Ratings system, could be ideal additions to your portfolios to capitalize on the industry tailwinds.

Cloud computing is central in all digital business models, from remote working to online classes and cloud kitchens to financial transactions. According to the latest forecast from Gartner, worldwide end-user spending on public cloud services is forecasted to grow 21.7% to $597.30 billion in 2023, up from $491 billion in 2022.

Moreover, 75% of organizations are expected to adopt a digital transformation model predicated on cloud as the fundamental underlying platform by 2026. The global cloud computing market is expected to expand at a compound annual growth rate (CAGR) of 14.1% from 2023 to 2030.

“Organizations today view cloud as a highly strategic platform for digital transformation, which is requiring cloud providers to offer more sophisticated capabilities as the competition for digital services heats up,” said Sid Nag, Vice President Analyst at Gartner.

Let’s discuss the stocks mentioned above in detail:

ServiceNow, Inc. (NOW)

NOW provides enterprise cloud computing solutions that defines, structures, consolidates, manages, and automates services for enterprises worldwide.

On March 22, NOW announced a major platform expansion with the Now Platform Utah release, which is built to help organizations future-proof their businesses and drive outcomes faster in the face of continued economic uncertainty.

On February 27, NOW and AT&T Inc. (T) announced a global telecom product to help communications service providers manage 5G and fiber network inventory.

Rohit Batra, vice president and head of telecommunications, media, and technology products at NOW, said, “Together, ServiceNow and AT&T will work to redefine network inventory, and we will continue to innovate to address the challenges communications service providers face now and in the future.”

NOW’s forward non-GAAP PEG multiple of 1.57 is 6.1% lower than the industry average of 1.67.

NOW’s trailing-12-month net income margin of 4.49% is 66.8% higher than the 2.69% industry average. Its trailing-12-month EBITDA margin of 10.88% is 16.9% higher than the 9.30% industry average.

During the fiscal fourth quarter that ended December 31, 2022, NOW’s non-GAAP total revenue increased 25.5% year-over-year to $2.03 billion. Its net income increased 476.9% year-over-year to $150 million, whereas its net income per share increased 469.2% year-over-year to $0.74.

NOW’s revenue is expected to increase 21.2% year-over-year to $2.09 billion during the fiscal first quarter that ended March 2023. Its EPS is expected to increase 18.5% year-over-year to $2.05 for the same quarter. Additionally, it has topped consensus EPS estimates in each of the trailing four quarters, which is impressive.

The stock has gained 31.3% over the past six months to close the last trading session at $467.69.

NOW’s POWR Ratings reflect this promising outlook. The stock has an overall rating of B, which translates to a Buy in our proprietary rating system. The POWR Ratings assess stocks by 118 different factors, each with its own weighting.  

It has an A grade in Growth and a B in Sentiment and Quality. The stock is ranked #10 in the 50-stock Software – Business industry.

Click here to see the POWR Ratings of NOW (Stability, Momentum, and Value).

Splunk Inc. (SPLK)

SPLK develops and markets cloud services and licensed software solutions in the United States and internationally.

On March 21, SPLK announced innovations to Splunk’s unified security and observability platform to help build safer and more resilient digital enterprises. SPLK’s latest innovations include enhancements to SPLK Mission Control and SPLUK Observability Cloud, and the general availability of SPLK Edge Processor.

With its platform, organizations can unify, simplify and modernize their workflows and business.

SPLK’s forward non-GAAP PEG multiple of 0.49 is 70.3% lower than the industry average of 1.67.

SPLK’s trailing-12-month gross profit margin of 77.67% is 53.7% higher than the 50.54% industry average.

SPLK’s total revenue increased 38.8% year-over-year to $1.25 billion in the fiscal fourth quarter, which ended January 31, 2023. Its gross profit increased 90.9% year-over-year to $1.05 billion, while its net income came in at $268.79 million, compared to a loss of $140.82 million in the previous-year quarter.

Also, its net income per share came in at $1.44, compared to a net loss per share of $0.88 in the previous-year quarter.

SPLK’s revenue is expected to rise 7.8% year-over-year to $726.79 million during the fiscal first quarter that ended April 2023. Additionally, it has topped consensus EPS and revenue estimates in each of the trailing four quarters.

The stock has gained 16.8% over the past six months to close the last trading session at $91.33.

SPLK’s strong fundamentals are reflected in its POWR Ratings. The stock has an overall rating of B, equating to a Buy in our proprietary rating system.

SPLK also has a B grade for Growth, Quality, and Sentiment. It is ranked #5 out of 23 stocks in the Software – SAAS industry.

To access additional ratings for SPLK’s Momentum, Stability, and Value, click here.

What To Do Next?

Get your hands on this special report with 3 low priced companies with tremendous upside potential even in today’s volatile markets:

3 Stocks to DOUBLE This Year >


NOW shares were unchanged in premarket trading Friday. Year-to-date, NOW has gained 20.45%, versus a 8.11% rise in the benchmark S&P 500 index during the same period.


About the Author: Nidhi Agarwal

Nidhi is passionate about the capital market and wealth management, which led her to pursue a career as an investment analyst. She holds a bachelor’s degree in finance and marketing and is pursuing the CFA program. Her fundamental approach to analyzing stocks helps investors identify the best investment opportunities.

More…

The post Cloud Stocks NOW and SPLK See High Demand With Buy Ratings  appeared first on StockNews.com

https://www.entrepreneur.com/finance/cloud-stocks-now-and-splk-see-high-demand-with-buy/450118


Three Big Reasons Why Microsoft May Be Poised For A Pounding

A better way to play for a probabilistic pullback in MSFT with cheap puts.

Microsoft (MSFT) is one of two U.S companies sporting a market cap over $2 trillion. MSFT stock has rallied over 30% in the past few months after making a recent low near $220 on January 6.

The recent red-hot rally is finally starting to slow though. Sell in May and go away applies to Microsoft as monthly stock returns have been negative on average over the past 5 years.

Besides the recent rip higher receding, here are three more very valid reasons to be somewhat skeptical of continued sustained strength in MSFT stock over the coming weeks-along with a better way to play.

Technicals

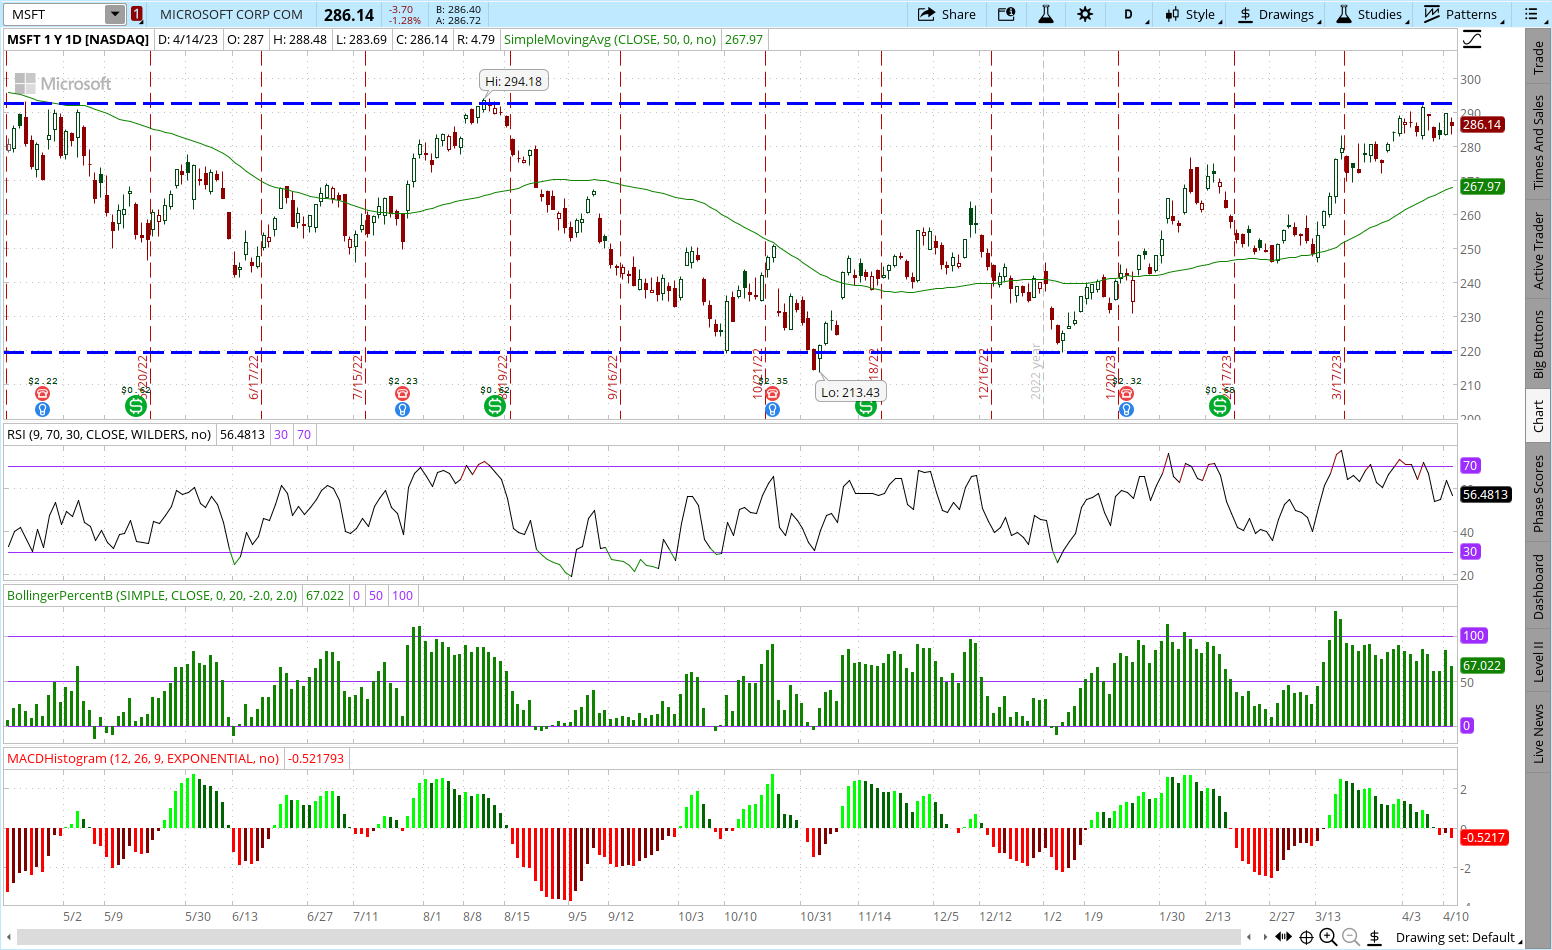
Microsoft is starting to weaken after failing to break out to new recent highs above $294. Shares reached overbought readings on both 9-day RSI and Bollinger Percent B before softening. MSFT is trading at a big premium to the 20-day moving average which has led to pullbacks to the average in the past. MACD just generated a sell signal.

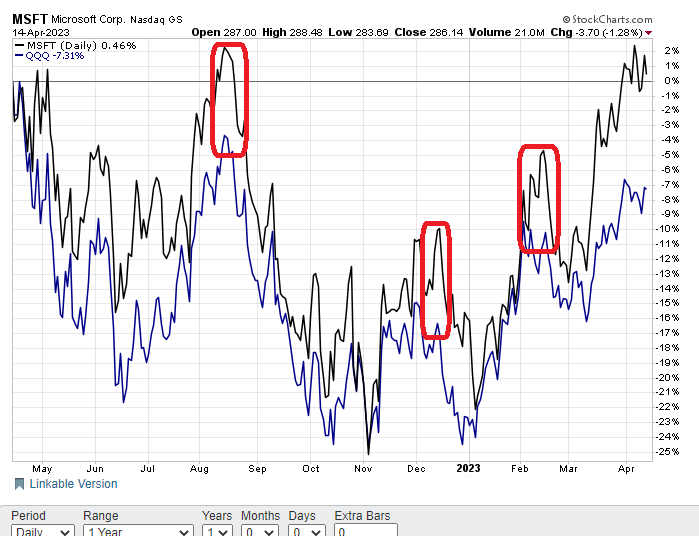
MSFT stock is also looking a little overdone on a comparative basis. Microsoft is now showing a slight gain in the past 12 months while the NASDAQ 100 (QQQ) is still down over 7% in that time frame. Normally MSFT and QQQ tend to move more in tandem, which makes sense given that Microsoft is the largest weighting in the NASDAQ 100 ETF at 12.68%.

The performance spread differential between MSFT and QQQ has once again reached an extreme.

Look for Microsoft to revert and be a big underperformer over the coming weeks like it has done in the past.

Valuation

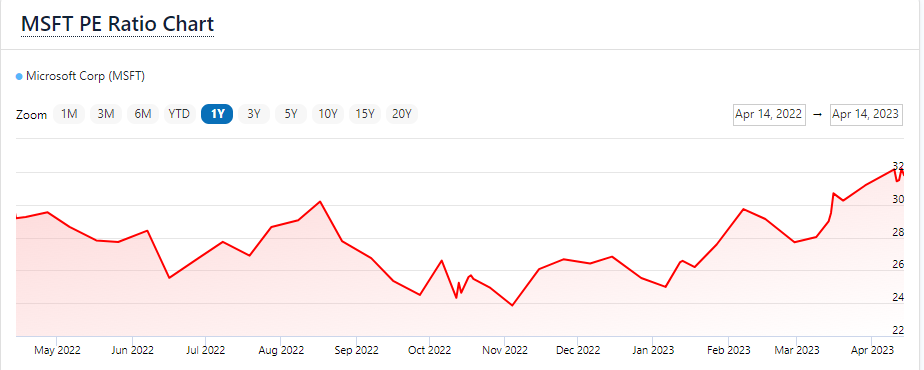
The Current Price/Earnings (P/E) ratio is back over 30x and at the loftiest multiple in the past year. The last time it hit 30x back in August marked a significant top in Microsoft stock.

It is also well above the average P/E multiple of 27.72 in that time frame. Other traditional valuation metrics, such as Price/Sales and Price/Free Cash Flow, have seen a similar rise.

Important to remember that interest rates have risen dramatically over the past 12 months. Normally, this would have a noticeably contractive effect on stock valuation multiples. This makes the recent expansion in MSFT multiples even more pronounced.

Plus, a $2 trillion company carrying these types of multiples makes future growth rates difficult to justify these rich multiples simply due to the law of large numbers.

Implied Volatility

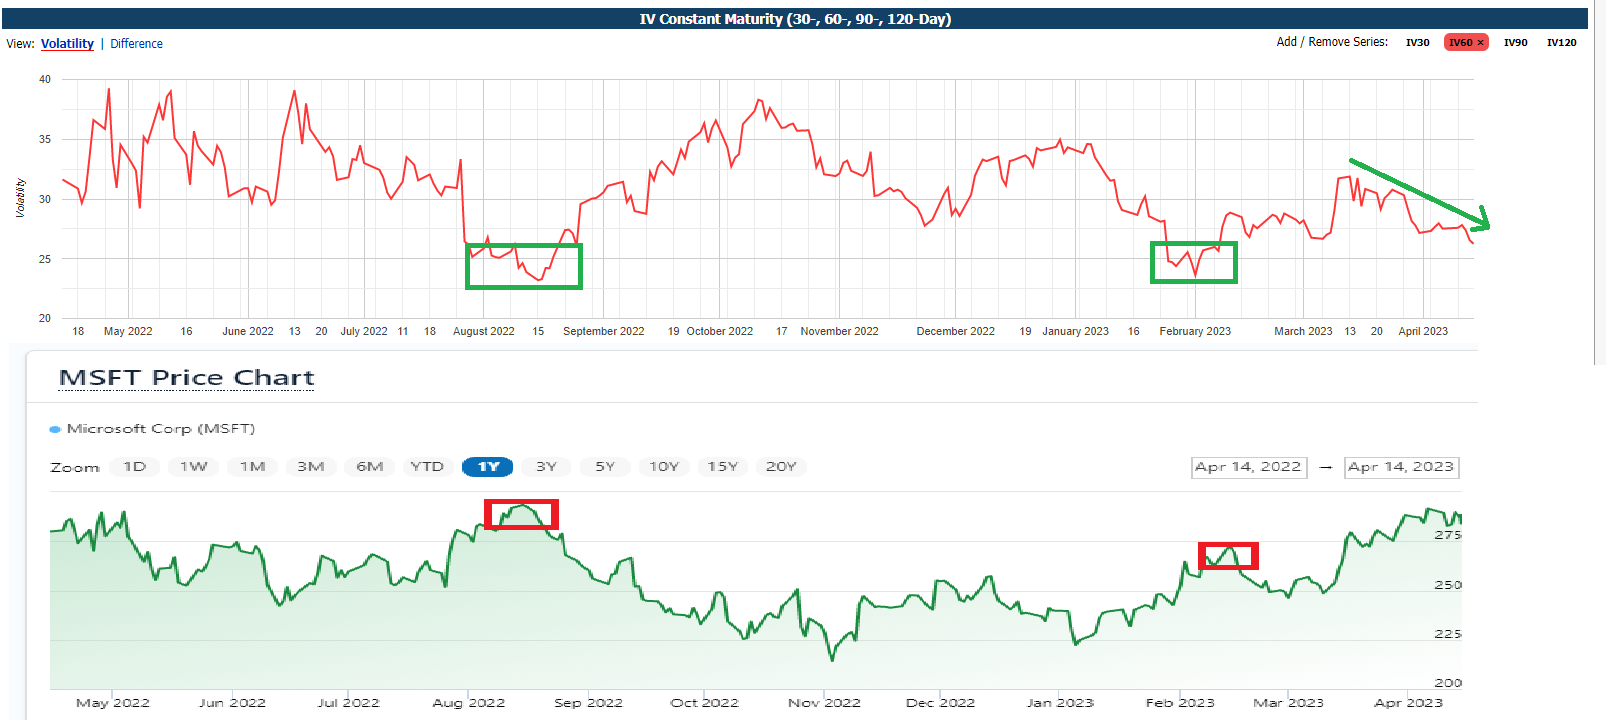
Implied volatility (IV) has dropped sharply in the past month in MSFT options. It is now at the lowest level since February and nearing the yearly lows of last August.

Notice how the lows in IV align nearly precisely with the recent tops in the price of Microsoft stock. Implied volatility can be a valuable market timing tool.

Implied volatility is just another way to say the price of the options. A comparative from roughly a year ago will help shed some light.

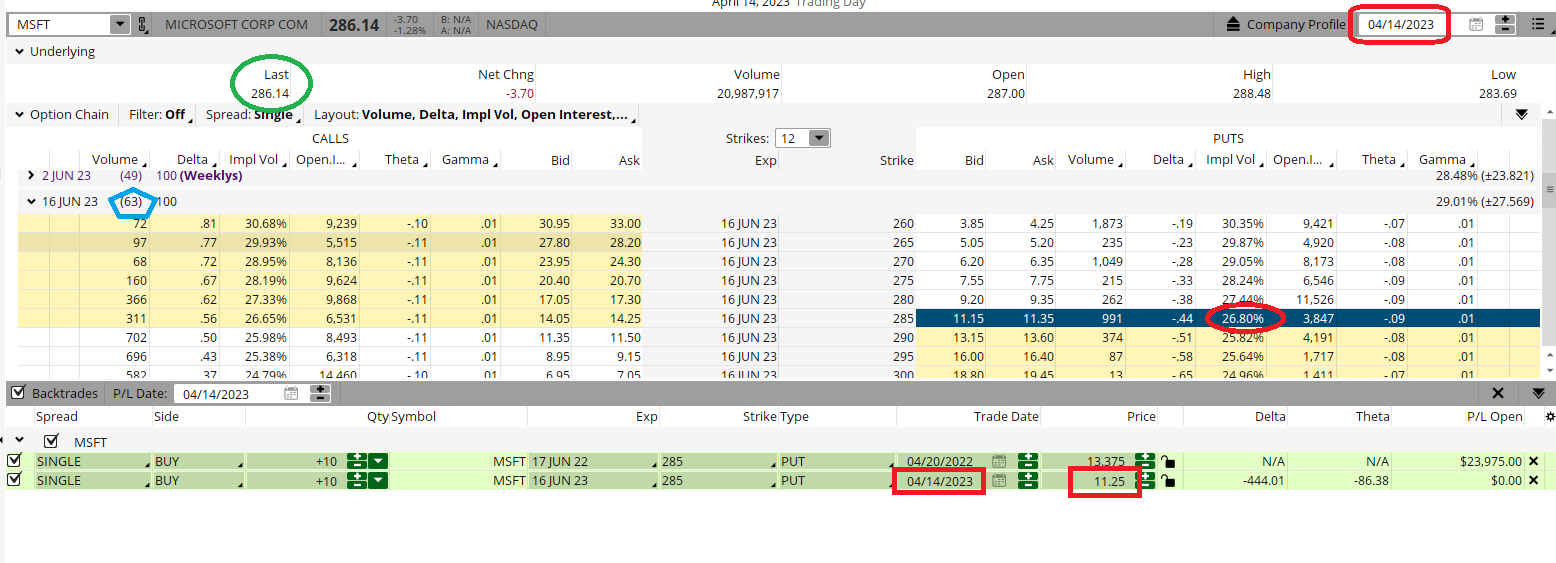
Below are the option montages for the June options from last Friday, April 14 and a year ago April 20, 2022. We are using the at-the-money June $285 puts for our example.

Comparing the two:

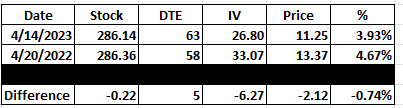
  • The stock price was almost identical -$286.14 on Friday and $286.36 a year ago April 20. So slightly lower stock price on Friday.
  • Days to expiration(DTE) were similar- 63 days from Friday and 58 days from 12 months ago. So 5 days longer until expiration on Friday.

Everything being equal, the June $285 puts from Friday should be slightly more expensive than the June $285 puts from a year back since the stock price is lower and there is more time to expiration.

But everything is not equal-IV is much lower now (26.80) than it was a year ago (33.07). This much lower IV makes the current June $285 puts over $2.00 cheaper than the year-ago $285 puts.

The table below puts it all together.

The % column simply takes the option price divided by the stock price to create another useful comparative. The June $285 puts now are less than 4% of the stock price while the same puts back then would cost over 4.5%.

Microsoft is overbought on a technical basis and overvalued on a fundamental basis. Low levels of implied volatility (IV) are another reason to be bearish. Low levels of IV also mean option prices are cheaper.

Investors looking to hedge or traders looking to speculate can certainly short MSFT stock. But that can be expensive and risky.

Given the current situation, it may be better to consider a defined risk put purchase in Microsoft. It hasn’t been cheaper in a while and loss is limited to the cost of the option-which we just saw is less than 4% the cost of the stock.

POWR Options

What To Do Next?

If you’re looking for the best options trades for today’s market, you should check out our latest presentation How to Trade Options with the POWR Ratings. Here we show you how to consistently find the top options trades, while minimizing risk.

If that appeals to you, and you want to learn more about this powerful new options strategy, then click below to get access to this timely investment presentation now:

How to Trade Options with the POWR Ratings

All the Best!

Tim Biggam

Editor, POWR Options Newsletter


MSFT shares closed at $286.14 on Friday, down $-3.70 (-1.28%). Year-to-date, MSFT has gained 19.61%, versus a 8.26% rise in the benchmark S&P 500 index during the same period.


About the Author: Tim Biggam

Tim spent 13 years as Chief Options Strategist at Man Securities in Chicago, 4 years as Lead Options Strategist at ThinkorSwim and 3 years as a Market Maker for First Options in Chicago. He makes regular appearances on Bloomberg TV and is a weekly contributor to the TD Ameritrade Network “Morning Trade Live”. His overriding passion is to make the complex world of options more understandable and therefore more useful to the everyday trader. Tim is the editor of the POWR Options newsletter. Learn more about Tim’s background, along with links to his most recent articles.

More…

The post Three Big Reasons Why Microsoft May Be Poised For A Pounding appeared first on StockNews.com

https://www.entrepreneur.com/finance/three-big-reasons-why-microsoft-may-be-poised-for-a-pounding/449782


Bullish or Bearish…You Decide

There is a lot of bearish energy out there right now. Even the Fed seems to be calling for a recession… and the experts who aren’t worried about a recession are worried about stagflation. (For anyone who is a few years removed from Econ 101, that’s the one where we have sticky high inflation AND rising unemployment.) And yet, a quick glance at the stock market would make you think happy times are here again. Which side is right? Read on to find out my pick….

(Please enjoy this updated version of my weekly commentary originally published April 13th, 2023 in the POWR Stocks Under $10 newsletter).

Let’s run through a few reasons why people are bearish.

– Banking chaos + tighter credit could spur a big drop in U.S. economic activity
– Unemployment more likely to get worse than better
– Potential for higher interest rates as next Fed meeting approaches
– Likely drop in Q1 earnings growth
– Stocks largely trading at lofty multiples
– We still haven’t revisited the lows from October
– Inflation is still more than double the Fed’s target rate

And here are a few reasons why people are bullish.

– Because everyone else is bearish

Now, I’m kind of joking, but I’m also kind of not.

Yes, there are some technical indicators that are bullish – like the fact that the S&P 500 is holding above 4,100 and seems to be on the verge of breaking above the 4,200 level, which would mark the beginning of a new bull market.

There are also a large number of investors who are looking ahead to a time when the Federal Reserve pauses its rate hike strategy, which should be soon based on their initial terminal target rate.

And there’s definitely some truth to the idea that when everyone else is bearish, the market turns bullish.

Once everyone and their dog has sold all their stock… and there are no more sellers left in the market… that means the only direction left for the market to go is up. (Or sideways.) It’s the entire reason why contrarian investing is a strategy.

And speaking of the Fed, even they’re bearish… and they’re the ones orchestrating this whole thing.

According to the minutes from the Fed’s March meeting, “Given their assessment of the potential economic effects of the recent banking-sector developments, the staff’s projection at the time of the March meeting included a mild recession starting later this year, with a recovery over the subsequent two years.”

That doesn’t usually bode well for stocks. But just look how well things turned out for the bears on Q1. After some chop, the S&P 500 (SPY) and Nasdaq managed to overcome the naysayers and put in a gain.

Personally, I’m still more bearish than bullish, which I know seems to be the popular choice.

But I’m still a strong advocate for our “market of stocks” strategy that looks for solid companies poised to gain regardless of what the market is doing.

In fact, barring any major changes, I have a few more picks heading your way tomorrow.

Conclusion

We’re going to keep cautiously buying for now. We don’t want to get to the end of this year and look back on all the gains we could have missed sitting on the sidelines, waiting for the perfect opportunity to get in.

But we are going to keep an eye on the bearish action/fundamentals to make sure we don’t get mauled.

What To Do Next?

If you’d like to see more top stocks under $10, then you should check out our free special report:

3 Stocks to DOUBLE This Year

What gives these stocks the right stuff to become big winners, even in this brutal stock market?

First, because they are all low priced companies with the most upside potential in today’s volatile markets.

But even more important, is that they are all top Buy rated stocks according to our coveted POWR Ratings system and they excel in key areas of growth, sentiment and momentum.

Click below now to see these 3 exciting stocks which could double or more in the year ahead.

3 Stocks to DOUBLE This Year

All the Best!

Meredith Margrave
Chief Growth Strategist, StockNews
Editor, POWR Stocks Under $10 Newsletter


SPY shares closed at $412.46 on Friday, down $-1.01 (-0.24%). Year-to-date, SPY has gained 8.26%, versus a % rise in the benchmark S&P 500 index during the same period.


About the Author: Meredith Margrave

Meredith Margrave has been a noted financial expert and market commentator for the past two decades. She is currently the Editor of the POWR Growth and POWR Stocks Under $10 newsletters. Learn more about Meredith’s background, along with links to her most recent articles.

More…

The post Bullish or Bearish…You Decide appeared first on StockNews.com

https://www.entrepreneur.com/finance/bullish-or-bearishyou-decide/449779


Bull or Bear or Neither?

The future outlook for the stock market (SPY) is getting more confusing…not less. Why is that? What does that mean for stocks in the weeks ahead? And what is the best trading plan to stay ahead of the pack? 40 year investment veteran Steve Reitmeister shares his views in the commentary below including his top 7 stocks for today’s market. Read on below for more.

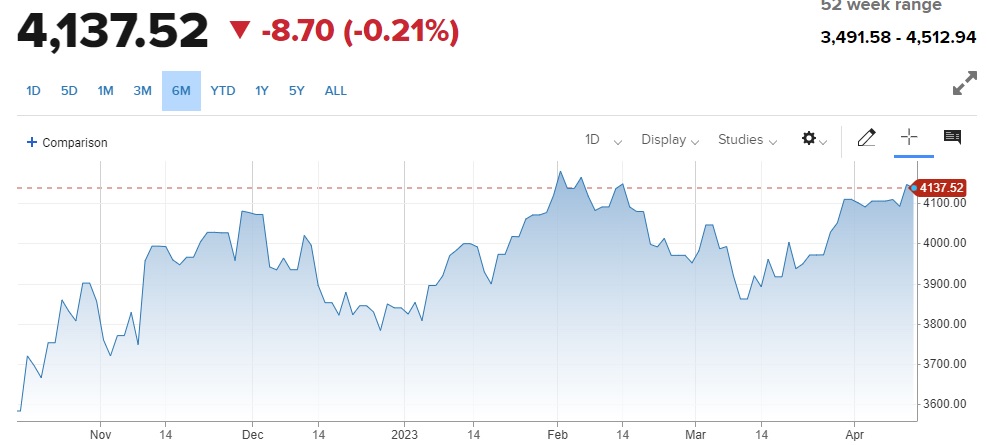
Six months ago, stocks made fresh lows of 3,491. Since then, we have seen a hefty bounce to our current `perch at 4,137.

So are we in still in a bear market…or has the new bull emerged?

That vital discussion, along with our trading plan with top picks, will be at the heart today’s commentary.

Market Commentary

Technically speaking we are still in a bear market. That is because the definition of a new bull market is when the S&P 500 (SPY) rises 20% from the lows. Here is that math:

3,491 October Lows x 20% = 4,189

However, some will say that was only an intraday low and more appropriate to measure based upon the closing low of 3,577 set on October 12. That would mean stocks would need to break above 4,292 to be considered in bullish territory.

The point is that we are getting closer to a bullish breakout. Yet where we stand at this precise moment is a state of limbo which is what creates a trading range.

One could say it’s as wide as the recent lows of 3,855 up to 4,200. But I think most of the near future will be spent in a tighter range of 4,000 to 4,200.

Why Are We in Limbo?

The threat of recession still looms large. This was reinforced Wednesday because the FOMC minutes discussed their fear of recession later in 2023 because of residual damage from banking issues.

On the other hand, we have heard about the threat of recession since early 2022…and it keeps NOT happening.

This has led many traders to not hit the sell button too hard on any whispers of recession. They have been faked out too many times on that in the past only for the market to bounce back ferociously as no recession unfolded.

This is creating an upward bias in the market the last 6 months. Yet will be hard to see too much more upside until the bears are thoroughly convinced that no recession will be in the offing.

Meaning the clear new bull market breakout will not happen until more bears are convinced of an improving forecast. When more of them turn tail and start buying in earnest is when the new bull market will begin.

BUT WHAT IF A RECESSION DOES FORM?

Indeed, those recessionary storm clouds still linger especially as the Fed’s primary goal is to stamp out inflation by “lowering demand”. Lowering demand is just a fancy way of saying they want to slow down the economy.

In a perfect world that is a soft landing near 0% GDP before the economic growth engines restart. In that scenario we have already seen the stock market lows and the next bull market would emerge.

However, just as likely is that all the steps to “lower demand” actually spark a recession with negative growth, job loss and yes, much lower stock prices (below the October lows).

Recent shocking declines in ISM Manufacturing, Service and Friday’s Retail Sales report do paint the picture of an economy potentially tipping over into negative territory. And again, remember that the FOMC minutes did point to their increased concerns that the recent banking issues will be harmful to the economy likely leading to a recession by end of the year.

As long as these serious threats linger, then there will be enough people rightfully bearish to prevent the overall market from heading much higher.

The sum total of this stand off between bulls and bear is a trading range environment likely with serious resistance at 4,200 as was found in February. I don’t even believe the May 3rd Fed announcement has the muscle to change that outcome.

Thus, I could see this trading range scenario in place for a good part of the summer until investors can better determine the true likelihood of recession.

Range Bound Trading Plan & New Pick Coming Monday

One of the classic investor sayings is that we do not have a stock market as much as we have a market of stocks. Meaning that each individual stock has the potential to rise no matter the overall market environment.

It is much easier to appreciate the virtue of this saying when you understand that over 2,000 stocks were in positive territory in 2022 even as the bear market got its claws into most others. And amazingly over 1,000 of those stock rose 50% or more.

This begs us to always be on the lookout for the very best stocks and funds to outperform. And in my 43 years of investing experience nothing does a better job of that than the POWR Ratings scan of 118 different factors that point to a stock’s likelihood of future success.

So even though I fully appreciate the potential for recession and deeper bear market, I still want to be pinpointing the very best stocks and funds to hold in our portfolio.

What To Do Next?

Discover my balanced portfolio approach for uncertain times. The same approach that has risen well above the pack so far in April.

This strategy was constructed based upon over 40 years of investing experience to appreciate the unique nature of the current market environment.

Right now, it is neither bullish or bearish. Rather it is confused…volatile…uncertain.

Yet, even in this unattractive setting we can still chart a course to outperformance. Just click the link below to start getting on the right side of the action:

Steve Reitmeister’s Trading Plan & Top Picks >

Wishing you a world of investment success!


Steve Reitmeister…but everyone calls me Reity (pronounced “Righty”)
CEO, StockNews.com and Editor, Reitmeister Total Return


SPY shares rose $0.69 (+0.17%) in after-hours trading Friday. Year-to-date, SPY has gained 8.26%, versus a % rise in the benchmark S&P 500 index during the same period.


About the Author: Steve Reitmeister

Steve is better known to the StockNews audience as “Reity”. Not only is he the CEO of the firm, but he also shares his 40 years of investment experience in the Reitmeister Total Return portfolio. Learn more about Reity’s background, along with links to his most recent articles and stock picks.

More…

The post Bull or Bear or Neither? appeared first on StockNews.com

https://www.entrepreneur.com/finance/bull-or-bear-or-neither/449773


RIP to These 3 Dying Medical Stocks

Since the high inflation is leading to rising healthcare spending, it could be wise to sell fundamentally weak medical stocks, Pacific Biosciences (PACB), DermTech (DMTK), and Genetic Technologies (GENE), before things get even uglier. Continue reading….

While investors anticipate the Fed to turn dovish in light of the banking crisis, rising oil prices might lead to inflation remaining high in the foreseeable future. Since the high inflation is driving healthcare spending higher each passing day, it could be wise to steer clear of fundamentally weak medical stocks Pacific Biosciences of California, Inc. (PACB), DermTech, Inc. (DMTK), and Genetic Technologies Limited (GENE).

The healthcare business is becoming increasingly vulnerable to the effects of inflation. After two years of battling the impacts of COVID-19 and still dealing with the fallout from the pandemic, the healthcare industry is now confronted with a new set of issues.

Medical inflation has surpassed general inflation. According to the 2023 Global Medical Trends Survey conducted by WTW, medical expenses are expected to rise by 10% this year due to widespread inflation and increased demand for healthcare services. This compares to increases of 8.8% in 2022 and 8.2% in 2021.

Let’s dig deeper into the fundamentals of PACB, DMTK, and GENE to understand what makes them avoidable now.

Pacific Biosciences of California, Inc. (PACB)

PACB designs, develops, and produces sequencing technologies to tackle genetically complicated issues. The business sells sequencing devices, consumable goods such as single-molecule real-time (SMRT) cells, and a variety of reagent kits made for different workflows.

PACB’s trailing-12-month gross profit margin of 41.7% is 25.4% lower than the industry average of 55.9%. Also, its trailing-12-month EBITDA margin of negative 226.6% compares to the industry average of 2.7%.

For the fiscal fourth quarter (ended December 31, 2022), PACB’s total revenue decreased 24.1% year-over-year to $27.35 million. Its gross profit decreased 69.3% year-over-year to $5.14 million. The company’s net loss and net loss per share declined 21.7% and 19.4% year-over-year to $84.38 million and $0.37, respectively.

Analysts expect the company’s EPS to be negative $1.24 in fiscal 2023 and negative $1.06 in fiscal 2024. It failed to surpass the consensus EPS estimates in three of the trailing four quarters.

PACB’s weak fundamentals are reflected in its POWR Ratings. It has an overall rating of F, equating to a Strong Sell in our proprietary rating system. The POWR Ratings are calculated by considering 118 different factors, with each factor weighted to an optimal degree.

It has a D grade for Value, Momentum, Stability, Sentiment, and Quality. Within the D-rated Medical – Diagnostics/Research industry, it is ranked #54 of 55 stocks. Click here to see the other ratings of PACB for Growth.

DermTech, Inc. (DMTK)

In the United States, DMTK, a molecular diagnostic firm, creates and sells cutting-edge non-invasive genomics tests to assist in the detection and treatment of a variety of skin problems, including inflammatory illnesses and skin cancer.

DMTK’s trailing-12-month gross profit margin of 4.5% is 92% lower than the industry average of 55.9%. Its trailing-12-month ROTA of negative 57.7% compares to the industry average of negative 31.7%. Also, its trailing-12-month ROCE of negative 64.46% compares to the industry average of negative 40.33%.

During the fourth quarter (ended December 31, 2022), DMTK’s total revenue decreased 5.4% year-over-year to $2.99 million. The company’s net loss widened 8.3% from the year-ago value to $28.22 million. Also, its loss per share came in at $0.93, widening 5.7% year-over-year.

Analysts expect DMTK’s EPS to be negative $3.50 for fiscal 2023 and negative $3.01. The stock has declined 36.4% over the past nine months to close the last trading session at $3.79.

DMTK’s POWR Ratings are consistent with this bleak outlook. The stock has an overall rating of F, which translates to a Strong Sell in our proprietary rating system.

It has an F grade for Stability and a D for Momentum and Quality. Within the same industry, it is ranked last. To see the DMTK’s rating for Growth, Value, and Sentiment, click here.

Genetic Technologies Limited (GENE)

In the United States, Canada, Europe, the Middle East, Africa, South America, and the Asia Pacific, GENE, a molecular diagnostics firm, offers tools for risk assessment and predictive genetic testing to assist clinicians in managing patients’ health. It works in two segments: GeneType/Corporate and EasyDNA.

GENE’s trailing-12-month EBITDA margin of negative 80.5% compares to the industry average of 2.7%. Its ROTA of negative 55.5% compares to the industry average of negative 31.7%. Also, its ROCE of negative 57.2% compares to the industry average of negative 40.33%.

GENE’s trailing-12-month Capex/Sales of 0.18% compares to the industry average of 4.58%. The company’s cash outflow from operations was 5.21 million over the trailing 12 months. The stock has lost 12.8% over the past month to close the last trading session at $1.09.

GENE’s POWR Ratings reflect this weak outlook. It has an overall rating of F, equating to a Strong Sell in our proprietary rating system. It has an F grade for Stability and a D for Value, Momentum, and Quality. In the same industry, it is ranked #53.

Beyond what I’ve stated above, we have also given GENE grades for Growth and Sentiment. Get all the GENE ratings here.

What To Do Next?

Get your hands on this special report:

3 Stocks to DOUBLE This Year

What gives these stocks the right stuff to become big winners, even in this brutal stock market?

First, because they are all low priced companies with the most upside potential in today’s volatile markets.

But even more important, is that they are all top Buy rated stocks according to our coveted POWR Ratings system and they excel in key areas of growth, sentiment and momentum.

Click below now to see these 3 exciting stocks which could double or more in the year ahead.

3 Stocks to DOUBLE This Year


PACB shares fell $0.06 (-0.55%) in premarket trading Monday. Year-to-date, PACB has gained 33.25%, versus a 6.78% rise in the benchmark S&P 500 index during the same period.


About the Author: Shweta Kumari

Shweta’s profound interest in financial research and quantitative analysis led her to pursue a career as an investment analyst. She uses her knowledge to help retail investors make educated investment decisions.

More…

The post RIP to These 3 Dying Medical Stocks appeared first on StockNews.com

https://www.entrepreneur.com/finance/rip-to-these-3-dying-medical-stocks/449370


2 Biotech Stocks That Are Screaming “SELL ME!”

The biotech sector is witnessing the headwinds from the banking crisis, layoffs, and the Inflation Reduction Act. So, fundamentally weak biotech stocks Ginkgo Bioworks Holdings (DNA) and Novavax (NVAX) might be best avoided. Read on.

The biotech industry thrived during the pandemic. However, despite robust demand, the industry is currently pressured by macroeconomic headwinds and layoffs. Hence, let’s take a look at biotech stocks Ginkgo Bioworks Holdings, Inc. (DNA) and Novavax, Inc. (NVAX) and discuss why it’s best to steer clear of these stocks.

More than 7,000 individuals lost their jobs in biotech companies in 2022. Moreover, the sector reported 1,449 layoffs in January 2023 alone. There were 174 in the same month a year ago. So far this year, 19 biotech companies have announced job cuts.

According to data provided by Biogen Inc. (BIIB) Chairman and former Cowen & Co. Vice Chairman Stelios Papadopoulos, biotech raised $1.57 billion in IPOs last year, a decrease of more than 90% from $16.50 billion in 2021.

Furthermore, biotech stocks have been under pressure amid the banking crisis and the Inflation Reduction Act, a new federal law allowing Medicare to bargain for lower prescription prices. The industry’s fears have been worsened by the uncertainty surrounding the number of potential discounts.

Take a look at the stocks mentioned above:

Ginkgo Bioworks Holdings, Inc. (DNA)

DNA engages in the development of a platform for cell programming. Its platform is used to program cells to enable the biological production of products, such as novel therapeutics, food ingredients, and chemicals derived from petroleum.

Its forward EV/Sales multiple of 6.03 is 311.1% higher than the 1.47 industry average. In terms of its forward Price/Sales, DNA is trading at 8.89x, which is 688.9% higher than the industry average of 1.13x.

DNA’s ROTA of negative 73.72% is lower than the industry average of 6.94%. Also, its ROCE of negative 129.87% is lower than the industry average of 11.61%.

DNA’s revenue declined 33.8% from the year-ago value to $98.29 million in the fourth quarter ended December 31, 2022. The company’s current assets came in at $1.45 billion for the period that ended December 31, 2022, compared to $1.72 billion for the period that ended December 31, 2021.

Also, its current liabilities came in at $172.96 million, compared to $134.76 million for the same period the prior year.

Analysts expect DNA’s revenue to decrease 36% year-over-year to $305.80 million in 2023. Its EPS is expected to remain negative $0.34 in 2023. It has missed the EPS estimates in three of four trailing quarters. Over the past year, the stock has lost 61.8% to close the last trading session at $1.35.

DNA’s poor fundamentals are reflected in its POWR Ratings. The stock has an overall F rating, equating to a Strong Sell in our rating system. The POWR Ratings assess stocks by 118 different factors, each with its own weighting.

DNA has an F grade for Stability and a D for Value, Momentum, Sentiment, and Quality. It is ranked #358 out of 379 stocks in the F-rated Biotech industry. Click here to access POWR Ratings for DNA for Growth.

Novavax, Inc. (NVAX)

NVAX a biotechnology company, that promotes improved health by discovering, developing, and commercializing vaccines to protect against serious infectious diseases.

Its forward EV/Sales multiple of 0.01 is 99.7% higher than the 3.68 industry average. In terms of its forward Price/Sales, NVAX is trading at 0.81x, which is 80.2% higher than the industry average of 4.10x.

NVAX’s gross profit margin of negative 7.87% is lower than the industry average of 55.85%. Also, its EBITDA margin of negative 31.07% is lower than the industry average of 2.72%.

NVAX’s grants revenue decreased 26.8% year-over-year to $69.57 million for the fourth quarter that ended December 31, 2022. Its total current assets came in at $1.70 billion for the period that ended December 31, 2022, compared to $2.16 billion for the period that ended December 31, 2021.

Also, its total assets came in at $2.26 billion, compared to $2.58 billion for the same period the prior year.

Street expects NVAX’s revenue is expected to fall 54.7% year-over-year to $897.60 million in 2023. Its EPS to remain negative $6.18 in 2023 The stock has lost 86.5% over the past year to close the last trading session at $8.46.

NVAX has an overall D rating, equating to a Sell in our POWR Ratings system.

It has an F grade for Stability, Sentiment, and Momentum. It is ranked #196 in the same industry. We have also rated NVAX for Growth, Value, and Quality. Get all the NVAX ratings here.

What To Do Next?

Get your hands on this special report:

3 Stocks to DOUBLE This Year

What gives these stocks the right stuff to become big winners, even in this brutal stock market?

First, because they are all low priced companies with the most upside potential in today’s volatile markets.

But even more important, is that they are all top Buy rated stocks according to our coveted POWR Ratings system and they excel in key areas of growth, sentiment and momentum.

Click below now to see these 3 exciting stocks which could double or more in the year ahead.

3 Stocks to DOUBLE This Year


DNA shares were unchanged in premarket trading Monday. Year-to-date, DNA has declined -20.12%, versus a 6.82% rise in the benchmark S&P 500 index during the same period.


About the Author: Rashmi Kumari

Rashmi is passionate about capital markets, wealth management, and financial regulatory issues, which led her to pursue a career as an investment analyst. With a master’s degree in commerce, she aspires to make complex financial matters understandable for individual investors and help them make appropriate investment decisions.

More…

The post 2 Biotech Stocks That Are Screaming “SELL ME!” appeared first on StockNews.com

https://www.entrepreneur.com/finance/2-biotech-stocks-that-are-screaming-sell-me/449369


4 Key Lessons Learned From Q1 in the Stock Market…

While I think the bulls have made major strides in the first quarter, I think it’s too early to say we’re completely out of the woods. So I thought this would be the perfect time to look back at the Q1 of 2023 and review the factors that influence the S& 500 and what we can learn from this to outperform in the weeks and months ahead. Read on for more….

(Please enjoy this updated version of my weekly commentary originally published April 7th, 2023 in the POWR Stocks Under $10 newsletter).

The first quarter of 2023 is officially in the books. And man, was it a weird one. Pretty much the only thing anyone seems to have correctly predicted is that it was LOADED with volatility.

I went back and read through a number of reports from the beginning of the year to see exactly what experts told us to expect for Q1 and beyond.

What Was Predicted At The Start Of The Year

1) Recession hits in the first half of the year. Whether it will be a mild “soft landing” or a classic recession that impacts all corners of the economy was up for debate, but nearly all experts were forecasting we’d have some kind of recession, most likely in the first half of the year.

2) Sell, sell, sell. Nearly every voice in the room was bearish going into 2023, with most predictions for a fresh downturn in the first quarter. Many believed we would test the lows from October 2022 – or even make new lows – early on in the year before moving higher in the second half.

3) Set, hiiiiiiiiike! (I know this is a lame joke, but I get to make it because I’m from Texas, and football is one of our three major exports.) We saw an unprecedented pace of rate hikes in 2022, and many experts believed it would continue consistently throughout 2023… or as long as inflation remained elevated. Interestingly, many individual investors continued to trade the market as if the Fed would be pausing or even cutting in March.

4) Corporate revenue for the year falls. This was also part of the recession equation. Even so, the consensus analyst estimate for the S&P 500’s (SPY) net profit margin was 12.3%, higher than the estimated net margin of 12% for 2022. That meant many experts were predicting downward revisions, which would put more pressure on stocks, leading to deeper selling.

5) Growth stocks, tech stocks, and crypto currencies take a beating. These were some of the worst-performing groups in 2022, and with most experts expecting more of the same from the Fed, it made sense that these groups would continue to get the short end of the stick. Many experts also suggested staying away from retail and leisure companies, as they’re sensitive to the economic cycle.

6) Quality companies are the safe buy. We saw a number of market strategists recommend buying the sale on quality companies, as they would be the most likely to survive (and potentially thrive) in a recession. Additionally, companies with major debts on their books would be most likely to falter as economic conditions worsen.

7) Tech and small-cap stocks rebound once the bottom is in (likely later in the fall or early 2024). While many analysts agreed that tech and small caps would be poor performers in the first six to nine months of the year, many agreed that the predicted slowdown would set the stage for a strong recovery.

Wow. We were VERY bearish at the end of 2022. Personally, my biggest prediction for the year is the Federal Reserve would still be a big market driver, for better or for worse. And that we’d continue to see bulls and bears fight over the ~secret special meaning~ behind every word out of Powell’s mouth.

What We Actually Saw In Q1

1) Buy, buy, buy! To many investors’ surprise, two of the major indexes were up significantly for the first quarter. The S&P 500 (SPY) finished Q1 up 7% and the Nasdaq was up 20.5%. The Dow — which is made up of those major high-quality stocks analysts were recommending — fared the worst, up only 0.4%.

2) Growth stocks, tech, and crypto were the clear winners. Despite many analysts saying these were the exact companies to avoid, they were the top performers of the first quarter. The five best returns for Q1 were…

FSLY (small-cap cloud services provider) +116.8%
COIN (crypto exchange operator) +90.9%
NVDA (mega-cap semiconductor) +90.1%
META (mega-cap tech conglomerate, aka Facebook) +76.1%
EVGO (small-cap electric vehicle charging stations) +74.3%

A lot of these high returns are likely due to forward-looking investors focused on a pause in rate hikes (which will benefit tech and growth and risk-on stocks) COMBINED with the fact that many of the stocks in this category saw heavy selling in 2022, so they were beaten-down to start.

3) The Fed… didn’t make things easy. First, they appeared to turn dovish, then hawkish again, then dovish again as the central bank decided to let the data lead the way. Now, there’s nothing inherently wrong with that strategy; however, it makes it easy for the Fed to act like it’s going to do one thing without actually committing to do that thing. And that’s how we have investors fighting over whether we’re going to have multiple rate hikes over the next nine months… or rate cuts. In short, Powell’s “nimbleness” is responsible for a lot of volatility in the market. So far in 2023, we’ve had two 25-bps hikes, with a third expected in May.

4) The Fed… did break some banks. After nine consecutive hikes, we saw two major banks collapse the weekend of March 10 due to unrealized losses on their bond portfolios and liquidity issues. That gave Powell and the other Federal Reserve members two problems to deal with — curbing chronic high inflation and shoring up the banking system. In a way, the banking crisis should do some of the Fed’s work for them; if banks get pickier over who they extend credit to, it could act as an additional anchor on the economy.

What Comes Next?

Right now, it seems like no two analysts fully agree on anything, but here are a few of the big predictions for the rest of the year…

1) One more Fed hike in May… and then cuts late in the year. This is based on the Fed’s target terminal rate of about 5.1%. Currently, we’re at about 4.9%, so one more 25-bps increase will put us at the projected rate. However, Powell has continued to make it clear that they’re not married to this level, and we could see more hikes (or a pause or even cuts) based on what the data shows.

2) A credit crunch from the bank fallout. One of the reasons the Fed only raised rates by 25 bps this past March (instead of the 50 bps everyone originally expected) was because banks were going to do some of the heavy lifting. Following the banking crisis, experts agree that most banks will start limiting who they lend to, making credit even more difficult to access. Like rate hikes, this will help slow the economy and cool inflation.

3) Get ready for some kind of recession. Depending on who you talk to, it could just be a technical recession where growth contracts but we don’t feel the pain as deeply as we have in past recessions… or it could be a hard landing. While the labor market has stayed strong, manufacturing activity has dropped and the housing market has softened significantly. The yield curve has also re-inverted, and the New York Fed’s recession model predicts a 54.5% chance of a U.S. recession sometime in the next 12 months.

4) Higher-quality companies will be rewarded. Even though many experts say a recession looks inevitable at this point, investors don’t need to be relegated to the sidelines. Take this first quarter, for example. Anyone who was waiting to put their money to work has missed a chance for gains, even though the outlook for the beginning of the year looked bearish.

It will be interesting (dare I say, fun?) to look back at these predictions in three more months and see where things stand. What kind of predictions are you making for this year?

Are you buying quality, or is your portfolio risk-on? Do you think we’ll eventually see additional hikes, or are you one of the many who expect a cut later this year? I’m always excited to see what’s on y’alls minds.

Good trading!

What To Do Next?

If you’d like to see more top stocks under $10, then you should check out our free special report:

3 Stocks to DOUBLE This Year

What gives these stocks the right stuff to become big winners, even in this brutal stock market?

First, because they are all low priced companies with the most upside potential in today’s volatile markets.

But even more important, is that they are all top Buy rated stocks according to our coveted POWR Ratings system and they excel in key areas of growth, sentiment and momentum.

Click below now to see these 3 exciting stocks which could double or more in the year ahead.

3 Stocks to DOUBLE This Year

All the Best!

Meredith Margrave
Chief Growth Strategist, StockNews
Editor, POWR Stocks Under $10 Newsletter


SPY shares closed at $409.19 on Friday, up $1.59 (+0.39%). Year-to-date, SPY has gained 7.41%, versus a % rise in the benchmark S&P 500 index during the same period.


About the Author: Meredith Margrave

Meredith Margrave has been a noted financial expert and market commentator for the past two decades. She is currently the Editor of the POWR Growth and POWR Stocks Under $10 newsletters. Learn more about Meredith’s background, along with links to her most recent articles.

More…

The post 4 Key Lessons Learned From Q1 in the Stock Market… appeared first on StockNews.com

https://www.entrepreneur.com/finance/4-key-lessons-learned-from-q1-in-the-stock-market/449331


3 Charts Point to More Bearish Downside Ahead

There are finally cracks in the previously resilient employment foundation of the economy. This is leading more investors to become bearish on the stock market. That is hard to see through the lens of the S&P 500 (SPY). However it becomes MUCH more apparent when you review these 3 charts. Read on below for the full story.

With the market closed on Good Friday we will do the weekly commentary a day earlier. But do not confuse this shortage of trading days with a shortage of important things to discuss.

That’s because there seems to be something interesting afoot which I first noted in my previous commentary, Recession Alert: Are We There Yet?

The increased concern is that this week started with shockingly bad results for ISM Manufacturing including very low reading for employment. From there the pain train kept rolling downhill. This clearly explains the Risk Off activity on the week.

Full details on that, along with our updated trading plan is what is on tap. Just keep reading on for more below…

Market Commentary

We have seen weak economic data on and off for over a year. Just remember that Q1 and Q2 of last year actually saw negative GDP results.

However, the reason it was not technically called a recession is because there was no job loss. That measure of pain, along with economic contraction, is what makes a recession.

These past events have made it easy for some investors to slough off weak economic readings while still buying up stocks. The key for the recession watch at this point is to finally see cracks in the employment picture. And those are starting to add up as I shared earlier this week. Here is the key section:

“Now let’s follow that interesting thread about the depressed reading for the ISM Manufacturing Employment component which is now at the lowest post Covid level, 46.9. Many of us have pondered, including the Fed, what it will take for employment to finally weaken because that is likely the key nail in the high inflation coffin.

So this weak reading is a curious start to wondering if employment is finally ready to rollover. And just the very next day we get another clue that this trend may finally be afoot. That being the precipitous 632,000 drop in job openings from the monthly JOLTs report that makes it the lowest level since May 2021.

Think about it this way..

Step 1 before laying people off is to stop hiring new employees. This lowering of job openings may be that lynchpin for Step 2 being much larger layoffs around the corner that would lead to a rise in unemployment.

Let’s remember the vicious cycle that takes place once job loss is in the economic mix:

Job Loss > Lower Income > Lower Spending > Lower Corporate Profits > Rinse & Repeat

The “Rinse & Repeat” aspect is an acknowledgement that most often the solution to lower corporate profits is to lay off more employees. And that is how a crack in the unemployment foundation can become a much wider chasm over time.”

Since then, there have been 3 more shots fired pointing to a weakening of the employment picture. That includes Wednesday’s ADP Employment Change coming in at only 145K job gains when 200K was expected and considerably lower than last month’s 261K reading.

Later in the same day the ISM Services report not only dropped from 55.1 all the way down to 51.2 echoing weakness found in the ISM Manufacturing report, but the Employment component also took it on the chin. The services sector was the strength of employment and that declined markedly.

Then on Thursday we found that “Layoffs Are Up Nearly Fivefold So Far This Year“. Those announcements are often like a snowball that rolls downhill getting larger and larger until an avalanche forms.

The sum total of this bad employment news has many investors lowering their expectations for Friday’s Government Employment Situation report. The current forecast of 250K jobs added seems far too steep given the evidence in hand.

Also, investors will be very mindful of the month over month wage increase reading. This has been the form of sticky inflation the Fed has been most concerned about.

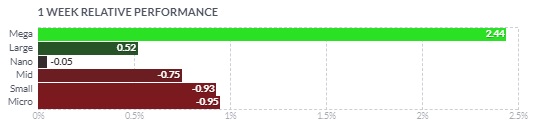
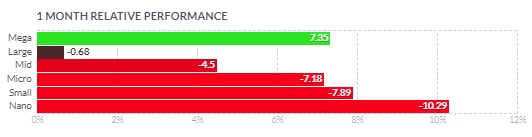
The Risk Off nature of all this news is not so obvious from the modest decline for the S&P 500 (SPY) this week. Rather it shows up more clearly by looking at divergence between large and small stocks in this chart.

Now let’s pull back to the past month and see what it shows:

Amazingly the overall market is up in the past month if you are just looking at the S&P 500. Yet as you can see now that is ONLY happening in the largest stocks. So now let’s look at performance by sector the past month:

These Risk Off facts in price action are quite bearish as it shows concerted “Flight to Safety” in both larger stocks and the most conservative sectors.

Now combine that with warning signs from the economy, most notably what appears to be the first rumblings of problems in employment. When you add it all up it points to now being another time to strongly consider the virtues of being bearish in your portfolio.

What To Do Next?

Watch my brand new presentation, REVISED: 2023 Stock Market Outlook

There I will cover vital issues such as…

  • 5 Warnings Signs the Bear Returns Starting Now!
  • Banking Crisis Concerns Another Nail in the Coffin
  • How Low Will Stocks Go?
  • 7 Timely Trades to Profit on the Way Down
  • Plan to Bottom Fish for Next Bull Market
  • 2 Trades with 100%+ Upside Potential as New Bull Emerges
  • And Much More!

If these ideas concern you, then please click below to access this vital presentation now:

REVISED: 2023 Stock Market Outlook >

Wishing you a world of investment success!

Reity
Steve Reitmeister…but everyone calls me Reity (pronounced “Righty”)
CEO, StockNews.com

Editor of Reitmeister Total Return & POWR Value


SPY shares fell $0.19 (-0.05%) in after-hours trading Thursday. Year-to-date, SPY has gained 7.41%, versus a % rise in the benchmark S&P 500 index during the same period.


About the Author: Steve Reitmeister

Steve is better known to the StockNews audience as “Reity”. Not only is he the CEO of the firm, but he also shares his 40 years of investment experience in the Reitmeister Total Return portfolio. Learn more about Reity’s background, along with links to his most recent articles and stock picks.

More…

The post 3 Charts Point to More Bearish Downside Ahead appeared first on StockNews.com

https://www.entrepreneur.com/finance/3-charts-point-to-more-bearish-downside-ahead/449231


Is This the End of the ChatGPT-Inspired Rally in This Stock?

The hype surrounding generative artificial intelligence has been the rising tide that has lifted many boats, including C3.ai (AI), which has waded into a serious controversy and could find itself stranded once the tide goes out. Read on.

The stock of C3.ai, Inc. (AI), which has been riding the hype surrounding generative artificial intelligence after ChatGPT, the artificial intelligence chatbot launched by Open AI late in November 2022, took the world by storm to become the fastest-growing application in history.

That unraveled recently when short-seller Kerrisdale Capital sent a letter to Deloitte & Touche LLP, the auditor of AI, detailing serious accounting irregularities that raise red flags for investors. The company has been accused of numerous dishonest accounting practices, such as inflating gross profit margins by shifting expenses to different categories. Right on cue, the stock crashed 26% on Tuesday.

Moreover, AI’s stock declined 15.5% intraday to close the last trading session at $21.09. Although the stock has gained 56.3% over the past six months, an already ebbing popularity, the stock has lost 26% over the past month. It has a short float of 27.30%.

On January 31, AI announced the launch of its generative AI product suite. Although the business is yet to find its way to profitability, AI seeks to differentiate itself from other vendors that only provide piecemeal solutions by providing an end-to-end platform-as-a-service to develop, deploy, and operate large-scale turnkey industry-specific AI applications.

Regardless of whether there is merit in the recent allegations of accounting irregularities against AI, let’s delve deeper into its fundamentals as currently available in the public domain.

Dip In Financial Performance

For the third quarter of the fiscal year 2023, which ended January 31, 2023, AI’s total revenue declined by 4.4% year-over-year to $66.67 million, while its non-GAAP gross profit declined by 8.6% year-over-year to $50.96 million.

During the same period, AI’s non-GAAP loss from operations came in at $15.03 million, while its non-GAAP net loss amounted to $6.16 million, or $0.06 per share.

AI’s total assets stood at $1.10 billion as of January 31, 2023, compared to $1.17 billion as of April 30, 2022.

Elusive Profitability

Although AI’s trailing-12-month gross profit margin of 70.46% is 39.9% higher than the industry average of 50.35%, the company is yet to operate at a scale and achieve enough penetration in the AI enterprise software market for its gross profits to offset its operating expenses.

AI’s trailing-12-month EBITDA and net income margins of negative 101.14% and 98.35% compare unfavorably to the respective industry averages of 9.78% and 2.71%.

In terms of the trailing-12-month ROCE, ROTC, and ROTA, AI underperforms even the modest industry averages of 2.65%, 2.06%, and 0.67%, respectively.

Stretched Valuation

Despite the recent drawdown in price, AI is still trading at valuations that the company might struggle to justify in the foreseeable future.

In terms of forward EV/Sales, AI is trading at 7.60x, 174.8% higher than the industry average of 2.77x. Also, the stock’s forward Price/Sales multiple of 10.55 compares unfavorably with the industry average of 2.70.

Bleak Outlook

Analysts expect AI’s revenue for the fourth quarter of the fiscal year 2023, ending April 30, to come in at $71.07 million, indicating a 1.7% decline year-over-year. During the same period, the company’s loss per share is expected to come in at $0.18.

Street expects the company to keep reporting net losses until the fiscal year 2025.

POWR Ratings Reflect Weakness

AI’s fundamental weakness is reflected in its overall D rating, which equates to Sell in our proprietary POWR Ratings system. The POWR Ratings are calculated considering 118 different factors, with each factor weighted to an optimal degree.

Our proprietary rating system also evaluates each stock based on eight different categories. AI has grade D for Value and Quality, owing to its stretched valuation and lower profitability relative to its peers.

AI also has a D grade for Stability, consistent with its beta of 1.40 and relatively high spread between its 52-week high and low prices of $34.68 and $10.16, respectively.

Unsurprisingly, AI is ranked penultimate of 23 stocks in the Software – SAAS industry.

Beyond what has been discussed above, additional ratings for Growth, Momentum, and Sentiment of AI can be found here.

Bottom Line

Notwithstanding the recent controversy and in addition to macroeconomic headwinds making near-term prospects for growth businesses such as AI uncertain at best, the company is also in the process of adjusting to strategic changes it has implemented in its pricing model and sales organization.

AI has transitioned from a subscription-based pricing model to a consumption-based pricing model. While the company believes that this shift would increase the number and frequency of small transactions from a broader customer base for long-term revenue growth, potential spending cuts by high-profile clients during a probable economic slowdown might put the short-term effectiveness of the model into question.

Hence in view of the above, we believe it would be wise to avoid fundamentally weak AI until its prospects become clearer.

Stocks to Consider Instead of C3.ai, Inc. (AI)

Unfortunately, the odds of AI outperforming in the weeks and months ahead are greatly compromised. However, there are many stocks in the Software – SAAS industry with impressive POWR Ratings. So, you may consider these three A-rated (Strong Buy) or B-rated (Buy) stocks instead:

Informatica Inc. (INFA)

Park City Group, Inc. (PCYG)

MiX Telematics Limited (MIXT)

What To Do Next?

Get your hands on this special report:

7 SEVERELY Undervalued Stocks

The best part of the recent bear market is that there are thriving companies trading at tremendous discounts to fair value.

This combination of stellar earnings growth and low price provides a great catalyst for investor success.

And this report focuses on the 7 best of these stocks primed to soar in the weeks ahead. Click below to claim your copy now.

7 SEVERELY Undervalued Stocks


AI shares were unchanged in premarket trading Thursday. Year-to-date, AI has gained 88.47%, versus a 6.99% rise in the benchmark S&P 500 index during the same period.


About the Author: Santanu Roy

Having been fascinated by the traditional and evolving factors that affect investment decisions, Santanu decided to pursue a career as an investment analyst. Prior to his switch to investment research, he was a process associate at Cognizant. With a master’s degree in business administration and a fundamental approach to analyzing businesses, he aims to help retail investors identify the best long-term investment opportunities.

More…

The post Is This the End of the ChatGPT-Inspired Rally in This Stock? appeared first on StockNews.com

https://www.entrepreneur.com/finance/is-this-the-end-of-the-chatgpt-inspired-rally-in-this-stock/449148