3 Affordable Pharma Stocks to Buy for Portfolio Gains

The pharmaceutical market is anticipated to grow substantially in the upcoming years, owing to technological innovation and rising demand for personalized medicines. To that end, affordable pharma stocks ACADIA Pharmaceuticals (ACAD), Astellas Pharma (ALPMY), and Spero Therapeutics (SPRO), trading under $20, could be solid buys now. Read on….

The pharmaceutical industry is undergoing a transformative boom, leveraging digital platforms, big data analytics, cloud computing, and AI to drive innovation. Moreover, the growing demand for personalized drugs and increased R&D activities should give an additional boost to the already burgeoning industry.

Therefore, fundamentally robust pharma stocks ACADIA Pharmaceuticals Inc. (ACAD), Astellas Pharma Inc. (ALPMY), and Spero Therapeutics, Inc. (SPRO), trading under $20, could be wise portfolio additions now.

The global use of medicines increased by 14% over the past five years, and a 12% rise is anticipated through 2028, bringing annual usage to 3.80 trillion defined daily doses. The growing prevalence of chronic diseases and rising demand for medical care amid the increasing aging population have contributed to the pharmaceutical market’s resilience in the future.

With the rise in demand for treating chronic diseases such as cancer, diabetes, and more, along with increased R&D activity for new drugs and treatments, the drug discovery informatics market is projected to reach $7.90 billion by 2032, growing at a 10.5% CAGR. These growing trends also include the growth and demand for personalized medicine, which has bolstered the pharma market.

As per the American Society of Health-System Pharmacists, the ongoing drug shortages in the U.S. have reached an all-time high since 2001, at 323 drugs at the end of the first quarter this year. With the growing demand for drugs, this shortage will potentially boost prices.

Moreover, pharmaceutical firms are adopting tech for personalized drug production, requiring adaptable facilities. In 2023, AI emerged as crucial in drug discovery, and it is expected to continue enhancing research efficiency in 2024.

Considering these conducive trends, let’s take a look at the fundamentals of the three Medical – Pharmaceuticals stocks, beginning with the third choice.

Stock #3: ACADIA Pharmaceuticals Inc. (ACAD)

ACAD develops and commercializes innovative medicines that address unmet medical needs in central nervous system (CNS) disorders and rare diseases in the U.S.

In terms of forward EV/Sales, ACAD is trading at 2.62x, 25.9% lower than the industry average of 3.54x. The stock’s forward Price/Sales multiple of 3.02 is 17.8% lower than the industry average of 3.67.

Over the past three and five years, its revenue grew at CAGRs of 18% and 26.6%, respectively, while its total assets grew at a 6.8% CAGR over the past five years.

For the fiscal fourth quarter that ended December 31, 2023, ACAD’s total revenues increased 69.3% year-over-year to $231.04 million. Moreover, its income from operations came to $34.94 million, compared to a loss from operations of $46.06 million in the prior-year quarter.

For the same quarter, its net income and earnings per share stood at $45.80 million and $0.28, compared to net loss and net loss per share of $41.73 million and $0.26, respectively.

Street expects ACAD’s revenue for the fiscal first quarter that ended March 2024 to increase 76.3% year-over-year to $208.82 million. Its EPS is expected to be $0.06 for the same quarter. The company surpassed consensus revenue estimates in three of the trailing four quarters, which is impressive.

The stock has declined 1.8% intraday to close the last trading session at $17.41.

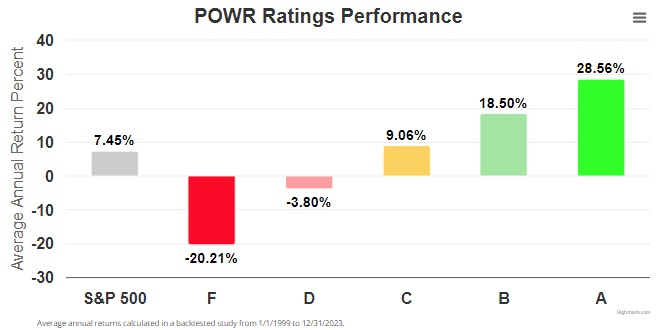
ACAD’s POWR Ratings reflect its positive prospects. The stock has an overall B rating, equating to Buy in our proprietary rating system. The POWR Ratings are calculated by considering 118 distinct factors, with each factor weighted to an optimal degree.

ACAD has an A grade for Growth and a B for Value and Quality. Within the Medical – Pharmaceuticals industry, it is ranked #28 out of 160 stocks.

To see additional POWR Ratings for Momentum, Stability, and Sentiment for ACAD, click here.

Stock #2: Astellas Pharma Inc. (ALPMY)

Headquartered in Tokyo, Japan, ALPMY manufactures, markets, and imports and exports pharmaceuticals in Japan and internationally. The company mainly operates Pharmaceutical Products business segment.

On March 28, ALPMY announced that the Center for Drug Evaluation (CDE) of the China National Medical Products Administration (NMPA) accepted the supplemental Biologics License Application (sBLA) for enfortumab vedotin with KEYTRUDA (pembrolizumab) as a combination therapy for the first-line treatment of adult patients with previously untreated locally advanced or metastatic urothelial cancer (la/mUC).

If approved, enfortumab vedotin with KEYTRUDA has the potential to change the treatment paradigm, becoming the first combination treatment to offer an alternative to platinum-containing chemotherapy, the current standard of care in first-line la/mUC. 

On March 26, ALPMY announced that the U.S. Centers for Medicare and Medicaid Services assigned a unique, permanent Healthcare Common Procedure Coding System (HCPS) J-code for IZERVAY (avacincaptad pegol intravitreal solution) for the treatment of geographic atrophy secondary to age-related macular degeneration. The new J-code, J2782, is effective since April 1.

Its annualized dividend rate of $0.47 per share translates to a dividend yield of 4.62% on the current share price. Its four-year average yield is 2.76%.

In terms of forward EV/Sales, ALPMY is trading at 2.17x, 38.7% lower than the industry average of 3.54x. The stock’s forward Price/Sales multiple of 1.80 is 51.1% lower than the industry average of 3.67.

Over the past three and five years, its revenue grew at CAGRs of 7.2% and 3.4%, respectively, while its total assets grew at 13.6% and 11.8% CAGRs over the same periods.

For the nine months that ended December 31, 2023, ALPMY’s revenue and gross profit increased 2.1% and 3.4% year-over-year to ¥1.19 trillion ($7.77 billion) and ¥969.81 billion ($6.33 billion), respectively. Moreover, its core operating profit stood at ¥149.62 billion ($977.26 million).

For the same period, its core profit and basic core earnings per share stood at ¥120.51 billion ($787.09 million) and ¥67.20, respectively.

Street expects ALPMY’s revenue for the fiscal year that ended March 2024 to increase 124.2% year-over-year to $10.27 billion. Its EPS is expected to be $0.24 for the same period. The company surpassed consensus revenue estimates in three of the trailing four quarters.

The stock has gained marginally intraday to close the last trading session at $10.29.

ALPMY’s POWR Ratings reflect this promising outlook. It has an overall rating of B, which translates to a Buy in our proprietary rating system.

ALPMY has an A grade for Stability and a B for Value. Within the same industry, it is ranked #21.

For ALPMY’s other ratings (Growth, Momentum, Sentiment, and Quality), click here.

Stock #1: Spero Therapeutics, Inc. (SPRO)

SPRO identifies, develops, and commercializes novel treatments for multi-drug resistant (MDR) bacterial infections and rare diseases in the U.S. 

On February 28, SPRO received clearance by the U.S. Food and Drug Administration (FDA) for its investigational new drug application, to evaluate SPR206 in a Phase 2 clinical study. SPR206 is a novel, intravenously (IV) administered next-generation polymyxin antibiotic for the treatment of hospital-acquired and ventilator-associated bacterial pneumonia caused by MDR Gram-negative bacterial infections.

On January 2, SPRO announced the first patient, first visit for PIVOT-PO, a global pivotal Phase 3 clinical trial of tebipenem HBr in patients with complicated urinary tract infections, including acute pyelonephritis.

In terms of forward EV/Sales, SPRO is trading at 0.43x, 87.8% lower than the industry average of 3.54x. The stock’s forward Price/Sales multiple of 1.90 is 48.3% lower than the industry average of 3.67.

Over the past three and five years, its revenue grew at CAGRs of 123.2% and 92.1%, respectively, while its total assets grew at 5.9% and 7.2% CAGRs over the same periods.

For the fiscal fourth quarter that ended December 31, 2023, SPRO’s total revenues and net income attributable to common shareholders of SPRO increased 55% and 91.2% year-over-year to $73.52 million and $51.19 million, respectively.

As of December 31, 2023, SPRO’s total current assets, and accrued expenses and other current liabilities amounted to $131.21 million and $6.56 million, compared to $113.57 million and $8.97 million as of December 31, 2022, respectively.

Street expects SPRO’s revenue for the fiscal first quarter that ended March 2024 to increase 940.8% year-over-year to $21.53 million. The company surpassed consensus revenue estimates in each of the trailing four quarters and consensus EPS estimates in three of the trailing four quarters.

The stock has gained 46.2% over the past six months to close the last trading session at $1.71. Over the past three months, it has gained 17.1%.

SPRO’s robust prospects are reflected in its POWR Ratings. The stock has an overall B rating, equating to Buy in our proprietary rating system.

SPRO has an A grade for Value and a B for Sentiment and Quality. It is ranked #18 within the same industry.

Click here for the additional POWR Ratings for SPRO (Growth, Momentum, and Stability).

What To Do Next?

43 year investment veteran, Steve Reitmeister, has just released his 2024 market outlook along with trading plan and top 11 picks for the year ahead.

2024 Stock Market Outlook >


ALPMY shares were unchanged in premarket trading Friday. Year-to-date, ALPMY has declined -13.53%, versus a 9.32% rise in the benchmark S&P 500 index during the same period.


About the Author: Neha Panjwani

From her school days, Neha harbored a profound fascination for finance, a passion that steered her toward a career as an investment analyst following the completion of her bachelor’s degree in commerce. Currently enrolled in the CFA program, Neha is dedicated to further enriching her comprehension of investment fundamentals. Neha’s primary objective is to aid retail investors in discerning optimal investment opportunities by diligently evaluating crucial aspects of financial instruments, with a primary focus on stocks and ETFs. Her commitment lies in empowering individuals to make informed and strategic investment decisions in the dynamic world of finance.

More…

The post 3 Affordable Pharma Stocks to Buy for Portfolio Gains appeared first on StockNews.com

https://www.entrepreneur.com/finance/3-affordable-pharma-stocks-to-buy-for-portfolio-gains/472607


What Data Should Investors Focus on Now?

The S&P 500 (SPY) is up nearly 50% from the bear market lows. That is a sign the easy money has been made. The next likely catalyst for stocks will probably be the first Fed rate cut…but maybe that is really the final push before a long overdue sell off? Tune in to discover what investment veteran Steve Reitmeister has to say about the market outlook along with his trading plan and top picks to stay ahead of the pack. Read on below for more.

It is clear that the Fed decision to lower rates is the main catalyst everyone is waiting for. The next chance that could happen is on Wednesday May 1st.

Since the Fed is “data dependent” (as they repeat like a skipped record) then we are best served focusing on the calendar of upcoming data…and what that tells us about the rate cut decision and market outlook. Read on below for the full story…

Market Commentary

The backdrop is simple. The Fed seems to be successfully guiding the economy towards a soft landing while at the same time easing inflation back towards the 2% target.

As Powell detailed at the last meeting, the Fed can indeed start lowering rates before they arrive at the 2% target because rates would still be restrictive after the first cut. Secondly, there are delayed effects of raised rates and if you waited til you got to precisely 2% you may actually risk doing unnecessary damage to jobs market (which is the other half of their dual mandate of maintaining steady prices and maximum employment).

Right now, virtually no one expects that rate cut to take place at the May 1st meeting as the last round of inflation data was a tad too hot. Thus, just one more serving of monthly inflation data in April would not be enough to get these academics to vote confidently in a rate cut.

Instead, the focus is on whether June 12th will be the starting line for rate cuts. Presently the CME calculates that as a 65% probability. But again, that is data dependent on the roll call of reports taking place in coming weeks…and what Powell shares with the market on his May 1st press conference.

Here are the key economic reports along with some notes to put them into perspective:

3/28 Core PCE- This is the Fed’s preferred measure of inflation which has been at 2.0% the past two quarters. Even better is the non-core reading for Q4 of 1.8% which is down considerably from the 2.6% showing in Q3. This data should go a long way towards a June rate cut.

4/5 Government Employment Situation: What will be even more important than the number of jobs added will be the reading on Wage Inflation. That was too hot last month at +4.3% year over year. Need to keep seeing this sticky form of inflation become unstuck at this high level. The month over month reading will be helpful in appreciating the pace of decline. Anything over 0.2% monthly increase would point to unwanted inflationary pressures from wages.

4/10 Consumer Price Index (CPI): This has been nicely on the decline over the past year, but last month was a tad higher than expected at 3.8% core inflation with 0.4% monthly increase. This needs to start moving under 3% in coming months to improve odds of a cut on the way.

4/10 FOMC Minutes: Its hard to imagine more details emerging than the voluminous comments that Powell made at the March 20th press conference. Yet you can imagine that investors will pick over every word to find any clue that would point to a likely starting line for rate cuts.

4/11 Producer Price Index (PPI): The least followed of the 3 main inflation reports, but what many economists appreciate as the leading indicator of where the other reports will trend in time. Note that this is already on target at 2% and portends well for the continued reduction in PCE and CPI towards that desired level.

5/1 Fed Meeting: 2pm ET is when the press release comes out. And 2:30pm is the even more important press conference with Powell where we get a lot more color commentary. Given the facts in hand investors are right to highly doubt the rate cut is happening at this time. The real key is if they showed improved language that June is in play.

Trading Plan

We are in a bull market. This is a shock to no one.

What is unclear is the pace of forthcoming gains when we are already up 50% in just 1.5 years time. Please remember that closer to 8% annual gains is the expected normal return.

I suspect 5,500 is the top of the S&P 500 (SPY) this year. Meaning that the catalyst for stocks from a rate hike is pretty much already baked into the cake.

This led me to write my previous article, Investor Alert: “Buy the Rumor, Sell the News!”

The short version is that I would not be surprised with stocks rallying into the rate cut announcement followed by a well deserved round of profit taking. Unfortunately, right around the corner form that sell off…is likely another selloff that coincides with the Presidential election pattern.

As stated before, this is not a reason to get bearish or conservative. Best to assume bull market and general upside til proven otherwise. The key is WHAT stocks will see the most gains.

We know that growth stocks generally lead the parade in the early stages of a new bull market. This is especially clear from where gains rolled in back in 2023.

What happens after a growth oriented phase is a return to value. This makes investors work a little harder to find attractive opportunities. This is where the thorough 118 factor review of our POWR Ratings model comes in quite handy.

The model does the heavy lifting by doing this deep dive into the fundamental attractiveness of the firms. The top 5% are A rated which explains why it has produced a +28.56% average annual return going back to 1999 (nearly 4X better than the S&P 500).

That top 5% is the starting point for our stock selection…then continue to drill down from there to find stocks with the most appealing upside potential.

What top stocks are we recommending now?

Read on below for the answers…

What To Do Next?

Discover my current portfolio of 12 stocks packed to the brim with the outperforming benefits found in our exclusive POWR Ratings model. (Nearly 4X better than the S&P 500 going back to 1999)

This includes 5 under the radar small caps recently added with tremendous upside potential.

Plus I have 1 special ETF that is incredibly well positioned to outpace the market in the weeks and months ahead.

This is all based on my 43 years of investing experience seeing bull markets…bear markets…and everything between.

If you are curious to learn more, and want to see these lucky 13 hand selected trades, then please click the link below to get started now.

Steve Reitmeister’s Trading Plan & Top Picks >

Wishing you a world of investment success!


Steve Reitmeister…but everyone calls me Reity (pronounced “Righty”)
CEO, StockNews.com and Editor, Reitmeister Total Return


SPY shares were trading at $523.36 per share on Thursday afternoon, up $0.19 (+0.04%). Year-to-date, SPY has gained 10.45%, versus a % rise in the benchmark S&P 500 index during the same period.


About the Author: Steve Reitmeister

Steve is better known to the StockNews audience as “Reity”. Not only is he the CEO of the firm, but he also shares his 40 years of investment experience in the Reitmeister Total Return portfolio. Learn more about Reity’s background, along with links to his most recent articles and stock picks.

More…

The post What Data Should Investors Focus on Now? appeared first on StockNews.com

https://www.entrepreneur.com/finance/what-data-should-investors-focus-on-now/471916


Updated 2024 Stock Market Outlook

The bull market continues to rage on with the S&P 500 (SPY) making new highs. That is the past…the question is what does the future hold? That is why 44 year investment veteran Steve Reitmeister provides this updated 2024 Stock Market Outlook to help you carve a path to outperformance the rest of the year. Read on below for the full story.

Tell me if you see the pattern…

2019 Bull Market

2020 Bear Market

2021 Bull Market

2022 Bear Market

2023 Bull Market

Given the above, the logical question on everyone’s mind should be…Will the bear market come back again in 2024?

This led to me record a brand new presentation this week that covers vital topics including:

  • How Did We Get Here?
  • What Comes Next?
  • S&P 500 (SPY) Year End Target
  • Trading Plan
  • 12 Top Stocks to Buy Now
  • And Much More!

Gain access to this vital presentation now by clicking below:

Updated 024 Stock Market Outlook >

Let me pull back the curtain on this presentation just a little more so you can appreciate why now is the perfect time to watch this presentation…

The goal was to give you a running head start to outperform the rest of the year.

First off, we need to appreciate the easy has been made this year given a 46% gain from the bear market bottom.

Second, that many sectors of the market are not just fully valued…but quite overvalued.

So, this means the path to future outperformance is investing in many of the sectors and stocks that have been left behind.

Gladly we have a big advantage with our POWR Ratings model to find healthy growing companies trading at a discount.

Focusing on those stocks has led to a 31% return since the beginning of November vastly outperforming the broader market.

And now I am zeroing in on 12 stocks that have the right ingredients to generate substantial gains the rest of the year.

All this and more awaits you in my new presentation. So, just click below to start watching now:

Updated 2024 Stock Market Outlook >

Wishing you a world of investment success!

Steve Reitmeister
…but everyone calls me Reity (pronounced “Righty”)
CEO StockNews.com & Editor of Reitmeister Total Return


SPY shares were trading at $521.56 per share on Friday morning, down $0.64 (-0.12%). Year-to-date, SPY has gained 10.07%, versus a % rise in the benchmark S&P 500 index during the same period.


About the Author: Steve Reitmeister

Steve is better known to the StockNews audience as “Reity”. Not only is he the CEO of the firm, but he also shares his 40 years of investment experience in the Reitmeister Total Return portfolio. Learn more about Reity’s background, along with links to his most recent articles and stock picks.

More…

The post Updated 2024 Stock Market Outlook appeared first on StockNews.com

https://www.entrepreneur.com/finance/updated-2024-stock-market-outlook/471594


Stock Trading Plan AFTER the Fed Announcement

Investors held their breath going into the 3/20 Fed announcement. Clearly they liked what they heard as the S&P 500 (SPY) bolted to new all time highs. With so much gains already in hand since the bull market began it begs the question of how much upside is truly left. Gladly Steve Reitmeister sees a path to outperformance even if the overall market starts to produce lackluster returns. Read on below for more.

The Fed announcement on Wednesday was about as positive as you could get for a period that came with no rate cut. That is because inflation data of late has been a touch too high and seemed to lower the odds that the Fed would stick to previous statements about 3 rate cuts this year.

Gladly the language was pretty clear that they still expect to cut relatively soon (most signs point to June). This gives plenty of time for 3 cuts on the year ending closer to the 4.6% estimate of Fed officials. With that, stocks bolted to new all time highs above 5,200 for the S&P 500 (SPY).

Let’s dig in a bit deeper on the ample evidence presented by the Fed…what it means for the future of rates…and what that foretells for our stock investment plans.

Market Commentary

Markets were flat going into 2pm ET Fed announcement on Wednesday. The immediate statement that they plan to stay on pace with 3 rate hikes this year got stocks on the upswing. Next came Powells press conference where more dovish language was shared.

As for the overall economy they now project +2.1% GDP growth for the rest of the year. Down from last year which they see as helpful in bringing inflation back down to target level…but no worries of recession.

The current rate is the likely peak for rates. So that means there is no reason to worry about raising rates (not that anyone was worried). Just a matter of when they are comfortable enough to start to lower them. Better to be too late than too early.

The dot plot from Fed officials points to an expected 4.6% rate at end of this year and 3.9% at end of 2025. That is very modest change next year and no doubt less accommodation than most investors expect to be true.

Here is one of the more interesting exchanges at the press conference. Powell was asked how to reconcile statements that they want inflation back towards 2% target…but they might start lowering rates BEFORE that happens. Thus, how can you reconcile those 2 statements?

Powell’s answer was very informative that there are lagged effects on rate policy. Since they are already in restrictive territory then the first rate cut would still leave high rates in place…just not as high…easing our way towards 2% inflation target.

I liken what he said to a car going 50 miles an hour coming into a red light up ahead. Very dangerous to slam on the brakes at the end. Better to start pumping the brakes at the earliest possible juncture to arrive at the stop light safely. That is how they can start lowering rates in phases even if not already at the desired 2% inflation target.

Another great question was whether there is enough time…and enough data to take place between now and the May 1st meeting to issue the first rate cut. Powell did well to essentially dodge that bullet with language about taking each meeting one at a time…and that they are data dependent etc.

Yet it wasn’t too difficult to see through his statements to appreciate that it is very unlikely for the first cuts to come in May. Not surprisingly the odds of that are now down to 6% when they were at 33% just a month ago.

The June 12th meeting continues to look like the most likely time with odds now at 74% likelihood. That is up from 60% just a week ago.

I previously gave this much lower odds of taking place given the typically conservative nature of the Fed. That includes statements about how they would rather be too late with rate cuts as opposed to too early.

But when you add the notion of 3 rate cuts this year with only 5 meetings from June til December….plus the notion that they are comfortable making the first cut before they have reached 2% inflation target…then yes, June is a very likely first spot to cut rates.

This would make it easy to alternate leaving rates steady at the next meeting followed by another quarter point cut…rinse and repeat into year end making 3 cuts in total and closer to 4.6% estimated by Fed officials.

Just as interesting there was also talk about slowing the pace of selling Fed assets (bonds). This is what we call Quantitative Tightening which was also part of the story to raise rates (because higher supply of bonds in public markets leads to higher rates to attract investors). So just like the rate cut decision, they would want to also slow Quantitative Tightening as a means to lower rates and be more accommodative.

All in all this was a clearly dovish meeting allowing stocks to break to new highs once again above 5,200. Plus Thursday we saw more of that upside unfold.

What was even more welcome than the gains to the large caps in the S&P 500 was broadening out of gains to smaller stocks. Like the +1.92% tally on Wednesday for the Russell 2000 (more than double the S&P 500 returns). This outperformance continued on Thursday as well.

It truly has been 4 years that large caps have beaten the returns of smaller stocks. This is NOT the norm as historically small caps have higher growth which begets correspondingly higher stock price gains.

It is high time that smaller stocks led the charge. That is the healthiest thing that could happen for the longevity of this bull market (instead of the Jenga style piling on top for the Magnificent 7…because that is unstable in the long run.)

Plus at this stage stocks the S&P 500 is pushing a fairly high PE of 21X forward earnings. That is a bit rich for a below trend earnings environment.

Once again, this points to it being time for a greater consideration towards value, which is more available in small and mid cap stocks.

Read on below for more details on my favorite stocks at this time…

What To Do Next?

Discover my current portfolio of 12 stocks packed to the brim with the outperforming benefits found in our exclusive POWR Ratings model. (Nearly 4X better than the S&P 500 going back to 1999)

This includes 5 under the radar small caps recently added with tremendous upside potential.

Plus I have 1 special ETF that is incredibly well positioned to outpace the market in the weeks and months ahead.

This is all based on my 44 years of investing experience seeing bull markets…bear markets…and everything between.

If you are curious to learn more, and want to see these lucky 13 hand selected trades, then please click the link below to get started now.

Steve Reitmeister’s Trading Plan & Top Picks >

Wishing you a world of investment success!


Steve Reitmeister…but everyone calls me Reity (pronounced “Righty”)
CEO, StockNews.com and Editor, Reitmeister Total Return


SPY shares were trading at $521.55 per share on Friday morning, down $0.65 (-0.12%). Year-to-date, SPY has gained 10.07%, versus a % rise in the benchmark S&P 500 index during the same period.


About the Author: Steve Reitmeister

Steve is better known to the StockNews audience as “Reity”. Not only is he the CEO of the firm, but he also shares his 40 years of investment experience in the Reitmeister Total Return portfolio. Learn more about Reity’s background, along with links to his most recent articles and stock picks.

More…

The post Stock Trading Plan AFTER the Fed Announcement appeared first on StockNews.com

https://www.entrepreneur.com/finance/stock-trading-plan-after-the-fed-announcement/471593


Should Investors BEWARE this Market?

The S&P 500 (SPY) has been on a tear since November 1st when the Fed started to make their dovish tilt opening the door to future rate cuts. Unfortunately they keep not happening and start date keeps getting pushed further and further out. That has many wondering if stocks are getting ahead of themselves setting things up for a fall. Thus a good time to tune into what investment veteran Steve Reitmeister has to say about the market outlook along with his trading plan and top picks to stay ahead of the pack. Read on below for more.

As you likely remember from your English Lit classes, sometimes you have to…”Beware the Ides of March“.

That was 3/15, the date Julius Cesar was assassinated and is often viewed as an important check point for investors at this early stage of the new year.

Overall, there is not much to beware as most signs continue to point bullish. On the other hand, the S&P 500 (SPY) has rallied considerably the past few months where the overall market does seem ripe for at least a modest pullback, if not correction.

That concept and more will be at the forefront of today’s market commentary.

Market Commentary

Last week we contemplated; What Would Cause a Bear Market Now?

To boil it down, there are 2 likely causes of bear markets. First, is a looming recession which drags down earnings and risk taking leading to a thorough trimming of stock prices.

The second bear market precursor is the forming of a stock price bubble that becomes untenable. The last time that happened was back in 2000 with the bursting of the tech bubble. However, even the most ardent value investor would be hard pressed to make any such parallels to current conditions (maybe a few nosebleed AI stocks that deserve a haircut).

Putting those ideas together, there is not much reason to fear any looming bear market forming. On the other hand, there is not tremendous reason for stocks to press significantly higher as I shared in my last commentary: Is the Bull Market Growing Tired?

The main story there is about how the start date for Fed rate cuts keeps getting pushed further and further back. Please remember there was a time that folks expected that to take place in December 2023. Now we are writing off May 1st and HOPING June 12th is the starting line.

Not helping matters was the hotter than expected PPI report on Thursday morning where the month over month reading of +0.6% was twice the level expected.

With that news bond rates climbed and stocks fell on the session. Plus, the odds of a rate cut coming in June was shaved down to 60% when just a few weeks ago the probably was over 80%.

Hate to tell you this my friends, but I would say odds of a June cut is 50% at best…probably lower.

That’s because if the Fed is “data dependent” as they love to tell us, then the most recent data says that inflation is still too high. That includes the Sticky Inflation reading from earlier this week that remains over 4% and not moving fast enough towards the desired 2% target.

This calls into question if June is a real possibility when there is not enough inflation readings in that short stretch to unequivocally believe that high inflation is dead and buried. That is especially true given the Fed’s statements that they would rather cut rates too late than too early as they do not want any smoldering embers of inflation to reignite into a fire.

The most important event on the economic calendar is the March 20th Fed rate decision along with their quarterly Summary of Economic Projections. No one on the planet is expecting a rate cut at this meeting. However, they will scour every word in the report…and every statement and facial expression from Powell at the press conference looking for clues of what comes next.

No doubt someone at the press conference will ask Powell what he meant by the recent statement that rate cuts are “not far” off. Most likely, he walks that comment back with more “data dependent” talk and “better late than early” which clues investors in that even June may be too soon for the rate cut parade.

If true, then that may be the catalyst for the long awaited pullback from these current highs. Nothing scary. Just a healthy 3-5% pullback after the 25% rally from the October 2023 low.

However, there is no law that says that must happen. Instead, investors could just continue to just idle at this red light awaiting the green that eventually will happen when rates do get cut. This would be what you call a consolidation under 5,200 where the market average doesn’t move much…but results in ample sector rotation.

Some call that a “rolling correction” where each sector takes turns being on the outs even as the overall market indices don’t move much. Those sector focused sell offs cause appropriate dips in overripe positions. This is the best way to clear the path for the next healthy bull run.

Long story short, stay bullish. And stay focused on healthy growing companies that are attractively priced. The POWR Ratings continues to be your best friend in finding quality stocks.

More about that in the next section…

What To Do Next?

Discover my current portfolio of 12 stocks packed to the brim with the outperforming benefits found in our exclusive POWR Ratings model. (Nearly 4X better than the S&P 500 going back to 1999)

This includes 5 under the radar small caps recently added with tremendous upside potential.

Plus I have 1 special ETF that is incredibly well positioned to outpace the market in the weeks and months ahead.

This is all based on my 43 years of investing experience seeing bull markets…bear markets…and everything between.

If you are curious to learn more, and want to see these lucky 13 hand selected trades, then please click the link below to get started now.

Steve Reitmeister’s Trading Plan & Top Picks >

Wishing you a world of investment success!


Steve Reitmeister…but everyone calls me Reity (pronounced “Righty”)
CEO, StockNews.com and Editor, Reitmeister Total Return


SPY shares were trading at $510.73 per share on Friday morning, down $2.63 (-0.51%). Year-to-date, SPY has gained 7.45%, versus a % rise in the benchmark S&P 500 index during the same period.


About the Author: Steve Reitmeister

Steve is better known to the StockNews audience as “Reity”. Not only is he the CEO of the firm, but he also shares his 40 years of investment experience in the Reitmeister Total Return portfolio. Learn more about Reity’s background, along with links to his most recent articles and stock picks.

More…

The post Should Investors BEWARE of this Market? appeared first on StockNews.com

https://www.entrepreneur.com/finance/should-investors-beware-of-this-market/471271


What Would Cause a Bear Market Now?

We all appreciate that we are currently in a bull market with the S&P 500 (SPY) making new highs once again this week. However, it is prudent to ponder what could create a bear market as to be on the lookout. That is why Steve Reitmeister shares insights on the 2 main causes of bear markets. And how much of a concern that should be to investors at this time. Read on below for more.

A market that refuses to go down…will inevitably go up

And that simple logic is precisely what we see happening at this stage. Even as the start date for Fed rate cuts gets kicked further down the road, investors just don’t want to lose their grip on the stock market.

This helps explain why the S&P 500 (SPY) pushed to new highs once again on Thursday even as Fed officials are singing in unison about the dangers of cutting rates too soon. One has to assume this positive price trend will stay in place until there is a dramatically negative catalyst.

So that leads to the question…what could derail this bull market?

That will be at the center of today’s discussion.

Market Commentary

One of my favorite investment sayings is:

“It’s a bull market til proven otherwise”

Meaning that the natural gravity of the stock market is to move higher. That helps explain why the average bull market lasts 63 months while the average bear market only 13 months. That is a 5 to 1 advantage in favor of being in a bull market.

Or to put it another way…it is harder to create a bear market than most people realize. So, you really need some extraordinary events to shake stocks off their bullish axis.

When you boil it down there are really just 2 ingredients that create a bear market. Let’s explore both below.

First, and most obviously, is the idea of a recession forming. This lowers the earnings outlook plus reduces risk taking leading to lower PE for each stock. This combination culminates in an average bear market drop of 34% for the S&P 500.

The second reason stems from an equity price bubble that bursts (often with a recession to follow from all that loss of household net worth). The two obvious examples are 1929 and the tech bubble of 2000.

Yes, some might point to the Great Recession of 2008. But that was from an equity bubble in real estate that led to banking failures. That is an interesting situation for sure…but different than stocks being overpriced leading to their eventual fall.

On the recession front the economy continues to clip along at a healthy pace with the GDP Now estimate for Q1 ticking up to +2.5% growth. That is very close to the long term average of +2.7% and certainly does not hint at a recession forming.

Granted, there is always the concern that the Fed overstays their welcome with high rates that begets a future recession. This fear comes from 12 of the last 15 rate hiking cycles ending in recession. However, it does seem like Powell and company are good students of history and are on their way to managing a soft landing that allows them to cut rates before a recession unfolds.

I recently saw that the current PE of the market (20.7) is in the top 5% of all time. That does make one stop in their tracks and consider if we are overvalued.

The counter argument to that is that investors now better understand the risk and reward of the stock market versus bonds and cash. This has led to higher PE’s for stocks over the last 20-30 years making the long term historical standards a bit outdated.

As a counter argument I want to share this PEG Ratio chart going back 30 years:

The PEG ratio is my favorite valuation metric as it says what you are willing to pay for each unit of earnings growth. Meaning that a tech stock growing earnings 20% a year SHOULD have a higher PE than a sleepy utility company with meager 3% earnings growth.

As you can see that the current PEG level for the market is kind of middle of the pack for the past three decades and not a cause for alarm on the valuation front.

Yet there most certainly are groups that are being a bit too richly valued like the Magnificent 7 stocks and some of the “in fashion” AI companies. Interestingly Tesla has already finally fallen from their too lofty heights with shares 40% off their highs. I would like to see some of that profit taking roll to these other names with that money flowing to other worthy companies with more appealing valuations.

Taking it back to the top, it’s a bull market til proven otherwise. And since we just reviewed what could possibly derail the market (recession and valuation) we are on pretty safe footing on that front as well.

Thus, continue to be fully invested in stocks. Just have a greater eye towards value at this time given that there are indeed some overripe stocks due for a fall.

Are you interested in my favorite stocks at this time?

Read on below to discover them now…

What To Do Next?

Discover my current portfolio of 12 stocks packed to the brim with the outperforming benefits found in our exclusive POWR Ratings model. (Nearly 4X better than the S&P 500 going back to 1999)

This includes 5 under the radar small caps recently added with tremendous upside potential.

Plus I have 1 special ETF that is incredibly well positioned to outpace the market in the weeks and months ahead.

This is all based on my 43 years of investing experience seeing bull markets…bear markets…and everything between.

If you are curious to learn more, and want to see these lucky 13 hand selected trades, then please click the link below to get started now.

Steve Reitmeister’s Trading Plan & Top Picks >

Wishing you a world of investment success!


Steve Reitmeister…but everyone calls me Reity (pronounced “Righty”)
CEO, StockNews.com and Editor, Reitmeister Total Return


SPY shares were trading at $514.66 per share on Friday morning, down $0.15 (-0.03%). Year-to-date, SPY has gained 8.28%, versus a % rise in the benchmark S&P 500 index during the same period.


About the Author: Steve Reitmeister

Steve is better known to the StockNews audience as “Reity”. Not only is he the CEO of the firm, but he also shares his 40 years of investment experience in the Reitmeister Total Return portfolio. Learn more about Reity’s background, along with links to his most recent articles and stock picks.

More…

The post What Would Cause a Bear Market Now? appeared first on StockNews.com

https://www.entrepreneur.com/finance/what-would-cause-a-bear-market-now/470915


Stock Investors: Why Are You So Bullish???

It’s easy to ignore bad news when the S&P 500 (SPY) is making new highs and our net worth is on the rise. Unfortunately it is often at these heights that the first signs of trouble appear…but are hard to see at first. That is why you need to read the latest insights from veteran investor, Steve Reitmeister, as he points to a disconnect between the fundamentals and current stock price action. Read on below for more.

The better than expected PCE inflation report on Thursday led to another rally pushing the S&P 500 (SPY) back towards the highs at 5,100. This represents a hearty 5% return in February. Even better, market breadth improved with smaller stocks coming along for the ride in the final days of the month.

I hate to be the bearer of bad news…but unfortunately the fundamentals are not totally supporting this rampant bullishness. Especially because I don’t believe things get that much better even after the Fed does finally start lowering rates.

Why is that?

And what does that mean for stocks in the weeks ahead?

Get the answers below with my updated outlook and trading plan.

Market Commentary

In my commentary earlier this week I shared the following insight:

We need to start the conversation with this provocative chart from FactSet comparing the movement of the forward S&P 500 EPS estimates versus the stock index:

You will discover that for most of the past 10 years the dark line for earnings is above the price action. Meaning the improvement in the earnings outlook propelled stocks higher. Yet each time we find the stock index climbing above the EPS outlook it comes back down to size like it did in 2022.

If the lessons of history hold true, then it points to 2 possible outcomes.

First, would be a correction for stock prices to be more in line with the true state of the earnings outlook. Something in the range of 10% should do the trick with some of the more inflated stocks enduring a stiffer 20%+ penalty.

On the other hand, stocks could level out for a while patiently waiting for rates to be lowered. This act is a well known catalyst for greater economic growth that should finally push earnings higher getting things back in equilibrium with the index price.

Yes, there is a 3rd case where stocks just keep rallying because investors are not wholly rationale. Unfortunately, those periods of irrational exuberance led to much more painful corrections further down the road. So, let’s hope that will not be the case here.

(End of previous commentary)

However, here is what I left out of that conversation that needs to be added now. Even when the Fed finally starts lowering rates, it may not be as great of a catalyst for earnings growth and share price appreciation as investors currently believe.

Just consider what is happening now. GDP is humming along around normal levels and yet earnings growth is sub-par to non-existent year over year….why is that?

Because difficult times, like a recession, leads to more stringent cost cutting on the part of company management. This lower cost base = improved profit margins and higher growth when the economy expands once again. And yes, that is the prime catalyst for stock price advances.

But note…we didn’t have a recession. And unemployment remains strong. And thus, there was never the major cost cutting phase which ushers in the next cycle of impressive earnings growth which propels stock prices higher.

Or to put it another way, even when the Fed lowers rates…it may have a very modest impact on improved earnings growth because of what I just noted above. And this equates to less reason for stocks to ascend further.

No…this does not equate to the forming of another bear market. As noted earlier, perhaps a correction is in the offing. Or more likely that the overall market stays around current levels with a rotation out of growth stocks towards value stocks.

This is where we get to press our advantage with the POWR Ratings.

Yes, it reviews 118 factors in all for each stock finding those with the most upside potential. 31 of those factors are in the Value camp (the rest being spread across Growth, Momentum, Quality, Safety and Sentiment).

This value bias helps the POWR Ratings out every year leading to it’s average annual return of +28.56% a year going back to 1999. This year we might be able to press our advantage even more as growth prospects dim and the search for value takes center stage.

Read on in the next section for my favorite POWR Ratings value stocks to add to your portfolio at this time…

What To Do Next?

Discover my current portfolio of 12 stocks packed to the brim with the outperforming benefits found in our exclusive POWR Ratings model. (Nearly 4X better than the S&P 500 going back to 1999)

This includes 5 under the radar small caps recently added with tremendous upside potential.

Plus I have 1 special ETF that is incredibly well positioned to outpace the market in the weeks and months ahead.

This is all based on my 43 years of investing experience seeing bull markets…bear markets…and everything between.

If you are curious to learn more, and want to see these lucky 13 hand selected trades, then please click the link below to get started now.

Steve Reitmeister’s Trading Plan & Top Picks >

Wishing you a world of investment success!


Steve Reitmeister…but everyone calls me Reity (pronounced “Righty”)
CEO, StockNews.com and Editor, Reitmeister Total Return


SPY shares were trading at $512.85 per share on Friday afternoon, up $4.77 (+0.94%). Year-to-date, SPY has gained 7.90%, versus a % rise in the benchmark S&P 500 index during the same period.


About the Author: Steve Reitmeister

Steve is better known to the StockNews audience as “Reity”. Not only is he the CEO of the firm, but he also shares his 40 years of investment experience in the Reitmeister Total Return portfolio. Learn more about Reity’s background, along with links to his most recent articles and stock picks.

More…

The post Stock Investors: Why Are You So Bullish??? appeared first on StockNews.com

https://www.entrepreneur.com/finance/stock-investors-why-are-you-so-bullish/470554


Is a Stock Bubble Forming?

We all have Nvidia (NVDA) to thank for the S&P 500 (SPY) finally breaking above 5,000. Truly one of the most impressive earnings announcements in years. Yet the valuation for NVDA, and the rest of the mega cap tech space is getting lofty calling into question whether a bubble is forming. Learn what investing expert Steve Reitmeister thinks about the current state of the market along with his a preview of this top 12 stocks to buy now. Read on below for more.

Artificial Intelligence is all the rage. And nobody is doing better than Nvidia (NVDA). This was on FULL display in their tremendous Wednesday after market earnings beat that lit a fire under stocks on Thursday…especially any tech stocks tied to AI.

This led to an impressive breakout above 5,000 for the S&P 500 (SPY) to close the session at 5,087. But should investors be worried that not all stocks are participating in this rally. Like how the small caps in the Russell 2000 are still in the red this year???

We will discuss that and more in today’s market commentary.

Market Commentary

February has been marked by an ongoing test of the 5,000 level for the S&P 500.

Twice before stocks closed above 5,000 for a short stretch only to fall back below. But there is a sense that this 3rd time is the charm with a further breakout likely on the way.

Yet just like 2023 the gains seem far too isolated in the mega cap tech stocks as can be seen by this year to date chart focused on gains my market cap:

With history as our guide, a healthy bull market has small caps leading the way. That is because these smaller companies typically have superior growth prospects which propels their shares above the pack.

That is why the returns for small caps going back 100 years are typically 20% better than large caps. For clarity this means that if large caps average a 10% return that small caps would be around 20% better at 12% return (not a 30% return).

One theory is to say “the trend is your friend“. And thus investors are best served playing the large cap tech game until the party is over.

Going back to the late 1990’s that was a great idea as long as you sold in early 2000 at the first signs the bubble was bursting. Unfortunately, investors rarely make those prudent moves. Instead, they tell themselves seemingly sound logic like selling when shares get back to previous levels. This flawed thinking leads to disastrous outcomes at the end of bubble as shares can so easily fall 50-80% in fairly short order.

To be clear, I am not saying Mega Caps or AI stocks are as much of a mania as we saw in 1999 for internet stocks. Nvidia and others are profitable companies growing at a phenomenal pace. But their PE nearing 40X earnings is a premium that history points to having very low odds of future success.

Meaning these shares are priced for perfection. Likely they will stay aloft as long as that perfection continues to unfold with each subsequent earnings report. But once there is the first blemish in that earnings outlook, then “watch out below!”.

Note that back in my days at Zacks Investment Research we ran a series of studies looking at the PE and projected growth rates of companies. Most would assume that the higher the expected growth…the higher the returns. And yet it was the exact opposite with the highest growth companies offering the lowest future returns.

That is precisely because of the higher PE and priced for perfection problem noted above. Growth never holds up over time. Whether its industry conditions or stiff competition, at some point the growth party ends. And when it does the stocks implode and PE comes down to size.

My assumption is that most everyone has an allocation to these Magnificent 7 stocks to benefit as long as this AI party lasts. That ownership is either directly in the individual companies or through ownership in SPY or QQQ which is dominated by these shares.

The question is what are you going to do with the rest of your money because it is unwise to have too many eggs in this becoming more fragile basket?

For me it is to lean into my best investing advantage. That being a focus on the proven outperformance from stocks uncovered by our POWR Ratings system.

Analyzing every stock by 118 factors that point to future outperformance is why the coveted A rated stocks have generated an average return of +28.56% per year since 1999. And that outperformance is showing up in spades once again this year.

What top POWR Ratings stocks am I recommending today?

Read on below for the answer…

What To Do Next?

Discover my current portfolio of 12 stocks packed to the brim with the outperforming benefits found in our exclusive POWR Ratings model. (Nearly 4X better than the S&P 500 going back to 1999)

This includes 5 under the radar small caps recently added with tremendous upside potential.

Plus I have 1 special ETF that is incredibly well positioned to outpace the market in the weeks and months ahead.

This is all based on my 43 years of investing experience seeing bull markets…bear markets…and everything between.

If you are curious to learn more, and want to see these lucky 13 hand selected trades, then please click the link below to get started now.

Steve Reitmeister’s Trading Plan & Top Picks >

Wishing you a world of investment success!


Steve Reitmeister…but everyone calls me Reity (pronounced “Righty”)
CEO, StockNews.com and Editor, Reitmeister Total Return


SPY shares were trading at $507.66 per share on Friday morning, up $0.16 (+0.03%). Year-to-date, SPY has gained 6.81%, versus a % rise in the benchmark S&P 500 index during the same period.


About the Author: Steve Reitmeister

Steve is better known to the StockNews audience as “Reity”. Not only is he the CEO of the firm, but he also shares his 40 years of investment experience in the Reitmeister Total Return portfolio. Learn more about Reity’s background, along with links to his most recent articles and stock picks.

More…

The post Is a Stock Bubble Forming? appeared first on StockNews.com

https://www.entrepreneur.com/finance/is-a-stock-bubble-forming/470226


Are Small Cap Stocks Ready to Lead?

The S&P 500 (SPY) continues to dance around 5,000. However, many market commentators are wondering when these large caps are going to hand over the reins to small caps after a 4 year advantage. Lets remember that going back 100 years there is a clear and decided advantage in smaller stocks. Discover what Steve Reitmeister predicts in the coming year including a preview of this top 12 stocks to buy now. Read on below for more.

Should stocks break above 5,000 for S&P 500 (SPY) now?

No…that is not very logical as the start date for Fed rate cuts keeps getting pushed further and further into the future. However, it is an important lesson to appreciate that when you are in a bull market, it is best to just stay invested as you never know when the next bull run will take place.

Meaning that more and more the evidence confirms that market timing is a “fools’ errand“. So, the wise thing to is simply stay bullish during bull markets.

That doesn’t mean that every stock will go up. So, let’s spend our time today discussing the stocks that have the best chance to outperform in 2024.

Market Commentary

This was an interesting week for the market. After 2 straight sessions breaking above 5,000, stocks were sent reeling on Tuesday’s much hotter than expected CPI report which pushed out the likely start date for rate cuts.

The -1.37% decline for the S&P 500 was pretty rough. But even more brutal was the -3.96% slashing of small caps.

This “seemed” to set the stage for a consolidation period under 5,000 and perhaps a stiffer 3-5% pullback as investors await a clearer signal to move ahead. Yet on Wednesday investors obviously got a case of amnesia as stocks closed the session at 5,000.62. And then Thursday pressed further higher to 5,029.73.

If you want a narrative to explain this, then it could be twisted that the much weaker than expected Retail Sales report on Thursday should help with the inflation problem. However, that doesn’t hold much water when GDPNow estimates still call for +2.9% growth in Q1.

That is a touch too hot for Fed’s liking. Meaning these are above trend growth levels for the US economy that bring it with it more inflationary pressures.

No doubt the Fed would prefer a true “soft landing” reading closer to 1% GDP growth that would come with greater moderations of inflationary pressures.

This brings us back to the “animal spirits” part of investing:

Bull markets will be bullish…and bear markets will be bearish.

No one is arguing that we are not in a bull market right now. So, no matter how logical it might seem for the recent stock advance to simmer down until the timing of Fed rate cuts is clearer…it is also unwise to bet against that primary bullish trend.

To sum it up…stay bullish until there are concerns of recession that would increase the odds of a recession forming.

With that being said, I will stick to my earlier prognostications for 2024 that there is not a tremendous amount of upside for the S&P 500 after the tremendous gains the past 17 months from the October 2022 lows. Instead, the large caps, and in particular the Magnificent 7 mega caps, that dominate the index are fully valued to overvalued by most objective standards.

I suspect that 5,250 (about 10% above the 2023 close) is a generous upside for the market this year. Instead, I foresee the 4 year advantage for large caps over their smaller peers is going to end.

This tide started to turn during the late 2023 rally. Yet as the calendar flipped to 2024 investors got back to their old habits.

That being a concentration in the Magnificent 7 stocks that has mega caps pulling way ahead of the pack. This is on clear display in the chart below:

The good news is that this past week small caps are taking the baton to lead the stock investing race. And yes, Mega caps pressed pause at the same time.

My gut continues to believe strongly that this recent trend has legs. That investors will have to look farther and wider to find stocks worthy of more upside.

This will lead them to small and mid caps that have impressive growth prospects. The key being much more reasonable valuations than their large cap peers. The combination of superior growth + attractive valuation = greater upside potential.

This investing playbook is at the very heart of the way I am managing my portfolios this year. And gladly leans into the strength of our POWR Ratings system.

This quantitative system analyzes 5,300 stocks by the same 118 factors. Meaning it can analyze the fundamental and price action merits of Apple and NVIDIA by the same yardstick it can measure a $500 million market cap “under the radar” selection.

Indeed, it is that daily analysis of 118 different factors for every stock that unearths those with stellar growth and value characteristics that points to future outperformance. And thus, why this POWR Ratings performance chart dating back to 1999 speaks for itself:

Which top rated POWR Ratings stocks am I selecting at this time?

Read on below for the answers…

What To Do Next?

Discover my current portfolio of 12 stocks packed to the brim with the outperforming benefits found in our exclusive POWR Ratings model. (Nearly 4X better than the S&P 500 going back to 1999)

This includes 5 under the radar small caps recently added with tremendous upside potential.

Plus I have 1 special ETF that is incredibly well positioned to outpace the market in the weeks and months ahead.

This is all based on my 43 years of investing experience seeing bull markets…bear markets…and everything between.

If you are curious to learn more, and want to see these lucky 13 hand selected trades, then please click the link below to get started now.

Steve Reitmeister’s Trading Plan & Top Picks >

Wishing you a world of investment success!


Steve Reitmeister…but everyone calls me Reity (pronounced “Righty”)
CEO, StockNews.com and Editor, Reitmeister Total Return


SPY shares were trading at $500.82 per share on Friday morning, down $1.19 (-0.24%). Year-to-date, SPY has gained 5.37%, versus a % rise in the benchmark S&P 500 index during the same period.


About the Author: Steve Reitmeister

Steve is better known to the StockNews audience as “Reity”. Not only is he the CEO of the firm, but he also shares his 40 years of investment experience in the Reitmeister Total Return portfolio. Learn more about Reity’s background, along with links to his most recent articles and stock picks.

More…

The post Are Small Cap Stocks Ready to Lead? appeared first on StockNews.com

https://www.entrepreneur.com/finance/are-small-cap-stocks-ready-to-lead/469887


This Week’s Key Luxury Stock Gainers

The luxury goods industry appears well-positioned to benefit from changing consumer trends, rising disposable incomes, integration of advanced technologies, growing popularity of e-commerce platforms, ease of payments, etc. Amid this backdrop, investors could consider buying fundamentally strong luxury stocks The Buckle (BKE), Abercrombie & Fitch (ANF), and Vera Bradley (VRA). Keep reading….

Aided by increasing disposable incomes, the expanding accessibility of fashion products, the growing popularity of online shopping, the adoption of advanced technologies, and the rise of fashion trends on social media platforms, the luxury goods industry’s long-term prospects look promising.

Therefore, investors could consider buying fundamentally strong luxury stocks The Buckle, Inc. (BKE), Abercrombie & Fitch Co. (ANF), and Vera Bradley, Inc. (VRA).

Before diving deeper into the fundamentals of these stocks, let’s understand what’s shaping the industry’s prospects.

The luxury industry is often considered recession-proof due to its stable demand trends and wealthy clientele. The sector is usually not considered a proxy for general economic health. The growing number of high-net-worth individuals around the world, increasing consumer spending, and rising disposable incomes in developing nations are contributing to the industry’s rapid growth.

Despite a slowdown in demand toward the end of 2023, the luxury goods industry’s demand looks well-poised for recovery as China, the world’s second-largest economy, takes measures to revive its economy. As per Bain, luxury purchases in China are expected to reach 24% to 26% of total luxury purchases worldwide by 2030. U.S. growth is also likely to pick up after a relatively weaker 2023.

Luxury brands have seen their sales grow thanks to an e-commerce boom and real-time social media trends, as a large number of millennials and Gen-Z spend their discretionary incomes on luxury handbags, shoes, and jewelry. According to McKinsey’s analysis of fashion forecasts, the global industry will post top-line growth of 2% to 4% in 2024.

The industry is also leveraging advanced technologies like artificial intelligence, machine learning, augmented reality and virtual reality (AR & VR), etc., to create immersive shopping experiences and offer greater personalization, trend predictions, and product recommendations. The global luxury goods market is projected to reach $392.40 billion by 2030, growing at a CAGR of 4.7%.

In light of these encouraging trends, let’s look at the fundamentals of the three best Fashion & Luxury stocks, beginning with number 3.

Stock #3: The Buckle, Inc. (BKE)

BKE operates as a retailer of casual apparel, footwear, and accessories for young men and women in the United States. It markets a selection of brand-name casual apparel, including denim, other casual bottoms, tops, sportswear, outerwear, accessories, and footwear, as well as private label merchandise primarily comprising BKE, Buckle Black, Salvage, Red by BKE, Daytrip, Gimmicks, Gilded Intent, Reclaim, Departwest, Veece, etc.

In terms of the trailing-12-month net income margin, BKE’s 17.82% is 279.4% higher than the 4.70% industry average. Likewise, its 23.79% trailing-12-month EBITDA margin is 117.9% higher than the industry average of 10.91%. Furthermore, the stock’s 1.42x trailing-12-month asset turnover ratio is 43.8% higher than the industry average of 0.99x.

For the fiscal third quarter, which ended October 28, 2023, BKE’s sales came in at $303.46 million. Its gross profit amounted to $147.22 million. The company’s income from operations stood at $64.07 million. In addition, its net income came in at $51.76 million. Its EPS came in at $1.04. Also, its total current assets rose 0.6% year-over-year to $508.94 million.

Over the past nine months, the stock has gained 21.9% to close the last trading session at $38.41.

BKE’s POWR Ratings reflect this positive outlook. It has an overall rating of B, which translates to a Buy in our proprietary rating system. The POWR Ratings assess stocks by 118 different factors, each with its own weighting.

It is ranked #18 out of 62 stocks in the B-rated Fashion & Luxury industry. It has an A grade for Quality. Click here to see the additional ratings of BKE for Growth, Value, Momentum, Stability, and Sentiment.

Stock #2: Abercrombie & Fitch Co. (ANF)

ANF operates as a specialty retailer in the United States, Europe, the Middle East, Asia, the Asia-Pacific, Canada, and internationally. The company operates through two segments: Hollister and Abercrombie. It offers an assortment of apparel, personal care products, and accessories for men, women, and kids under the Hollister, Gilly Hicks, Social Tourist, Abercrombie & Fitch, and Abercrombie Kids brands.

In terms of the trailing-12-month levered FCF margin, ANF’s 12.04% is 112.8% higher than the 5.66% industry average. Likewise, its 8.90% trailing-12-month EBIT margin is 18.4% higher than the industry average of 7.51%. Furthermore, the stock’s 4.29% trailing-12-month Capex/Sales is 40.2% higher than the industry average of 3.06%.

ANF’s net sales for the third quarter ended October 28, 2023, increased 20% year-over-year $1.06 billion. Its adjusted operating income rose 548.4% over the prior-year quarter to $138.02 million. The company’s net income attributable to ANF came in at $96.21 million, compared to a net loss of $2.21 million in the prior-year quarter. Also, its non-GAAP EPS came in at $1.83, representing a considerable increase year-over-year.

Analysts expect ANF’s EPS and revenue for the quarter ended January 31, 2024, to increase 245.1% and 19% year-over-year to $2.80 and $1.43 billion, respectively. It surpassed the consensus EPS estimates in three of the trailing four quarters. Over the past nine months, the stock has gained 397.7% to close the last trading session at $119.25.

ANF’s strong fundamentals are reflected in its POWR Ratings. It has an overall rating of B, translating to a Buy in our proprietary rating system.

Within the same industry, it is ranked #17. It has an A grade for Growth and Quality. To see the other ratings of ANF for Value, Momentum, Stability, and Sentiment, click here.

Stock #1: Vera Bradley, Inc. (VRA)

VRA designs, manufactures, and sells women’s handbags, luggage and travel items, fashion and home accessories, and gifts. It operates through three segments: Vera Bradley Direct, Vera Bradley Indirect, and Pura Vida. The company offers bag products, accessories, bracelets, rings, and necklaces under the Pura Vida brand name and travel products. It also provides home products, apparel/footwear, and stationery and merchandising products.

In terms of the trailing-12-month gross profit margin, VRA’s 50.93% is 43% higher than the 35.61% industry average. Likewise, its 14.45% trailing-12-month levered FCF margin is 155.4% higher than the industry average of 5.66%. Furthermore, the stock’s 1.15x trailing-12-month asset turnover ratio is 16.4% higher than the industry average of 0.99x.

For the fiscal third quarter, which ended October 28, 2023, VRA’s net revenues came in at $114.99 million. Its non-GAAP net income attributable to VRA came in at $6.10 million. The company’s non-GAAP operating income stood at $8 million. Also, its non-GAAP EPS available to VRA common shareholders came in at $0.19.

For fiscal 2024, VRA’s EPS is expected to increase 139.6% year-over-year to $0.58. Its revenue for fiscal 2025 is expected to increase 3.5% year-over-year to $490.32 million. It surpassed the Street EPS estimates in each of the trailing four quarters. Over the past nine months, the stock has gained 43.5% to close the last trading session at $7.69.

VRA’s POWR Ratings reflect solid prospects. It has an overall rating of B, translating to a Buy in our proprietary rating system.

It is ranked #4 in the Fashion & Luxury industry. It has an A grade for Sentiment and a B for Growth, Value, and Quality. Click here to see the other ratings of VRA for Momentum and Stability.

What To Do Next?

Discover 10 widely held stocks that our proprietary model shows have tremendous downside potential. Please make sure none of these “death trap” stocks are lurking in your portfolio:

10 Stocks to SELL NOW! >


ANF shares rose $0.25 (+0.21%) in premarket trading Thursday. Year-to-date, ANF has gained 35.46%, versus a 5.13% rise in the benchmark S&P 500 index during the same period.


About the Author: Dipanjan Banchur

Since he was in grade school, Dipanjan was interested in the stock market. This led to him obtaining a master’s degree in Finance and Accounting. Currently, as an investment analyst and financial journalist, Dipanjan has a strong interest in reading and analyzing emerging trends in financial markets.

More…

The post This Week’s Key Luxury Stock Gainers appeared first on StockNews.com

https://www.entrepreneur.com/finance/this-weeks-key-luxury-stock-gainers/469795