Fend off a Lagging Economy with This Stock Screening App
Opinions expressed by Entrepreneur contributors are their own.
After a volatile year in the stock market and concerns about a looming recession, it’s a good time to think about your investment strategy for next year. Obviously, you want it to be better.
StackCommerce
Rather than completely overhaul your financial outlook and change your fundamental principles, it’s better to augment and assist your investing strategy with a tool like Tykr Stock Screener. Until January 9, we’re offering a lifetime Pro subscription for the lowest price ever: just $94.99.
[embedded content]
Tykr has earned 4.9/5-star ratings from Trustpilot and AppSumo because it makes investing fun again. The app’s rigorous algorithm works across 30,000 US and International stocks, analyzing data to identify the best stocks to add to your portfolio and help you maximize your gains in the market.
The stock screening platform is a one-stop-shop for everything you need to know, giving you a summary of every stock on the platform marking it as On Sale (potential buy), Watch, or Overpriced (potential sell). All of the work the algorithm does is open source so you can see the calculations it’s using to come to its conclusions and decide whether or not you want to follow the app’s lead. Every stock also has a score, giving you some more peace of mind when you make bigger investments.
In addition to stock screening, Tykr is also an education app, giving you all kinds of resources to increase your returns in the market. You’ll learn how to reduce risk, maximize your Margin of Safety, and lock in big gains in 2023.
Give your portfolio a big boost this coming year. Now through January 9 at 11:59 p.m. Pacific, you can get a lifetime Pro subscription to Tykr Stock Screener for 89% off $900 at just $94.99.
Prices subject to change.
https://www.entrepreneur.com/article/441887
2023 Stock Market: Best vs. Worst Case Scenario
The door is now shut on 2022 and the S&P 500 (SPY) faltered again to put an exclamation point on the bearish year. That is the past. Now let’s discuss the future including the best and worst case scenario for stocks in 2023. 40 year investment veteran Steve Reitmeister weighs in on this timely topic in his new commentary including a trading plan to stay one step ahead of the market. (Maybe even buy TSLA & ROKU on the dip). Read on below for the full story.
shutterstock.com – StockNews
Today marks the last session of 2022. And not surprisingly the bears wanted to stake their claim on the session…and on the year by mauling stocks once more.
Right now, the base case for the start of 2023 is continuation of that downward trend. However, that is far from set in stone.
Thus, I thought it would be good to use today’s commentary to review things that could alter the path of the markets for better or worse…and our associated trading plan.
Once again, the best place to understand the base case for next year is in my recent presentation: 2023 Stock Market Outlook.
In a nut shell I expect a fairly run of the mill recession forming in the first half of 2023 with stock prices falling to a range of 3,000 to 3,200. Note the average bear market has a 34% decline which would equate to 3,180 for the S&P 500 (SPY).
The reason we might fall further than average is that the previous bull market had overall stock valuations (PE) as high as the 1999 tech bubble. So, some of that excess may need to be drained out before the next bull market can begin.
Gladly, I also see a new bull market emerging with stocks rising from these lows into year end. That is why my 2023 outlook presentation also concentrates on how to time your way back in at the bottom to enjoy the glorious gains that will unfold as the bull stampedes out of the gate.
My prediction is kind of middle of the pack with some market prognosticators seeing it milder and some much nastier. And that is what makes investing so complex. It’s hard coming agreement on what the future holds. That clarity is only available in hindsight.
Now let’s review what would make this a milder bear market. Or what we could call the Best Case Scenario.
The answer is fairly simply. That being where the Fed amazingly engineers a soft landing with no recession unfolding. This would likely mean that we have already seen bear market bottom in October at 3,491 and stocks would get back on a long term bullish march to new highs in the years ahead.
There will not be some magical moment that every investor gets the message at the same time. As they say “no one rings a bell at the bottom“.
Instead, more and more investors will assess the odds that this is a soft landing leading them to shift their investments more bullish. Whereas other investors will come to that realization later likely with a heavy dose of FOMO.
The better we understand these clues now…the earlier we would join the bull rally to enjoy more upside. Let’s review:
The sooner inflation cools down, with special focus on wage inflation, which has been the stickiest area that is concerning the Fed. This means a lot of attention will be paid to the 3 key monthly inflation reports: CPI, PPI and PCE.
Employment remains robust and never see unemployment rate get above 4%. This job security makes people feel more confident in spending versus savings keeping the economy humming along.
Key economic reports bouncing back from recent weakness. Most vital being ISM Manufacturing and Services getting back above 50 for good. But also many eyes will be on Retails Sales for health of the consumer.
Clear pivot in Fed statements to consider ending rate hikes…and maybe get back to lowering rates in the future. Bulls have jumped the gun on this front many times in 2022 only to get a painful wake up call from Chairman Powell. So, this is not about guessing whether the Fed is shifting. Instead, it is hearing an unmistakable change from their current hawkish posture.
As these things happen, you will first want to start taking profits on bearish bets. From there you start shifting to bullish investments.
In short, the “Risk On” growth oriented trades that did the worst in 2022 will become the serious outperformers in the early innings of the new bull market. Technology for sure. Also consider positions that are economically sensitive; Industrials, Materials, Transportation, Consumer Discretionary etc.
Now let’s check out the flipside…
Worst Case Scenario for 2023 Stock Market
The short and sweet version is to say it would be the opposite of what we would find in the best case scenario.
Inflation too hot…Fed too hawkish…Job market too weak…Recession too deep…Stock prices decline 40%+
This outcome fits under the heading that starting a recession is like opening up “Pandora’s Box“. Once those demons are unleashed it is unclear how much damage they can create. This is especially true if employment craters spurring a very negative chain reaction:
Job Loss > Lower Income > Lower Spending > Lower Corporate Profits > Lower Stock Prices
And unfortunately, the #1 solution for companies suffering weakened profits is to subsequently lower expenses…like more layoffs. And this is when the vicious cycle goes into a rinse and repeat cycle cutting the economy and stock prices lower and lower.
The investment game plan here is to hold on to bearish bets longer with S&P 500 (SPY) bottom likely in a lower range of 2,800 to 3,000. Note that 2,800 marks a 42% decline from the all time highs. Hard to imagine heading much lower than that.
And then just as things are getting their ugliest…that is likely when the new bull market emerges. This fits in nicely with the famed Warren Buffett quote “to be greedy when others are fearful”.
That is when you flick the switch to the more Risk On growth oriented investments. Gladly their prices will be so depressed that even a value investor could get on board the Tesla’s (TSLA) and Roku’s (ROKU) of the world with a straight face.
Conclusion
Any of these outcomes is possible. However, I still think best to first plan for the middle case scenario as outlined in my 2023 Stock Market Outlook.
Next, we stay vigilant watching for the aforementioned signs that would point to things being better or worse than expected. Then make appropriate changes to your investment strategy.
I appreciate that this all sounds easier said than done. But this not my first time to the bear market rodeo. In fact, I have weathered 4 previous bear markets in good stead. Each time learning valuable lessons that help with each next edition.
So please keep dialed into my commentaries going forward to stay on the right side of the action and we will make it safely to the bullish shores that lay ahead.
What To Do Next?
Watch my brand new presentation: “2023 Stock Market Outlook” covering:
Why 2023 is a “Jekyll & Hyde” year for stocks
5 Warnings Signs the Bear Returns in Early 2023
8 Trades to Profit on the Way Down
Plan to Bottom Fish @ Market Bottom
2 Trades with 100%+ Upside Potential as New Bull Emerges
Steve Reitmeister…but everyone calls me Reity (pronounced “Righty”) CEO, Stock News Network and Editor, Reitmeister Total Return
SPY shares were trading at $382.06 per share on Friday afternoon, down $1.38 (-0.36%). Year-to-date, SPY has declined -18.25%, versus a % rise in the benchmark S&P 500 index during the same period.
About the Author: Steve Reitmeister
Steve is better known to the StockNews audience as “Reity”. Not only is he the CEO of the firm, but he also shares his 40 years of investment experience in the Reitmeister Total Return portfolio. Learn more about Reity’s background, along with links to his most recent articles and stock picks.
Want to discover a stock picking strategy that topped the S&P 500 (SPY) by a wide margin in 2022? Then read on to appreciate this revolutionary that should benefit you greatly in 2023 and beyond. Read on for the full story below.
shutterstock.com – StockNews
The bear market of 2022 was a serious wakeup call for investors.
The harsh reality is that many of the methods that seemed to work so well in previous years…were a downright death sentence as the bear market came out of hibernation.
First and foremost was the idea of buying “in fashion” growth stocks like Roku and Tesla regardless of nose-bleed valuations. That party came to a very ugly end this past year.
So, if those things don’t work…then what does?
That will be the focus of this commentary where I discuss a 3 step evolution in how to select stocks that has led many on a path to superior performance. Hopefully it illumines a strategy that improves your odds of investment success in the new year.
Stock Picking Method 1.0
In order to tell you the solution, I first need to point out the problem. And that is the flawed way that most of us research stocks. For that purpose, I will give you an outline on how the average person handles this vital task…then I will point out a better path.
Let’s say you read an article where some expert is touting 3 stocks they think are terrific. From there we will likely surf your favorite investment websites for additional information which is some combination of the following:
What does the company do? (Industry/Sector)
Review recent price action
Explore a few key metrics on growth, value or company financials
Read additional articles that tell us a bit more of the growth story for the company that gives us confident it is an attractive investment going forward.
So what’s the problem with this approach?
First, it’s pretty time consuming as you realize this manual method will be applied to every stock under review.
Second, and most importantly, you are really not covering that much ground. Meaning there are literally thousands of data points that you could investigate for every stock to appreciate how healthy they are…and how they stack up to the competition.
Yet if we are being honest, this antiquated method only leads to a review of 5-10 aspects of a company before we decide to place a trade. It’s simply not a complete enough review to put the odds in your favor which leads to…
Stock Picking Method 2.0
The solution is to automate this approach. Like using computer models to scan more factors of these companies in milliseconds. This is why so many investors have turned to quantitative ratings as a means to find the best stocks.
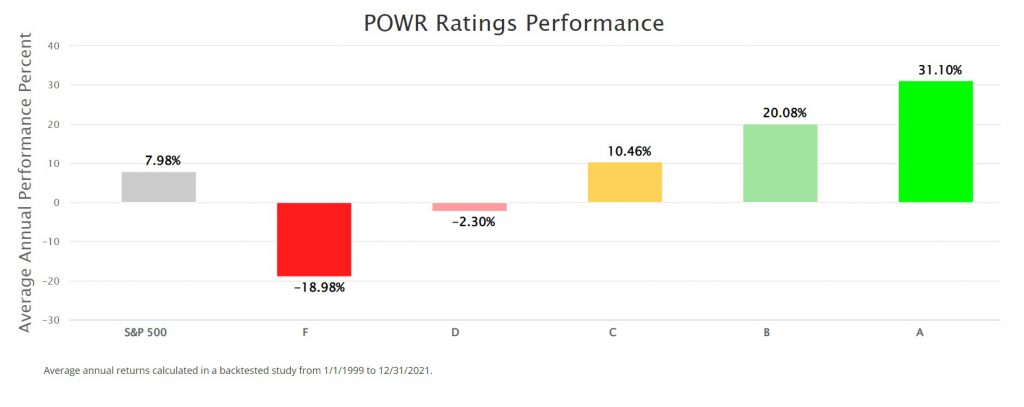
In that realm our proprietary POWR Ratings model is helping thousands of investors do exactly that. To scan each stock based upon 118 different factors in a range of areas from growth to value to sentiment to momentum to stability and fundamental strength (quality).
Why these 118 factors?
Because the Data Scientist who created the POWR Ratings proved that each of these individual 118 factors leads to stocks more likely to outperform the market. So what we are saying this model gives you 118 advantages to find stocks that should rise above the pack.
The proof of that statement is clearly verified in the following performance chart where our top rated stocks have outpaced the overall market by a wide margin:
Yes, I could end the article here. Because using our POWR Ratings will fulfill the promise of this article…to help you find stocks to outperform in the year ahead.
However, there is still one glaring problem left to solve. That’s because using the above method will still leave you with about 1,300 Buy rated stocks to review. Just too many for the average person to sort in reasonable time frame. That is why we created…
Stock Picking Method 3.0
I realized as the CEO of StockNews.com that we needed to go further for clients. To breakdown these 1,300 stocks into a more digestible form so investors can more easily enjoy outperformance.
This came together in creating an array of market beating newsletters that harness the POWR Ratings for the main styles of stock investing. See the list of newsletters below and the current # of picks in each service to appreciate what I mean:
Newsletter
# of Picks in the Portfolio
POWR Stocks Under $10
8
POWR Options
6
POWR Growth
8
Reitmeister Total Return
9
POWR Value
6
POWR Breakouts
8
Each newsletter portfolio has a very manageable # of picks. And we are just talking about 45 trades in total.
Plus 3 more trades are on the way for Tuesday morning to kickstart the new year.
All computed as winners by our proven quant model.
All hand-picked by our Editors to be the best of the best.
Here is 1 More Innovation
Historically we had customers take 30 day trials to each newsletter individually because that is the standard industry practice.
But what if you are curious in seeing all the services to appreciate which are the best ones for you in the future?
And that is why we created POWR Platinum. This is a bundle that gives you access to all of our active trading newsletters at one time.
Not just the 6 newsletters and their 45 trades noted above. POWR Platinum also includes 2 other popular services:
POWR Trends– In depth commentaries and top picks from the most exciting growth trends from EV to Space Exploration to Internet of Things to Genomics and more.
POWR Ratings Premium – As an extra bonus you also get a subscription to this service giving full access to our coveted POWR Ratings for over 5,300 stocks and 2,000 ETFs. This is the perfect complement to the active trading newsletters making POWR Platinum a complete investment resource.
There really is something here for every style of investor. Whether you want growth, value, technical analysis, market timing and more.
$1 for a 30 Day Trial of POWR Platinum
Yes, only $1 for a 30 day trial to all our market beating services. And while it’s not going to be $1 forever, you’ll be amazed by the low-cost options after the trial concludes.
I truly believe POWR Platinum with all its market beating services in total is the ultimate investor toolkit and a real game changer for individual investors.
In fact, I believe so strongly that POWR Platinum has the ability to significantly impact your investing results, and help you outperform the market the rest of the year, that I want to remove all possible barriers so you can experience it first hand and risk-free.
If you chose to continue after the 30 day trial (and we think you will), I’m offering a 100% money-back guarantee after the trial converts to a paid subscription.
Put another way, if 30 days doesn’t feel like long enough to make a decision on whether POWR Platinum is the best value investment resource out there, then take up to 90 days longer to decide, at no-risk to you.
I think the choice is clear.
Get started with your trial today and start beating the market in the new year!
SPY shares were trading at $380.35 per share on Friday morning, down $3.09 (-0.81%). Year-to-date, SPY has declined -18.62%, versus a % rise in the benchmark S&P 500 index during the same period.
About the Author: Steve Reitmeister
Steve is better known to the StockNews audience as “Reity”. Not only is he the CEO of the firm, but he also shares his 40 years of investment experience in the Reitmeister Total Return portfolio. Learn more about Reity’s background, along with links to his most recent articles and stock picks.
The S&P 500 (SPY) comes into Christmas in bear market territory under 3,855…20% below the all time highs. Why are stocks falling again? Why is the traditional Santa Claus rally not coming to the rescue? And where do stocks head next? 40 year investment veteran Steve Reitmeister spells it all out in this timely commentary. Read on below for the full story.
shutterstock.com – StockNews
This year we have endured 2 impressive bear rallies. First was the 18% rally for the S&P 500 (SPY) from mid June til August. Then after falling to new lows, we saw another 17% bounce from mid October through last week.
This was all quite confusing if you based your decisions on price action alone. However, for those focused on the fundamentals…and those reading the words coming from the lips of Fed officials, it was clear that the continuation of the bear market was never in doubt.
So even though investors were hoping for a serious Santa Claus rally to lift their spirits this week, unfortunately a lump of coal was put in everyone’s stockings.
Let’s review the current market dynamics and what it tells us coming into the new year.
Market Commentary
The most recent bear market rally ended abruptly last week Wednesday as Chairman Powell spoke after the latest Fed rate hike. He could not have been any clearer about this being a long term battle to get inflation back to the 2% long term average.
The “higher for longer” rate mantra that equates to high likelihood of future recession is not new information. Oddly it’s like the bulls tried to play poker with the Fed….calling their bluff.
However, Fed officials are not the bluffing type. In fact, they are the one’s printing the cards…dealing the cards…and will win the poker hand in the end.
To be clear, Powell did concede there are welcome signs of inflation abating in places like commodities. Unfortunately, there are several areas with sticky inflation that won’t be resolved so quickly. In that category, wage inflation is Fed enemy #1.
Sure we all like the idea of higher wages…but not if it comes back to us like a razor blade studded boomerang that slashes our checking accounts with higher prices for everything.
This greater appreciation of the Fed’s resolve to keep fighting inflation with higher rates, and for a much longer period of timely, greatly increases the odds of recession forming in early 2023. And once that Pandora’s box of recession is opened it can take on a life of its own well beyond the control of the Fed.
Meaning we could see an extended period of job cuts that begets a vicious cycle that goes like this:
Job Loss > Lower Income > Lower Spending > Lower Corporate Profits (which leads companies to cut more expenses…which leads to potentially several rinse and repeat cycles)
When you consider the above you appreciate that it is hard to bet on the economic rebound and new bull market until you see just how bad the future recession will be. The shallower the recession…or even soft landing…then the shallower the bear market.
On the other hand, the deeper the recession the much deeper we will have to go on stock prices to find bottom. And yes, for as scary as 3,000 sounds for the S&P 500 (SPY) we could easily find our way below in a worst case scenario.
Add it all up and it pays to be bearish right now. Just not much logic in joining the bull camp until, once again, we see how the economy responds to the Fed slamming on the brakes with higher rates…for a longer period of time.
Heck, their entire goal is to lower demand to lower inflation. That is a fancy way of saying that they would much rather create a recession than leaving inflation in place. This “between the lines” message was repeated several times during the last Powell press conference.
Once again, these guys don’t bluff. And they have printed the cards…and are dealing them out. So likely best to take them out their word and continue to bet on more downside for the economy and stock market coming into 2023.
What To Do Next?
Watch my brand new presentation: “2023 Stock Market Outlook” covering:
Why 2023 is a “Jekyll & Hyde” year for stocks
5 Warnings Signs the Bear Returns in Early 2023
8 Trades to Profit on the Way Down
Plan to Bottom Fish @ Market Bottom
2 Trades with 100%+ Upside Potential as New Bull Emerges
Steve Reitmeister…but everyone calls me Reity (pronounced “Righty”) CEO, Stock News Network and Editor, Reitmeister Total Return
SPY shares were trading at $382.91 per share on Friday afternoon, up $2.19 (+0.58%). Year-to-date, SPY has declined -18.07%, versus a % rise in the benchmark S&P 500 index during the same period.
About the Author: Steve Reitmeister
Steve is better known to the StockNews audience as “Reity”. Not only is he the CEO of the firm, but he also shares his 40 years of investment experience in the Reitmeister Total Return portfolio. Learn more about Reity’s background, along with links to his most recent articles and stock picks.
1 Tech Stock That Could Make You a Millionaire and 1 That Won’t
Amid consecutive rate hikes, the tech-heavy Nasdaq composite has lost more than 32% in 2022, while the industry has lost more than $7 trillion. However, experts believe a potential rebound is around the corner for the tech industry in 2023. Moreover, rapid digitalization is leading to robust demand for tech goods and services. While quality tech stock Salesforce (CRM) might generate solid returns over time and could be worth buying now, Coinbase Global (COIN) could be best avoided, given its weak growth prospects. Read on….
shutterstock.com – StockNews
The Fed recently announced a 50-basis point rate hike for December 2022 to achieve its 2%-3% inflation target range. Rate hikes are expected to continue well into 2023. Tech stocks witnessed significant losses, with the Nasdaq composite slumping 32.6% year-to-date, while the industry has lost a massive $7.40 trillion in one year.
However, the tech industry might witness a potential rebound in 2023. According to Wedbush’s analysts Dan Ives and John Katsingris, “We believe overall the tech sector will be up roughly 20 percent in 2023 from current levels with big tech, software, and semis leading the charge despite the macro and Fed wild cards abound.”
Moreover, amid rapid digitalization, demand for tech goods and services is robust. The global digital transformation market is expected to grow at a CAGR of 23% from 2022 to 2027.
Given the backdrop, fundamentally sound tech stock Salesforce, Inc. (CRM) looks poised to deliver solid returns. However, given its weak growth prospects,Coinbase Global, Inc. (COIN) might be best avoided now.
CRM is a customer relationship management technology provider. The company’s Customer 360 platform enables its customers to work together to deliver connected experiences.
On September 21, 2022, CRM partnered with Zywave at InsureTech Connect Vegas 2022. This collaboration aims to integrate the domains of insurance agency sales and client service, leading to more efficient, strategic workflows.
In terms of forward Price/Book, CRM is currently trading at 2.13x, 41.2% lower than the industry average of 3.63x.
CRM’s gross profit margin of 72.69% is 46.4% higher than the 49.64% industry average, while its Levered FCF margin of 30.62% is 308.8% higher than the industry average of 7.49%.
CRM’s total revenues increased 14.2% year-over-year to $7.83 billion for the third quarter that ended October 31, 2022. Moreover, its subscription and support revenue increased 13.4% year-over-year to $7.23 billion. Also, its gross profit increased 14.5% year-over-year to $5.75 billion.
Analysts expect CRM’s revenue to increase 16.9% year-over-year to $30.97 billion in 2023. Its EPS is expected to increase by 3.1% year-over-year to $4.93 in 2023. It surpassed EPS estimates in all four trailing quarters. CRM’s shares have gained marginally intraday to close the last trading session at $129.01.
CRM’s strong fundamentals are reflected in its POWR Ratings. The stock’s overall B rating indicates a Buy in our proprietary rating system. The POWR Ratings assess stocks by 118 different factors, each with its own weighting.
CRM has an A grade for Growth and a B grade for Sentiment. In the Software – Application industry, it is ranked #13 out of 139 stocks. Click here for the additional POWR Ratings for Value, Momentum, Stability, and Quality for CRM.
COIN provides financial infrastructure and technology for the crypto economy worldwide. The company offers the primary financial account in the crypto economy for retailers; and technology and services that enable ecosystem partners to build crypto-based applications and securely accept crypto assets as payment.
COIN’s forward Price/Book multiple of 1.48 is substantially higher than the industry average of 1.21.
COIN’s trailing-12-month ROCE of negative 22.08% is lower than the industry average of 11.55%, while its trailing-12-month ROTA of negative 1.10% is lower than the industry average of 1.16%.
COIN’s total revenue came in at $590.34 million for the third quarter that ended September 30, 2022, down 55% year-over-year. Moreover, its net loss came in at $544.64 million, compared to a net income of $405.34 million in the year-ago period. Additionally, its loss per share came in at $2.43, compared to an EPS of $1.62 in the year-ago period.
COIN’s revenue is expected to decrease 2.4% year-over-year to $830,000 for the quarter ending December 2022. Its EPS is expected to remain negative in 2022. The stock has lost 85.2% over the past year to close the last trading session at $35.17.
COIN has an overall F rating, equating to a Strong Sell in our POWR Ratings system. It has an F grade for Growth, Stability, and Sentiment and a D for Value, Momentum, and Quality.
COIN is ranked last in the Software – Application industry. Get all COIN’s ratings here.
CRM shares were trading at $129.23 per share on Tuesday afternoon, up $0.22 (+0.17%). Year-to-date, CRM has declined -49.15%, versus a -18.66% rise in the benchmark S&P 500 index during the same period.
About the Author: RashmiKumari
Rashmi is passionate about capital markets, wealth management, and financial regulatory issues, which led her to pursue a career as an investment analyst. With a master’s degree in commerce, she aspires to make complex financial matters understandable for individual investors and help them make appropriate investment decisions.
With concerns of an economic slowdown led by interest rate hikes rising, fundamentally strong and resilient stocks Comcast (CMCSA) and AT&T (T) are worth considering. Read on….
shutterstock.com – StockNews
The risk of a recession has increased significantly after Federal Reserve Chair Jerome Powell indicated last week that the Central Bank is far from done with interest rate hikes. With inflation control and balance sheet reduction being the sole focus of the Fed, optimistic growth estimates and exorbitant valuations seem like a distant memory.
Moreover, investors have begun gearing up for negative earnings surprises as the U.S. retail sales data suggests that consumers are beginning to feel the bite of high borrowing costs and inflation.
“There’s still so much concern overhanging markets about the never-ending Covid story and the worries about a hard landing due to rate hikes,” said Susannah Streeter, senior investment and markets analyst at Hargreaves Lansdown. She further added that, amid the general doom and gloom, an end-of-the-year rally might fizzle out soon, even if it materializes.
Given that the market is not expected to stabilize anytime soon, fundamentally strong stocks with resilient demand have seen rising volumes as investors seek refuge from what Jamie Dimon has described as an ‘economic hurricane.’
To that end, Comcast Corporation (CMCSA) and AT&T Inc. (T) seem worth keeping tabs on for healthy risk-adjusted returns.
CMCSA is a global media and technology company. It operates through three segments: Cable Communications; Media; Studios; Theme Parks; and Sky.
On December 12, CMCSA announced the world’s first live, multigigabit symmetrical Internet connection powered by 10G and Full Duplex DOCSIS 4.0. This technology will revolutionize the availability of ultra-fast speeds by delivering multi-gigabit symmetrical services over the already-installed connections.
This path-breaking technology is expected to give CMCSA a first-mover advantage over its peers, leading to an increase in market share.
On October 27, CMCSA declared its quarterly dividend of $0.27 a share on the company’s common stock. The dividend is payable on January 25, 2023, to shareholders of record as of the close of business on January 4, 2023.
CMCSA pays $1.08 as a dividend annually, which translates to a yield of 3.13% at the current price. This compares favorably to the 4-year average dividend yield of 2.07%. CMCSA’s dividend payouts have grown for the past five years at an 11.7% CAGR.
On September 14, CMCSA announced an expansion in its share repurchase authorization to a total of $20.0 billion, with $9 billion worth of shares repurchased to date. This demonstrates the company’s financial strength and commitment to enhancing shareholder value.
For the third quarter of the fiscal year 2022 ended September 30, CMCSA’s adjusted EBITDA increased 5.9% year-over-year to $9.48 billion, while its adjusted net income grew 4.5% year-over-year to $4.22 billion. As a result, its adjusted EPS rose 10.3% year-over-year to $0.96.
Analysts expect CMCSA’s revenue to increase 4.2% year-over-year to $121.27 billion in the current fiscal year, ending December 31, 2022, while its EPS is expected to grow 11.3% year-over-year to $3.59 for the same period. Also, the company has an impressive earnings history, surpassing the consensus EPS estimates in each of the four trailing quarters.
The stock has registered an average 10-day trading volume of 30.24 million. It gained 1.1% over the past month to close the last trading session at $34.49.
CMCSA’s overall rating of B equates to a Buy in our POWR Ratings system. The POWR Ratings assess stocks by 118 different factors, each with its own weighting.
T is a global provider of telecommunications, media, and technical services worldwide. The company operates through two segments: Communications; and Latin America. Its offerings include wireless communications, data/broadband, Internet services, video services, local exchange services, long-distance services, telecommunications equipment, managed networking, and wholesale services.
On December 15, T announced its quarterly dividend of $0.28 per share on the company’s common shares; Series A dividend of $312.50 per preferred share, or $0.3125 per depositary share; and Series C dividend of $296.875 per preferred share, or $0.296875 per depositary share. The dividends are payable on February 1, 2023, to stockholders of record of the respective shares at the close of business on January 10, 2023.
T pays $1.11 as dividends annually, which translates to a yield of 6% at the current price, comparable to the four-year average dividend yield of 6.8%.
On December 6, T’s COO Jeff McElfresh indicated that the company expects full-year capital investment in the $24 billion range to meet the growing demand for core connectivity while meeting full-year 2022 guidance for free cash flow in the $14 billion range.
For its fiscal 2022 third quarter ended September 30, 2022, T’s revenues came in at $30 billion. Excluding the impact of U.S. Video separation in July 2021, standalone operating revenues for T were up 3.1% from $29.1 billion in the year-ago quarter. Its income from continuing operations increased 26% year-over-year to $6.3 billion. As a result, the company’s adjusted EPS grew 3% year-over-year to $0.68.
The stock has surpassed the consensus EPS estimates in each of the trailing four quarters, which is impressive. It has registered an average 10-day trading volume of 44.87 million and has gained 27.5% year-to-date to close the last trading session at $18.49.
T has an overall rating of B, which equates to Buy in our POWR Ratings system. It also has a B grade for Value and Quality. T is ranked #5 of 19 stocks in the Telecom – Domestic industry.
Click here to access the additional ratings for T’s Stability, Growth, Sentiment, and Momentum.
CMCSA shares were trading at $34.00 per share on Monday afternoon, down $0.49 (-1.42%). Year-to-date, CMCSA has declined -30.66%, versus a -19.03% rise in the benchmark S&P 500 index during the same period.
About the Author: Santanu Roy
Having been fascinated by the traditional and evolving factors that affect investment decisions, Santanu decided to pursue a career as an investment analyst. Prior to his switch to investment research, he was a process associate at Cognizant. With a master’s degree in business administration and a fundamental approach to analyzing businesses, he aims to help retail investors identify the best long-term investment opportunities.
Market Nosedives as Investors Finally Get the Message
In last week’ s commentary I said “It feels like the S&P 500 (SPY) wants to be bullish, but everyone is extremely anxious… like we’re collectively holding our breath, waiting for the next shoe to drop”. Well drop it did, and hard, with the broader indexes falling considerably on Thursday as everyone finally put together the latest pieces of the market puzzle. Keep reading to find out what the picture is showing us.
shutterstock.com – StockNews
(Please enjoy this updated version of my weekly commentary originally published December 15th, 2022 in the POWR Stocks Under $10 newsletter).
Market Commentary
The S&P 500 (SPY) tumbled 2.5% on Thursday as traders realized next year is going to be painful.
Yes, the Federal Reserve’s latest reality check — more on this shortly — is partly to blame for the drop, but we had other forces at work as well.
But I’m getting ahead of myself. Let’s go back to where all this trouble started…
As I predicted in my last commentary, Fed officials voted to increase interest rates another 50 basis points. Great! A smaller hike. But then we got the latest dot plot and an updated commentary from Powell… and both reiterated that the war against inflation is far from over.
First, the dot plot.
The Fed’s “dot plot” is basically a visual tool that shows where each of the Fed officials believe interest rates will be in the short, mid, and long term. Here’s the September dot plot (left) next to the one from yesterday’s meeting (right).
The dots make it plain as day: A number of Fed officials now believe we’re going to have to raise rates even higher… and keep them high for longer.
When the Fed last released these projections in September, they showed forecasts that the fed funds rate would peak between 4.75% and 5.0% sometime in 2023 before slowly coming back down the following years.
Now, we have notably more hawkish projections for rates of 5.1% to 5.4% in 2023 (with some Fed officials forecasting rates as high as 5.5% to 5.75%)…staying above 4% throughout 2024… and then maybe coming further down in 2025.
(Also, I would love to know who that one super hawk is, projecting interest rates of 5.5% to 5.75% THROUGH 2025. Bold.)
Powell’s comments put words to the message painted by the visual — there’s more work to do. A few choice quotes from his post-meeting press conference…
“I would say it’s our judgment today that we’re not in a sufficiently restrictive policy stance yet, which is why we say that we would expect that ongoing hikes will be appropriate.”
“Historical experience cautions strongly against prematurely loosening policy. I wouldn’t see us considering rate cuts until the committee is confident that inflation is moving down to 2% in a sustained way.”
In other words, the Fed’s keeping its foot on the gas, and it’s not letting up until the job is done.
Yes, this absolutely contributed to the selloff we saw on… but as I mentioned at the top, it wasn’t the only factor.
On Thursday, both the European Central Bank and the Bank of England issued their own rate hikes, along with messages that further tightening is likely.
Lastly, the U.S. retail sales report showed spending dropped in November — not a very promising start to the holiday season.
Powell keeps saying there’s still a chance for a “soft landing” where we successfully navigate inflation without triggering a recession, but that’s looking less and less likely.
And if we do end up in a recession, that’s certainly not the end of the world. Stocks have always recovered their recession losses over time, and I don’t expect that to change now.
Is the road going to be bumpy? Yes.
But those bumps don’t mean we should panic. It just means we have to be nimble. The strategies that outperform going forward probably won’t be the same as what worked during the bull market. But here’s something incredible…
Applying POWR Ratings to stocks under $10 has been a consistent winner through bear markets, bull markets, expansions, recessions, and everything in between.
Going all the way back to 1999, this strategy has delivered positive, market-beating returns in every year but one (2008).
It’s like nothing I’ve ever seen. And it’s a good signal we should stay the course.
What To Do Next?
If you’d like to see more top stocks under $10, then you should check out our free special report:
What gives these stocks the right stuff to become big winners, even in the brutal 2022 stock market?
First, because they are all low priced companies with the most upside potential in today’s volatile markets.
But even more important, is that they are all top Buy rated stocks according to our coveted POWR Ratings system and they excel in key areas of growth, sentiment and momentum.
Click below now to see these 3 exciting stocks which could double or more in the year ahead.
SPY shares closed at $383.27 on Friday, down $-6.36 (-1.63%). Year-to-date, SPY has declined -18.37%, versus a % rise in the benchmark S&P 500 index during the same period.
About the Author: Meredith Margrave
Meredith Margrave has been a noted financial expert and market commentator for the past two decades. She is currently the Editor of the POWR Growth and POWR Stocks Under $10 newsletters. Learn more about Meredith’s background, along with links to her most recent articles.
Mr. Market (SPY) may be moody, but he is also quite predictable at this time of year. I am talking about getting ready for the Santa Claus rally that is one of the most profitable stretches for investors year in and year out. And this year we have the perfect strategy to add a little more ho, ho, ho to your holiday season. Read the rest below.
shutterstock.com – StockNews
Warren Buffett likes to talk about “Moody Mr. Market” and that investors need to learn how to take advantage of the wild mood swings rather than become a victim of them.
Another thing about Moody Mr. Market is that he tends to act differently at various times of the year. And over time, he has developed some fairly consistent patterns. This means that certain strategies have a higher probability of success when these seasonal trends are in your favor.
It’s The Most Wonderful Time Of The Year…
The best example of this phenomenon is the Santa Claus rally in which stocks outperform at the end of Q4 and start of Q1. Since 1950, this short window has been positive 77% of the time, which ranks it as the No. 1 stretch of seven trading days for stock investing.
Even though the market has recently faced selling pressure following December’s rate hike, a year-end Santa Claus rally certainly isn’t out of the question.
If we’ve learned anything this year, it’s that Moody Mr. Market is as moody as ever.
Following each of the Federal Reserve’s rate increases in 2022, we’ve seen an initial drop followed by a substantial upswing.
Indeed it does seem to be rounding into form just like clockwork this year. We had our last rate hike of the year, followed by a market drop, which means we should have a positive bump in our near future.
That is why I want to share with you the perfect strategy to make the most of this upcoming Santa Claus Rally.
The Right Strategy
The best way to take advantage of these bullish factors is to buy two categories of stocks that these fund managers will prioritize: momentum and deep value.
Momentum stocks are typically companies with accelerating sales and earnings that lead to major share price outperformance. These especially stand out in bearish markets like 2022 as so many other firms are displaying weak results.
Especially in our current economic climate, people are going to be looking for stocks that are still managing to outperform.
On the other end of the spectrum, deep value stocks are ones that have been ignored or forgotten by the market. They are deeply oversold and have very low valuations.
Like a dry tinder box, this means that any sort of spark can send shares rocketing higher. And that spark is often investors focused in Q4 on greatly undervalued stocks that have tremendous promise in the year ahead.
Focus On Stocks Under $10
If you agree that these two categories have the most upside into year-end, then you should consider focusing on low-priced stocks under $10.
Here’s Why…
Low-priced stocks have the most upside in any part of the market and benefit the most from a bullish environment. Additionally, most low-priced stocks either fall into the deep value or momentum categories explained above.
This universe of stocks always offers an incredible opportunity to savvy investors, but that will be even more true this year if we will have a powerful wind at our backs due to bullish Q4 seasonality and the Santa Claus rally.
Earlier, we talked about Mr. Market and how we should take advantage of his mood swings. Well, these stocks under $10 are the best place to find gems that have been unfairly tarnished by Mr. Market’s earlier mood swings, yet ready to shine at this unique time of year.
What To Do Next?
Discover the best stocks under $10. That’s easy to do by starting a 30-day trial to our POWR Stocks Under $10 newsletter.
This newsletter portfolio harnesses an exclusive low-priced stock strategy that has generated an average annual return of +59.43%. In fact, four times in recent history it has produced annual gains north of 100%.
Yes, we know that sounds too good to be true. And that’s why we’re offering a 30-day trial for only $1. At a price that low, you can see for yourself risk-free.
This means that during the next month you’ll get full access to the entire POWR Stocks Under $10 portfolio — including the powerhouse stock up more than 400% this year… and still climbing — plus every trade alert by email and text. In fact, there are two more trades coming Monday morning, December 19.
There’s zero obligation beyond the $1 trial. However, we are confident that once you experience this potent trading strategy that has beaten the S&P 500 for 14 straight years, you will want to remain a member for a long, long time.
And if we are wrong, and you don’t like what you see… then simply cancel and pay nothing more.
So get started today and experience the market-shattering returns of POWR Stocks Under $10 for yourself.
Meredith Margrave Chief Growth Strategist Editor of the POWR Stocks Under $10 Newsletter
SPY shares were trading at $382.29 per share on Friday morning, down $7.34 (-1.88%). Year-to-date, SPY has declined -18.58%, versus a % rise in the benchmark S&P 500 index during the same period.
About the Author: Meredith Margrave
Meredith Margrave has been a noted financial expert and market commentator for the past two decades. She is currently the Editor of the POWR Growth and POWR Stocks Under $10 newsletters. Learn more about Meredith’s background, along with links to her most recent articles.
The Fed announced a 50-bps rate hike this week, stepping down from its 75-bps raises for four consecutive times. With cooling inflation and reduced interest rate hikes, the economy might succeed in avoiding a recession. However, as the market conditions are expected to remain uncertain with the Fed intending to continue hiking interest rates, investors should hold on to quality stocks Pfizer (PFE) and Lockheed Martin (LMT), which are rated Strong Buy in our proprietary rating system. Keep reading….
shutterstock.com – StockNews
The Fed raised interest rates by 50 bps yesterday, thereby taking the benchmark interest rate to the highest level in 15 years. However, it represented a slowdown from the four consecutive 75-bps hikes earlier.
Fed Chair Jerome Powell said, “Inflation data received so far for October and November show a welcome reduction in the monthly pace of price increases.”
Nonetheless, the market is expected to remain uncertain as the central bank intends to keep raising rates through 2023. Therefore, holding on to quality stocks Pfizer Inc. (PFE) and Lockheed Martin Corporation (LMT) could be wise. These stocks are rated A (Strong Buy) in our POWR Ratings system.
PFE discovers, develops, manufactures, markets, distributes, and sells biopharmaceutical products worldwide. It offers medicines and vaccines in various therapeutic areas.
On December 14, 2022, PFE and China Meheco Group Co Ltd. (China Meheco) signed an agreement under which China Meheco will import and distribute PFE’s oral COVID-19 treatment Paxlovid in mainland China amid the resurgence of covid cases. This deal is expected to generate additional revenue for PFE shortly.
Moreover, on December 8, 2022, PFE and BioNTech SE (BNTX) achieved the U.S. Food and Drug Administration’s Emergency Use Authorization for their Omicron BA.4/BA.5-adapted bivalent COVID-19 vaccine. It is the third 3-µg dose in the three-dose primary series for children between 6 months and four years, and it adds to the companies’ covid portfolio.
PFE has paid dividends for 33 consecutive years. Its dividend payouts have increased at 5.7% CAGR over the past five years. Its current dividend yield is 3.09%, while its four-year average yield is 3.63%.
For its third quarter that ended October 2, 2022, PFE’s United States segment revenues came in at $13.85 billion, up 97.3% year-over-year. Its non-GAAP net income came in at $10.17 billion, up 39.7% year-over-year. Also, its non-GAAP EPS came in at $1.78, up 40.2% year-over-year.
PFE’s revenue is expected to increase 23.3% year-over-year to $100.25 billion in 2022. Its EPS is expected to increase 46.4% year-over-year to $6.47 in 2022. It surpassed EPS estimates in all four trailing quarters. Over the past month, the stock has gained 10.6% to close the last trading session at $54.48.
PFE’s POWR Ratings reflect its promising outlook. It has an overall A rating representing a Strong Buy in our proprietary rating system. The POWR Ratings assess stocks by 118 different factors, each with its own weighting.
PFE has an A grade for Value and a B for Growth, Sentiment, and Quality. It is ranked #2 out of 160 stocks in the Medical – Pharmaceuticals industry. Click here for additional PFE ratings (Momentum and Stability).
Security and aerospace company LMT researches, designs, develops, manufactures, integrates, and sustains technology systems, products, and services worldwide. It has four segments: Aeronautics; Missiles and Fire Control; Rotary and Mission Systems; and Space.
On December 7, 2022, LMT and Sintavia, LLC announced a collaboration to expand research of metal additive manufacturing opportunities as an alternative to castings and forgings. Additive manufacturing is expected to offer advanced detail and design facilities while reducing operating costs and enhancing supply chains.
Also, on November 16, 2022, LMT and Microsoft Corporation (MSFT) announced a landmark expansion of their strategic relationship to help power the next generation of technology for the Department of Defense. This agreement is a potential game-changer for the defense industry and is expected to benefit LMT significantly.
LMT has paid dividends for 27 consecutive years. Its dividend payouts have increased at 8.9% CAGR over the past five years. Its current dividend yield is 2.50%, while its four-year average yield is 2.61%.
LMT’s net sales came in at $16.58 billion for the third quarter that ended September 25, 2022, up 3.5% year-over-year. Its net earnings came in at $1.78 billion, up 189.6% year-over-year, while its adjusted EPS came in at $6.87, up 4.1% year-over-year.
LMT’s revenue is estimated to increase 3.1% year-over-year to $18.28 billion for the quarter ending December 2022. Its EPS is expected to increase by 7.9% per annum for the next five years. It surpasses EPS estimates in three of four trailing quarters. Over the past year, the stock has gained 40.4% to close the last trading session at $485.19.
LMT’s strong fundamentals are reflected in its POWR Ratings. The stock’s overall A rating equates to a Strong Buy in our rating system. It has a B grade for Sentiment and Quality. It is ranked #3 out of 73 stocks in the Air/Defense Services industry.
Beyond what is stated above, we’ve also rated LMT for Growth, Value, Momentum, and Stability. Get all LMT ratings here.
PFE shares fell $0.05 (-0.09%) in premarket trading Thursday. Year-to-date, PFE has declined -4.74%, versus a -14.94% rise in the benchmark S&P 500 index during the same period.
About the Author: Riddhima Chakraborty
Riddhima is a financial journalist with a passion for analyzing financial instruments. With a master’s degree in economics, she helps investors make informed investment decisions through her insightful commentaries.
4 Stocks Investors Should Limit Their Exposure to This Winter
Following the release of lower-than-expected CPI data for November, the Fed raised the interest rate by 0.5%, as expected. However, the central bank indicated it would keep raising rates next year. Since the rising rates could slow the economy and keep the market volatile, avoiding fundamentally weak stocks Boeing (BA), ChargePoint (CHPT), ContextLogic (WISH), and Mullen (MUKN) could be wise. Keep reading….
shutterstock.com – StockNews
The broader market has taken a beating this year due to various macroeconomic and geopolitical headwinds, including sky-high inflation, the economic fallout from Russia’s invasion of Ukraine, and increasing recessionary fears. The S&P 500 is down 16.2% year-to-date, while the Nasdaq Composite has plunged 28.6%.
The Federal Reserve yesterday increased its benchmark interest rate by 50 basis points to the highest level in 15 years, signaling that the fight against inflation is not over despite some recent promising signs. With inflation cooling considerably in November, this month’s interest rate hike broke a string of four straight 75-basis-point hikes.
The central bank also indicated that it will deliver more rate hikes next year, with no reductions until 2024, even if the economy slips toward a recession. Based on the median forecast, the Fed expects to raise interest rates as high as 5.1% before the central bank ends its fight against stubborn inflation.
Given an uncertain economic and market backdrop, investors are advised to reduce their exposure to fundamentally weak stocks The Boeing Company (BA), ChargePoint Holdings, Inc. (CHPT), ContextLogic Inc. (WISH), and Mullen Automotive, Inc. (MULN).
BA designs, manufactures, and sells commercial jetliners, military aircraft, satellites, missile defense systems, human space flight, and launch systems and services worldwide. It operates through Commercial Airplanes (BCA); Defense, Space & Security (BDS); Global Services (BGS); and Boeing Capital (BCC) segments.
For the fiscal third quarter ended September 30, 2022, BA’s total cost and expenses increased 23.7% year-over-year to $16.78 billion. The company’s non-GAAP core operating loss came in at $3.08 billion, compared to non-GAAP core operating earnings of $59 million in the previous year’s period. The net loss attributable to BA shareholders worsened by 2,904.6% from the prior-year period to $3.28 billion.
In addition, the company’s non-GAAP core loss per share came in at $6.18, indicating a widening of 930% year-over-year.
In terms of trailing-12-month gross profit margin, BA’s 1.54% is 94.7% lower than the 29.09% industry average. And its trailing-12-month EBITDA marginof negative 4.36% compares to the industry average of 13.03%. Likewise, the stock’s trailing-12-month net income margin of negative 13.75% compares to the 6.75% industry average.
Analysts expect the company to report a loss per share of $8.60 for the fiscal year ending December 2022. Moreover, the company has missed its consensus EPS and revenue estimates in each of the trailing four quarters. The stock has declined 9.4% year-to-date to close the last trading session at $188.25.
BA’s POWR Ratings reflect this bleak outlook. The stock has an overall rating of D, which equates to a Sell in our proprietary rating system. The POWR Ratings assess stocks by 118 different factors, each with its own weighting.
BA has a D grade for Stability. It is ranked #54 of 73 stocks within the Air/Defense Services industry.
Click here to see the additional ratings for BA (Growth, Value, Momentum, Quality, and Sentiment).
CHPT provides electric vehicle (EV) charging networks and solutions in the United States and internationally. It offers a portfolio of hardware, software, and services for commercial, fleet, and residential customers.
For the fiscal 2023 third quarter ended October 31, 2022, CHPT’s total revenue increased 92.7% year-over-year to $125.34 million. However, the company’s bottom line declined significantly. Its operating expenses increased 30.2% from the year-ago value to $105.96 million. Its loss from operations widened 27.5% year-over-year to $83.28 million.
Furthermore, CHPT’s non-GAAP pre-tax net loss was $56.40 million, compared to $47.30 million in the prior year’s quarter. Also, its net loss per share came in at $0.25, widening 19.1% year-over-year.
In terms of trailing-12-month gross profit margin, CHPT’s 17.85% is 38.7% lower than the 29.09% industry average. Also, the stock’s trailing-12-month ROCE, ROTC, and ROTA of negative 70.69%, 33.28%, and 32.64% compare to industry averages of 14.19%, 6.76%, and 5.31%, respectively.
Analysts expect CHPT to incur a loss of $0.15 per share for the current quarter (ending January 2023). Likewise, the company’s loss per share is expected to widen by 16.3% from the previous year to $0.71. Shares of CHPT have slumped 43.3% year-to-date and 42.3% over the past year to close the last trading session at $11.26.
CHPT’s POWR Ratings are consistent with its bleak prospects. The stock has an overall F rating, equating to a Strong Sell in our proprietary rating system. In addition, the stock has an F grade for Value and Stability and a D for Quality.
We also have graded CHPT for Growth, Momentum, and Sentiment. Click here to access all CHPT’s ratings. It is ranked #81 out of 90 stocks in the Industrial – Equipment industry.
WISH is a mobile electronic commerce company. The company provides a discovery-based shopping platform that connects merchants’ products to users based on user preferences. Its personalized product feed enables the users to discover products to purchase by scrolling through its mobile application and browsing.
The company’s monthly average users (MAUs) declined 60% year-over-year to 24 million during the third quarter of fiscal 2022. Its LTM (Last Twelve Months) active users also fell 65.2% year-over-year to 16 million.
In the fiscal third quarter ended September 30, 2022, WISH’s revenue declined 66% year-over-year to $125 million, while its gross profit decreased 79.6% year-over-year to $34 million. Its adjusted EBITDA loss widened 216.7% year-over-year to $95 million. Cash outflows from operating activities stood at $100 million for the quarter.
In addition, WISH’s net loss worsened by 93.7% year-over-year to $124 million. Likewise, its loss per share widened 80% year-over-year to $0.18. The company’s total assets declined 29% to $911 million, compared to $1.28 billion for the fiscal year ended December 31, 2021.
WISH’s trailing-12-month EBITDA margin of negative 42.47% compares to the industry average of 7.89%. Also, the stock’s trailing-12-month net income margin of negative 45.05% compares to the 5.05% industry average.
The consensus revenue estimate of $152.02 million for the fourth quarter of the fiscal year (ending December 31, 2022) indicates a 47.4% year-over-year decline. Also, analysts expect the company’s loss per share to worsen 379.7% year-over-year to $0.15. The company has missed the consensus revenue estimates in each of the trailing four quarters, which is disappointing.
Furthermore, analysts expect WISH’s revenue for the current fiscal year to decline 71.6% to $592.71 million. Also, the company is expected to report a loss per share of $0.45 for the same period, indicating a widening of 38.9% year-over-year.
For the quarter ending December 31, 2022, WISH’s loss per share is expected to widen 378.5% year-over-year to $0.15. Its revenue for the current quarter is expected to decline 48% year-over-year to $150.40 million. The stock has declined 80.2% year-to-date to close the last trading session at $0.64.
WISH’s POWR Ratings reflect its weak fundamentals and poor prospects. The stock has an overall F rating, which translates to a Strong Sell in our proprietary rating system.
It has an F grade for Stability and a D for Growth and Quality. Within the F-rated Internet industry, it is ranked #56 out of 59 stocks. To see the other ratings of WISH for Value, Momentum, and Sentiment, click here.
MULN is an automotive company that manufactures and distributes premium electric vehicles (EVs) in the United States. It also operates CarHub, a digital platform that leverages AI to offer an interactive solution for buying, selling, and owning a car. In addition, the company offers battery technology and emergency point-of-care solutions.
MULN’s losses from operations widened 184.5% year-over-year to $18.22 million for the three months that ended June 30, 2022. Its pretax loss widened 82.6% from the prior-year period to $59.47 million. The company’s net loss worsened by 289.9% year-over-year to $59.47 million. Moreover, its net loss per share came in at $0.16.
MULN’s trailing-12-month ROTC of negative 618.14% compares to the industry average of 6.59%. And the stock’s trailing-12-month ROTA of negative 169.94% compares to the 4.38% industry average.
Over the past year, the stock has lost 95.3% to close the last trading session at $0.26. Also, it has declined 75.4% over the past six months.
MULN’s weak fundamentals are reflected in its POWR Ratings. It has an overall F rating, equating to a Strong Sell in our POWR Ratings system.
The stock also has an F grade for Value and Stability and a D for Sentiment and Quality. MULN is ranked #57 out of 64 stocks in the D-rated Auto & Vehicle Manufacturers.
Click here to access MULN’s ratings for Growth and Momentum.
BA shares fell $2.15 (-1.14%) in premarket trading Thursday. Year-to-date, BA has declined -6.49%, versus a -14.94% rise in the benchmark S&P 500 index during the same period.
About the Author: Mangeet Kaur Bouns
Mangeet’s keen interest in the stock market led her to become an investment researcher and financial journalist. Using her fundamental approach to analyzing stocks, Mangeet’s looks to help retail investors understand the underlying factors before making investment decisions.
 StackCommerce