Why Did the Tuesday Rally Shrink So Much…So Fast?

Bulls had to slow their roll on Tuesday as the immediate +3.5% rally was shaved by 80% into the close. Why did the rally fritter away? And what does it mean next for the stock market (SPY) going forward? 40 year veteran Steve Reitmeister shares his timely market outlook, trading plan and 8 top picks to generate gains in the weeks ahead.

shutterstock.com – StockNews

It felt like every trader on earth hit the buy button at 8:30am ET Tuesday morning as the softer than expected CPI report came out. This led to a shocking +3.5% surge in stock futures. If that held up it would have put the S&P 500 all the way up at 4,130.

But that didn’t hold up…neither did the recent high of 4,100…neither did the 200 day moving average at 4033…instead stocks only closed up modestly higher at 4,019.

Why did the rally fritter away? And what does it mean next for the bull/bear battle going forward?

That will be the focus of this week’s Reitmeister Total Return commentary.

Market Commentary

First, and foremost a reminder to watch my “2023 Stock Market Outlook” if you have not already. That’s because it covers the following vital topics:

  • Why 2023 is a “Jekyll & Hyde” year for stocks
  • 5 Warnings Signs the Bear Returns in Early 2023
  • 8 Trades to Profit on the Way Down
  • Plan to Bottom Fish @ Market Bottom
  • 2 Trades with 100%+ Upside Potential as New Bull Emerges
  • And Much More!

Watch Now: “2023 Stock Market Outlook” > 

The above outlook provides an important backdrop in which to discuss all new information including the CPI report from Tuesday morning. Assuming you have watched it already…then let’s pick up the story from there.

Yes, the Consumer Price Index (CPI) came in softer than expected this morning (7.1% yearly increase vs. 7.3% expected). And yes, this softer than expected trend is happening more and more often.

Now the wakeup call.

7.1% is not the same as 2% target (for those with who did poorly in math class).

Also the Producer Price Index last week was higher than expected. And that is the leading indicator of where CPI will be in the future. That’s because these are the input prices for manufactures and service providers which shows up in their offerings down the road. Meaning this softer than expected read may give way to higher readings in the future given the foreshadowing in PPI.

On top of that many of the forms of “sticky” inflation remain, well…STICKY.

Things like wages and rents are still too hot. The former issue of high wage inflation was on display in the 2X higher than expected monthly increase for wages found in the Government Employment Situation report back on 12/5…and helped spark a 4% selloff the following week.

Think of it this way…CPI looks backwards and PPI looks forward. So which is more important? (he asks rhetorically).

Yes, PPI. And that is telling you quite clearly that problem of high inflation is far from solved.

I sense that as the early morning excitement wore off, and investors sobered up, they began to realize that it was a bit too early to celebrate the death of inflation. And perhaps they need to wait to see what the Fed says Wednesday afternoon.

That’s because inflation is like a horror movie monster. You can’t just shoot it once and assume it’s dead. It will keep getting up each time you think the job is done and the death defying chase resumes.

In fact, Powell has discussed this many times over that the worst thing they can do is take their foot of the brakes too soon and inflation comes back with a vengeance. Inflation needs to be “dead and buried” before the Fed reverses course with lower rates.

As great proof of that notice how every time that we have one of these big stock rallies on news of softening inflation that commodity prices soar…which yes, speaks to inflation rising once again. The exact problem we are trying to solve.

Here was the early morning read for energy and key commodities as stock futures soared:
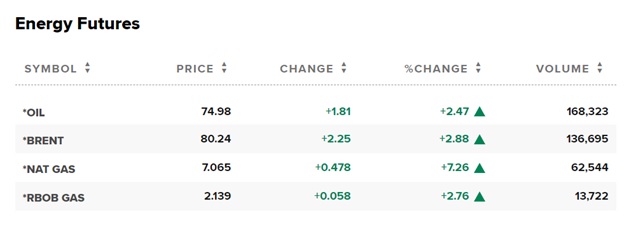
Long story short, the Fed has splashed cold water on exuberant traders several times this year. Thus, it pays to see what happens with the rate hike and announcement on Wednesday afternoon.

50 basis points is the expectation. The real key is the “dot plot” of where rates likely go in the future (how high…for how long) along with any statements they make that foreshadows future plans.

There we will find out if the Fed agrees with traders that inflation is moderating nicely and they do not have to be as hawkish for as long as previously expected. On the other hand, they may state quite clearly that they continue to see inflation as being more sticky and persistent than they would like, keeping them on the job much longer…with more pain to the economy…and likely lower stock prices.

The answer to that tells you whether stocks are truly ready to break out above the all important 200 day moving average (4,033). Or if it is time to head lower once again?

However, we are getting foolishly sucked into the investing worlds myopic fixation on inflation and the Fed. There is much more going on…like the health of the overall economy that is moving closer and closer still to recession. That was the central theme of my 2023 Stock Market Outlook presentation from last week with several leading indicators pointing in that darkening direction.

A prime example of this recessionary concern was on full display Tuesday morning from another low reading for the NFIB Small Business Outlook. Here is the key statement from their report:

“…most of the readings were still consistent with a recession and weak economic activity.”

So as the recessionary storm clouds keep circling…and inflation is far from dead…with the Fed still to keep their foot firmly on the brakes with higher rates on the way …then I see no wisdom in chasing this rally as stocks going down over the next 3-6 months makes a lot more sense then new bull market emerging now.

The only thing at this moment to change my mind is a clear Fed pivot on Wednesday to say indeed inflation is coming under control and they do not need to be as Hawkish as previously advertised.

This is possible…but highly improbable given the slew of statements that have made in the recent past. And that we have already seen the data they are looking at which includes too hot readings for PPI and wage inflation. And the nature they are slow and deliberate. Added altogether and it would be the shock of shocks for them to say “Mission Accomplished” on Wednesday.

Worst case scenario is another 2-3% upside into year end thanks to current momentum plus bullish bias of Santa Claus rally.

On the other hand, if still a bear market…which is the base case…then retreating to the previous lows of 3,491 in the New Years is still in the cards. And likely much lower.

What To Do Next?

Watch my brand new presentation: “2023 Stock Market Outlook” covering:

  • Why 2023 is a “Jekyll & Hyde” year for stocks
  • 5 Warnings Signs the Bear Returns in Early 2023
  • 8 Trades to Profit on the Way Down
  • Plan to Bottom Fish @ Market Bottom
  • 2 Trades with 100%+ Upside Potential as New Bull Emerges
  • And Much More!

Watch Now: “2023 Stock Market Outlook” > 

Wishing you a world of investment success!


Steve Reitmeister…but everyone calls me Reity (pronounced “Righty”)
CEO, Stock News Network and Editor, Reitmeister Total Return


SPY shares fell $0.22 (-0.05%) in after-hours trading Tuesday. Year-to-date, SPY has declined -14.39%, versus a % rise in the benchmark S&P 500 index during the same period.


About the Author: Steve Reitmeister

Steve is better known to the StockNews audience as “Reity”. Not only is he the CEO of the firm, but he also shares his 40 years of investment experience in the Reitmeister Total Return portfolio. Learn more about Reity’s background, along with links to his most recent articles and stock picks.

More…

The post Why Did the Tuesday Rally Shrink So Much…So Fast? appeared first on StockNews.com

https://www.entrepreneur.com/article/441090


CPI Report Comes In With a Bang

Last week, I discussed all of the reports we had coming due before the Fed’s December meeting (and rate hike announcement)…including the very important Consumer Price Index (CPI) report that was released this morning. It felt premature to send out my pre-Fed meeting market commentary before that last important inflation measure came out, and, boy… I’m glad I waited. Because it’s a doozy of a report. How this report impacted the S&P 500 (SPY) and what this could mean in the coming days is the focus of this week’s commentary. Read on below for more.

shutterstock.com – StockNews

(Please enjoy this updated version of my weekly commentary published December 13th, 2022 from the POWR Growth newsletter).

So, before we dive into today’s market-moving CPI report, I want to give you a quick recap of all the other big economic reports we got last week.

Productivity and labor costs: Revised higher than expected while labor costs for the quarter were revised down; both good signs when you’re looking to curb inflation.

Consumer credit: Lots of borrowing in October. Consumer credit continued to climb; the year-over-year growth rate is 6.9%, which is faster than 4.7% wage growth for the month. Strong sign of consumer demand.

Unemployment claims: Hit a 10-month high, due in part to a number of big layoffs at major companies. The 1.7 million jobless claims was slightly higher than economists were expecting, evidence that the strong labor market is softening.

Producer Price Index (PPI): Rose by 7.4% in November (year over year); that’s lower than the October growth rate (8.1%), but higher than what economists were forecasting for the month (7.2%). Inflation is falling… just slower than people were expecting.

University of Michigan Index of Consumer Sentiment: Improved more than expected. Inflation concerns also fell to a 15-month low.

Which brings us back to today’s Consumer Price Index (CPI) report.

For November, prices rose 7.1% year over year… which is faster than they climbed in October. BUT! — and this is the important part — that’s a slightly slower pace than economists were expecting.

The forecast for November was a 7.3% increase in prices.

Cue the confetti! That’s two months in a row where inflation came in slightly less than economists were expecting!

The S&P 500 (SPY) opened 2% higher on the news, although gains have moderated in the few hours since. We’re currently up about 0.7% for the day.

So, what does all this mean for us?

Well, I think it’s almost guaranteed that we’ll get a 50-basis point hike from the Fed tomorrow afternoon. There have been more than a few data points that show the economy is getting weaker, which has been the purpose behind these big, consecutive rate hikes.

It certainly doesn’t mean we’re at the start of our next bull market. In fact, some of these data points make me more wary of a potential recession. But the inflation news has been so bad for so long, I’m not surprised people are excited to see a little progress.

Don’t worry; the Fed still has plenty of time to spoil the party. If Powell’s post-meeting comments are in any way bearish, it could spark a big negative market reaction.

In fact, I’m pretty sure this is exactly what’s going to happen, since Powell will probably need to remind us all that the softening CPI numbers are a step forward, but there’s still much more work to be done (and pain).

The Fed’s “dot plot” could also put a damper on the CPI party. When the Fed last released these projections in September, they showed forecasts that the fed funds rate would peak between 4.75% and 5.0% sometime in 2023 before slowly coming back down the following years.

If the newest dot plot shows more Fed officials casting their “dots” at this highest level, or some officials forecasting an even higher level in 2023, or dots forecasting a heightened level for longer, then we would likely see some selling.

Personally, I still think it’s a little silly that we’re partying at all over a very minor “dovish” shift (and is it REALLY dovish if it’s still a rate increase??) when it’s still just as likely that we’ll be facing interest rates of 5% or higher over the next few years. But that’s just me.

What To Do Next?

The POWR Growth portfolio was launched in April last year and since then has greatly outperformed just about every comparable index…including the S&P 500, Russell 2000 and Cathie Wood’s Ark Innovation ETF.

What is the secret to success?

The portfolio gets most of its fresh picks from the Top 10 Growth Stocks strategy which has stellar +49.10% annual returns. I then take the very best stocks from this strategy and tell you exactly what to buy & when to sell, so you can maximize your gains.

If you would like to see the current portfolio of growth stocks, and be alerted to our next timely trades, then consider starting a 30 day trial by clicking the link below.

About POWR Growth newsletter & 30 Day Trial

All the Best!

Meredith Margrave
Chief Growth Strategist, StockNews
Editor, POWR Growth Newsletter


SPY shares . Year-to-date, SPY has declined -14.39%, versus a % rise in the benchmark S&P 500 index during the same period.


About the Author: Meredith Margrave

Meredith Margrave has been a noted financial expert and market commentator for the past two decades. She is currently the Editor of the POWR Growth and POWR Stocks Under $10 newsletters. Learn more about Meredith’s background, along with links to her most recent articles.

More…

The post CPI Report Comes In With a Bang appeared first on StockNews.com

https://www.entrepreneur.com/article/441089


3 Big Reasons Why Stocks Are Primed For A Probabilistic Pullback

Bolster the Warren Buffet “Fear and Greed” mantra with three more reliable indicators to increase your odds of sucess in trading.

shutterstock.com – StockNews

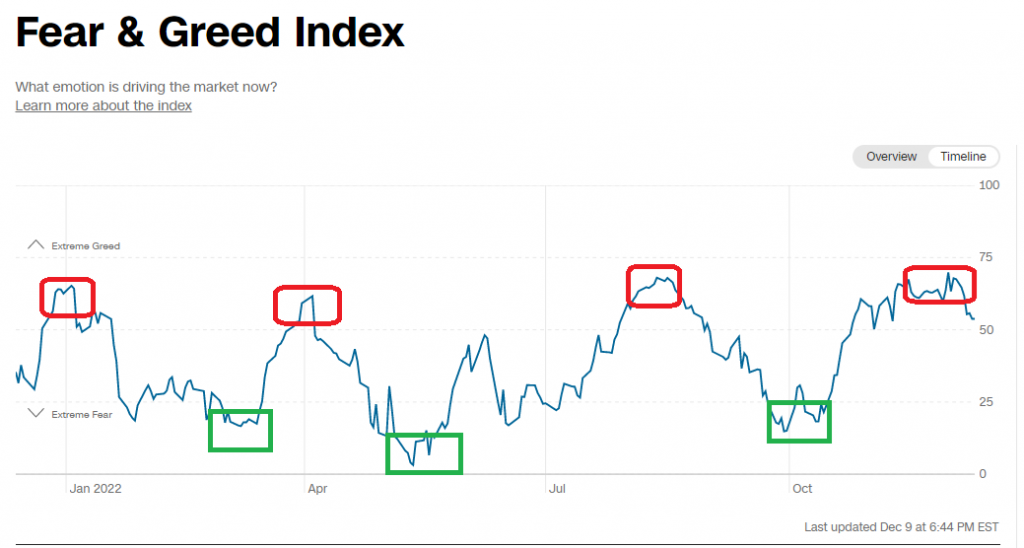
“Be Fearful When Others Are Greedy And Greedy When Others Are Fearful” is a famous stock market adage of famed investor Warren Buffet. The CNN Fear and Greed Index certainly epitomizes that notion. The chart below shows how greed and fear tend to swing back and forth from one extreme to the other.

Following in the footsteps of Mr. Buffet is never a bad decision, in my opinion. Getting greedy when others are fearful and fearful when others are greedy has worked well in 2022. Adding in a few other tried and true methodologies to that philosophy can make it even more robust. Here are three more ways to increase the odds of success in trading.

Technicals

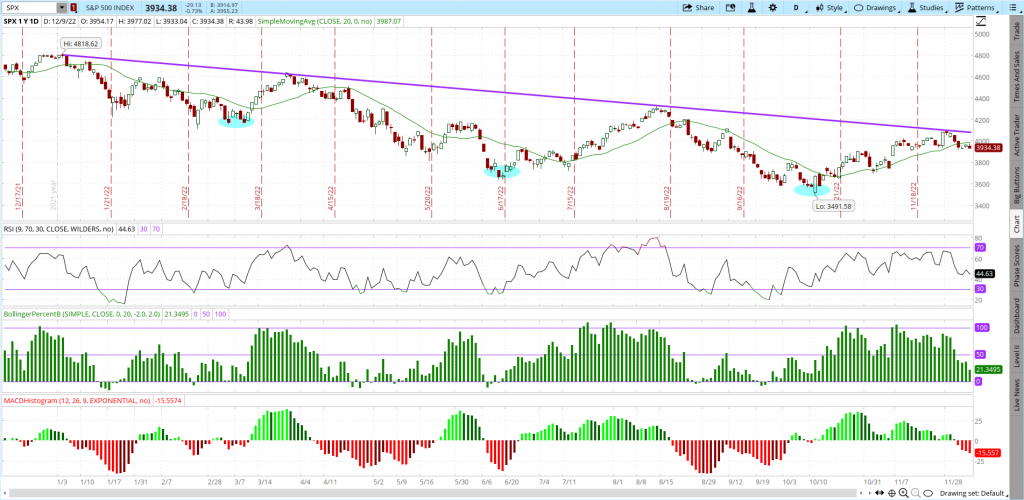
The chart below shows the one-year price action for the S&P 500 (SPX). It is evident that the SPX continues to be in a well-defined downtrend, with a series of lower highs and lower lows. Indeed, the recent strong rally we saw off the lows ended right at the trend line before beginning to reverse course.

How far the current pullback will go is anyone’s best guess. However, if previous history is any guide, then $3400 would be a good guess.

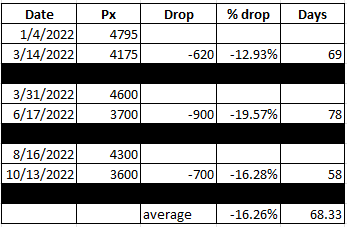
I pulled off the numbers from the prior three times the SPX fell from the downtrend line before bottoming out and heading back up, as seen in the table below.

The average of the three drops so far this year has been just over 16% and took roughly a little over two months. That would equate to a drop that ends up around $3400 in the S&P 500 by about February option expiration on 2/17/2023-if the averages hold.

Seasonality

Certainly, many are still waiting for the so-called “Santa Claus Rally” to take stocks higher on a seasonal basis into Christmas. Given the red-hot rally since October, Santa may have already come early for the markets. But seasonality is a two-edged sword. Once Kris Kringle leaves town, stocks tend to suffer.

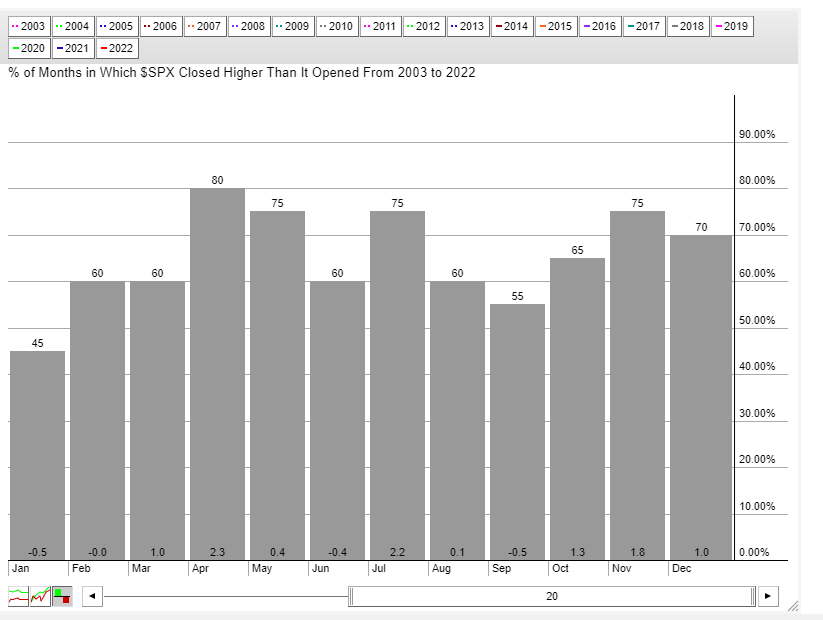
January has been the worst performing month for stocks over the past two decades. The S&P 500 has shown an average loss of 0.5% in that time frame and has dropped 55% of the time. February has been a laggard as well.

Stocks may have trouble finding their footing until springtime if seasonality is any guide.

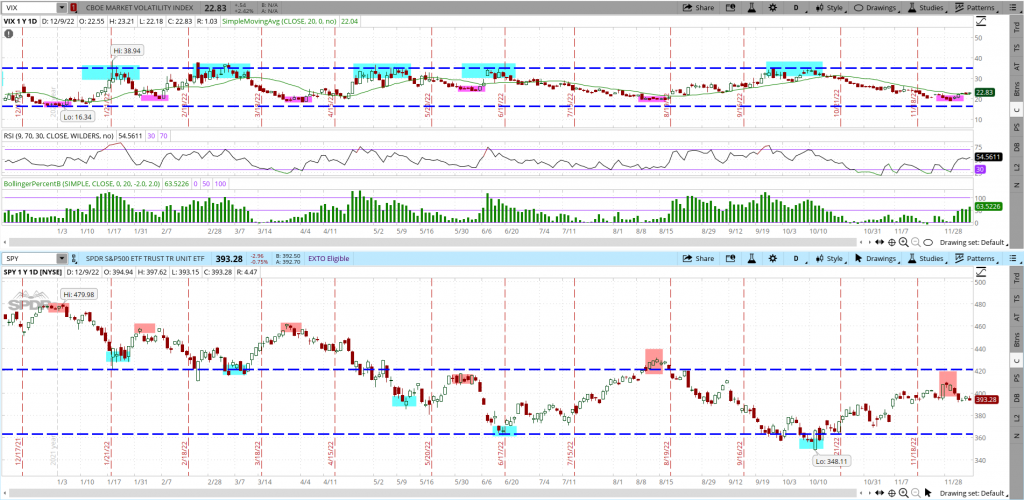
The VIX

The VIX is a measure of 30-day implied volatility in the S&P 500 options. It is also referred to as the fear gauge since it tends to rise when stocks drop and fall when stocks rally. I recently wrote an article that showed how you can use the VIX to time the market.

The chart below shows just how pops and drops in the VIX have corresponded almost precisely to similar drops and pops in the S&P 500. Also note how the VIX extremes correspond to the CNN Fear and Greed Index extremes noted at the start of this article.

The latest fall in the VIX from highs at 34 to the recent lows under 20, followed by a subsequent rally to nearly 23, generated another VIX-based sell signal for stocks. Each of the previous moves off the lows in the VIX ended up finally stalling at the 34 area. If history holds, the VIX has much further to head higher-and stocks have much further to fall.

As you can see in the chart, each new VIX-based Buy signal corresponded with a new low in the SPY, which is the S&P 500 ETF.

Everything being equal, stocks may not bottom out and be a buy until they make new lows on the year.

Trading is all about probability, not certainty. Using these three measures discussed in your decision making will help put probabilities-and therefore the odds- in your favor.

POWR Options

What To Do Next?

If you’re looking for the best options trades for today’s market, you should check out our latest presentation How to Trade Options with the POWR Ratings. Here we show you how to consistently find the top options trades, while minimizing risk.

If that appeals to you, and you want to learn more about this powerful new options strategy, then click below to get access to this timely investment presentation now:

How to Trade Options with the POWR Ratings

All the Best!

Tim Biggam

Editor, POWR Options Newsletter


SPY shares closed at $393.28 on Friday, down $-2.96 (-0.75%). Year-to-date, SPY has declined -16.24%, versus a % rise in the benchmark S&P 500 index during the same period.


About the Author: Tim Biggam

Tim spent 13 years as Chief Options Strategist at Man Securities in Chicago, 4 years as Lead Options Strategist at ThinkorSwim and 3 years as a Market Maker for First Options in Chicago. He makes regular appearances on Bloomberg TV and is a weekly contributor to the TD Ameritrade Network “Morning Trade Live”. His overriding passion is to make the complex world of options more understandable and therefore more useful to the everyday trader. Tim is the editor of the POWR Options newsletter. Learn more about Tim’s background, along with links to his most recent articles.

More…

The post 3 Big Reasons Why Stocks Are Primed For A Probabilistic Pullback appeared first on StockNews.com

https://www.entrepreneur.com/article/440849


2023 Stock Market Outlook

40 year investment veteran Steve Reitmeister shares his most complete and up to the minute analysis of what lies ahead in 2023. First a return of the bear market with the S&P 500 (SPY) making news lows. Yet just at the darkest hour the new bull market will emerge ushering in tremendous gains to investors who time it right. Steve shares his trading plan along with top 8 picks to profit on the way to bear market bottom. Next he shares a plan to buy the market bottom with 2 top picks set to rally 100%+. Get the full story below.

shutterstock.com – StockNews

It’s that time of year again for investors.

To put the past behind us in order to focus on the year that lies ahead.

This led me to record a timely presentation and trading plan that you should watch now:

2023 Stock Market Outlook >

I truly expect this to be a “Jekyll & Hyde” year for stock prices.

Meaning that no matter how impressive the recent rally looks it will fade fast in early 2023 finding newer and deeper lows for the bear market.

I have a trading plan and 8 specific picks to help you profit on the way down.

But just at the darkest hour is when the new bull market emerges ushering in tremendous gains.

Those who come late to the party will miss out on the best returns of the decade.

Gladly I have a trading plan for finding bear market bottom to enjoy serious profits as the new bull market emerges.

This includes details on 2 stellar picks that have 100%+ upside potential in 2023.

The time to prepare your investing plan for the year ahead starts now.

Your first step in that journey starts by watching my timely presentation shared below:

2023 Stock Market Outlook >

Wishing you a world of investment success!


Steve Reitmeister…but everyone calls me Reity (pronounced “Righty”)
CEO, Stock News Network and Editor, Reitmeister Total Return


SPY shares fell $0.43 (-0.11%) in after-hours trading Friday. Year-to-date, SPY has declined -16.24%, versus a % rise in the benchmark S&P 500 index during the same period.


About the Author: Steve Reitmeister

Steve is better known to the StockNews audience as “Reity”. Not only is he the CEO of the firm, but he also shares his 40 years of investment experience in the Reitmeister Total Return portfolio. Learn more about Reity’s background, along with links to his most recent articles and stock picks.

More…

The post 2023 Stock Market Outlook appeared first on StockNews.com

https://www.entrepreneur.com/article/440833


Stock Investors in a “Sticky” Situation

The S&P 500 (SPY) has been shedding weight all week long because inflation is looking too “sticky”. What does that mean? And why does it matter? 40 year investment veteran Steve Reitmeister spells it all out in this timely commentary that includes market outlook, trading plan and top picks. Read on below for the full story.

shutterstock.com – StockNews

Inflation and the Fed once again are taking center stage for investors. First, were signs of wages inflation being hotter than expected last Friday. Next comes an unwelcome increase in the Producer Price Index this Friday.

These are signs of “sticky inflation”. The kind that doesn’t fade so easy. The kind the Fed warned us about.

Oddly traders tried to shrug off the early losses this Friday…but came to their senses by selling with gusto into the close.

Let’s ponder why that is the case, along with the broader investment outlook, in this week’s commentary below…

Market Commentary

In my last commentary I discussed the catalysts at play for investors. Both the factors that cause bullish rallies as well as bearish drops.

The nutshell version of the article is to appreciate that the key ingredient for stock prices is the state of inflation and therefore how long the Fed will have to remain hawkish. The longer inflation stays around…the longer the Fed has high rates…the more likely to have recession and lower stock prices.

Most investors talk about the Consumer Price Index (CPI) when discussing inflation. However, the leading indicator of where that will be in the future is the related, Produce Price Index (PPI).

That’s because this report reviews the costs being taken in by companies now, that will show up as higher prices for their products and services down the road. Now you appreciate why the higher than expected reading for PPI Friday morning was not a welcome sign leading S&P 500 (SPY) futures to immediately drop from +0.5% to -0.5%…and then closing at -0.73% on the session.

What should really jump off the page for investors is to appreciate that the +0.3% month over month increase in PPI came at the same time that gasoline prices were down a full 6%. This is exactly what the Fed fears…that inflation is becoming “sticky” in other places.

Meaning more permanent. Meaning higher rates from the Fed on the way. Meaning still a long term battle to fight inflation which increases odds of hard landing (recession). And yes, meaning lower corporate earnings which begets lower stock prices.

Now let’s remember that on Friday 12/5 we learned in the Government Employment report that wage inflation was higher than expected. And wage inflation is about the stickiest category.

The release of that information had stock futures down about -1.5% at the time of the open. Oddly bulls kept bidding up stocks into the finish to a nearly breakeven result.

Over the weekend investors sobered up to the realization that this news was indeed quite bearish. That is why stocks trimmed over 3% in the first 3 sessions of the week.

This action is somewhat similar to the reaction to PPI this Friday morning. Stock futures dropped like a rock on the news. But somehow fought their way back until the final hour when the bears took the wheel.

Perhaps that is because some traders don’t fully appreciate that PPI is the leading indicator for the more widely followed CPI report which comes out Tuesday 12/13. Perhaps they want to roll the dice and see what happens there.

Or perhaps they want to wait for the next Fed rate decision on Wednesday 12/14. Let me remind investors that what happened at the last meeting. They foolishly rallied 2% within minutes of the announcement that future rate hikes would be lower.

However, when Powell took to the podium thirty minutes later, he reminded folks of the long term battle ahead. And the odds of creating a soft landing for the economy had greatly diminished. That speech turned that 2% rally all the way down to a -2.5% finish on session.

Long story short, investors can stay bullish if they want rolling the dice on what is in the 12/13 CPI report or 12/14 Fed announcement. However, when you pull back and look at the entirety of what is going on, which is what I did in my “2023 Stock Market Outlook”, then you will appreciate that odds still point firmly to recession forming early next year with lower lows on the way for stock prices.

What To Do Next?

Watch my brand new presentation: “2023 Stock Market Outlook” covering:

  • Why 2023 is a “Jekyll & Hyde” year for stocks
  • 5 Warnings Signs the Bear Returns in Early 2023
  • 8 Trades to Profit on the Way Down
  • Plan to Bottom Fish @ Market Bottom
  • 2 Trades with 100%+ Upside Potential as New Bull Emerges
  • And Much More!

Watch Now: “2023 Stock Market Outlook” >  

Wishing you a world of investment success!


Steve Reitmeister…but everyone calls me Reity (pronounced “Righty”)
CEO, Stock News Network and Editor, Reitmeister Total Return


SPY shares fell $0.43 (-0.11%) in after-hours trading Friday. Year-to-date, SPY has declined -16.24%, versus a % rise in the benchmark S&P 500 index during the same period.


About the Author: Steve Reitmeister

Steve is better known to the StockNews audience as “Reity”. Not only is he the CEO of the firm, but he also shares his 40 years of investment experience in the Reitmeister Total Return portfolio. Learn more about Reity’s background, along with links to his most recent articles and stock picks.

More…

The post Stock Investors in a “Sticky” Situation appeared first on StockNews.com

https://www.entrepreneur.com/article/440832


Is Gap Stock a Buy for Under $15

Apparel company Gap (GPS) has recently witnessed a rally. However, with persistent macroeconomic uncertainties surrounding interest rate hikes, let’s examine whether the stock has what it takes to deliver sustainable returns….

shutterstock.com – StockNews

The Gap, Inc. (GPS) is a specialty apparel company offering clothing, accessories, and personal care products for women, men, and children. The global and omnichannel retailer markets its offerings under the Old Navy, Gap, Banana Republic, and Athleta brands.

Despite losing 17.7% year-to-date to close the last trading session at $15.15, the stock is currently trading above its 200-day moving average of $11.30, indicating potential downside risks.

However, with the odds of the Fed ultimately increasing benchmark interest rates significantly above expectation increasing with every release of economic data, an end to current economic uncertainties doesn’t seem to be in sight.

Hence, let’s closely examine if the fundamentals make GPS worthy of investment.

Weak Financials

For the fiscal 2022 third quarter ended October 29, the non-GAAP gross profit of GPS decreased 5.4% year-over-year to $1.56 billion. The company’s gross margin for the period was 38.7%, lower than 41.9% during the previous-year quarter. Its operating income also decreased 8.2% year-over-year to $156 million.

GPS’s total assets stood at $12 billion as of October 29, 2022, compared to $12.78 billion as of October 30, 2021.

Bleak Analyst Estimates

Analysts expect GPS’ revenue for the fiscal year ending January 2023 to decrease 5.6% year-over-year to $15.73 billion. The company is expected to report a loss of $0.13 per share during the same period, compared to an EPS of $1.44 during the previous fiscal.

Inefficient Asset Utilization by Management

GPS’ trailing 12-month return on common equity of 2.05% is 84.1% lower than the industry average of 12.92%. The company’s trailing 12-month net income margin of 0.35% is remarkably lower than the industry average of 5.05%, while its trailing 12-month return on total assets of 0.46% is 89.5% lower than the industry average of 4.36%.

Unenviable Track Record

Over the past three years, GPS’ revenue has shrunk at a 0.9% CAGR, while its EBITDA has decreased at a 33.3% CAGR. The company’s net income also contracted at a 59.2% CAGR during the same period.

POWR Ratings Reflect Fundamental Weakness

GPS’ overall D rating translates to a Sell in our POWR Ratings system. The POWR Ratings assess stocks by 118 different factors, each with its own weighting.

Our proprietary rating system also evaluates each stock based on eight distinct categories. GPS has a grade D for stability owing to frequent changes at its helm. After parting ways with Art Peck in late 2019 and Sonia Syngal in July this year, the company is yet to appoint a new permanent CEO.

In addition, GPS has a D grade for Growth, in sync with its weak historical growth rates and bleak analyst estimates.

Unsurprisingly, GPS is ranked #59 of 66 stocks in the Fashion & Luxury industry.

Click here to see additional POWR Ratings for Value, Momentum, Sentiment, and Quality for GPS.

Bottom Line

Given that the Fed might go further than expected with its rate hikes, increasing borrowing costs and reducing discretionary expenditure could put further pressure on the company’s already compressed margins. The near-term outlook doesn’t seem encouraging for GPS.

Moreover, the company has an additional threat from fast fashion, which might further affect its profitability.

Given GPS’ weak financials, low profitability, and underwhelming growth prospects, it could be wise to avoid this apparel stock for now.

How Does The Gap, Inc. (GPS) Stack up Against Its Peers?

GPS has been rated D, equating to a Strong Sell. You may check out these other stocks within the Fashion & Luxury industry with an A (Strong Buy) or B (Buy) rating: J. Jill, Inc. (JILL), Hugo Boss AG (BOSSY), and Chico’s FAS, Inc. (CHS).


GPS shares were trading at $14.40 per share on Tuesday afternoon, down $0.75 (-4.95%). Year-to-date, GPS has declined -14.01%, versus a -16.51% rise in the benchmark S&P 500 index during the same period.


About the Author: Santanu Roy

Having been fascinated by the traditional and evolving factors that affect investment decisions, Santanu decided to pursue a career as an investment analyst. Prior to his switch to investment research, he was a process associate at Cognizant. With a master’s degree in business administration and a fundamental approach to analyzing businesses, he aims to help retail investors identify the best long-term investment opportunities.

More…

The post Is Gap Stock a Buy for Under $15 appeared first on StockNews.com

https://www.entrepreneur.com/article/440539


How to Stack the Odds in Your Favor…

Most investors have had a rough time in the turbulent 2022 stock market (SPY). Now more than ever they need a reliable way to identify winning stocks regardless of the current market conditions. The key to success is to take the guess work out of investing by having the computers do the heavy lifting for you. First, by narrowing down to the healthiest fundamental stocks using the POWR Ratings system. Next, applying leading edge technical analysis to find the timeliest of those stocks ready to break higher now. That’s what I discuss in more detail in the article below. Read on for more….

shutterstock.com – StockNews

So many traders and investors are always looking to get rich quick without any effort. Most never find it. They simply shuttle from one guaranteed get rich quick scheme to the next in the eternal quest for gold.

Ultimately, they always end up with fool’s gold…

Let me be the first to burst the bubble and tell you that the ‘Fountain of Youth’ doesn’t exist. You can’t lose weight without diet and exercise. Making money requires hard work.

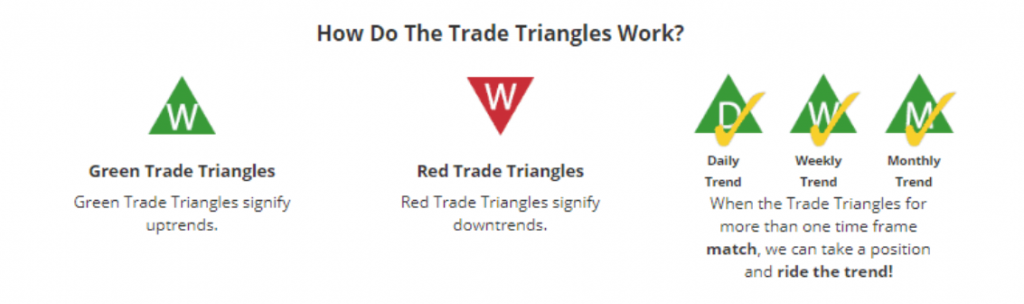
Luckily, however, there are ways to have someone else do most of the heavy lifting for you. Two of the best ways I found are the StockNews POWR Ratings and Market Club’s Trade Triangles.

Using these two together pairs the fundamental strength of the POWR Ratings with the technical prowess of the Trade Triangles leading to serious outperformance.

Then I add in my 30 plus years of trading experience to uncover highly rated quality stocks that are on the brink of a breakout.

Combining all these into one trading program results in the POWR Breakouts Portfolio I manage.

A brief description of each of the components is shown below. I use each of these in my daily trading decisions for the POWR Breakouts Portfolio.

The Fundamentals – StockNews POWR Ratings

StockNews created the proprietary POWR Ratings model to put the odds of investing success firmly in your favor.

This is truly one of the most complete stock ratings systems available to investors today. In fact, we analyze 118 different factors for every stock, each of them contributing a little to the stock’s likelihood of outperformance.

The combination of all these factors is what leads to the +31.10% annualized return for the “A” rated stocks, outperforming the S&P 500 by almost 4X since 1999.

Don’t worry…. you won’t need to analyze all 118 factors for each stock. We have simplified the process by narrowing it all down to an overall POWR Rating that clearly identifies whether the stock is likely to outperform (A & B rated).

The Technicals – Market Club’s Trade Triangles

Know exactly when to get in and out of the market!

This complex analysis hides behind easy-to-use, easy-to-understand signals – giving you the answers to make confident investment decisions.

Instead of finding just one trend, they confirm trends for multiple time periods to put the mathematical odds in your favor that you will be on the winning side of that swing.

These signals are not intended to catch tops and bottoms. Instead, the signals help members find the majority of a swing trend.

Green Triangles suggest positive trends
Red Triangles suggest negative trends

Monthly Triangles determine trend and possible entry points.
Weekly Triangles determine timing exits, entries, and re-entries.

Interesting to note that both services (POWR Ratings and Trade Triangles) don’t claim to have a foolproof formula. Far from it. They do a lot of hard work to generate the results.

Instead of a magic bullet, they both state that they look to put the odds in your favor.

At the end of the day, trading is about probability, not certainty.  There will be some losses, but the winners should more than outweigh the losers.

Trading is difficult and requires time, hard work, and discipline. There is no easy way to make money. The key is to have the computers do the heavy lifting.

For realistic traders and investors looking to realize above market type returns, using the combined efforts of the fundamental foundation of the POWR Ratings with the technical acumen of the Trade Triangles can help boost your odds.

Factor in the management by an industry veteran who isn’t afraid to take small losses and let winners run, and the probability of long-term success jumps even higher.

What To Do Next?

Discover my 7 hand picked stocks ready to burst higher even in the midst of the turbulent 2022 stock market. Plus 2 more picks are coming this Monday morning.

All you need to do is start a 30 day trial to POWR Breakouts to start enjoying more winning trades in the days and weeks ahead.

Start 30 Day Trial to POWR Breakouts >

Here’s to good trading!

Tim Biggam
Editor, POWR Breakouts Newsletter


SPY shares fell $0.84 (-0.21%) in after-hours trading Friday. Year-to-date, SPY has declined -13.34%, versus a % rise in the benchmark S&P 500 index during the same period.


About the Author: Tim Biggam

Tim spent 13 years as Chief Options Strategist at Man Securities in Chicago, 4 years as Lead Options Strategist at ThinkorSwim and 3 years as a Market Maker for First Options in Chicago. He makes regular appearances on Bloomberg TV and is a weekly contributor to the TD Ameritrade Network “Morning Trade Live”. His overriding passion is to make the complex world of options more understandable and therefore more useful to the everyday trader. Tim is the editor of the POWR Options newsletter. Learn more about Tim’s background, along with links to his most recent articles.

More…

The post How to Stack the Odds in Your Favor… appeared first on StockNews.com

https://www.entrepreneur.com/article/440355


3 Stocks Every Investor Should Add to Their Watchlist This Week

With significant growth registered in the third quarter, investor confidence has been uplifted. Hence, quality stocks with solid growth prospects, such as Amgen (AMGN), Cognizant Technology Solutions (CTSH), and Dole plc (DOLE), could be added to the watchlist this week. Read on….

shutterstock.com – StockNews

Multi-decade high inflation, the war in Ukraine, China’s strict COVID-19 policy, and rapid interest rate hikes have raised global recessionary fears and led to a massive sell-off in the equity market.

However, thwarting downturn fears, the U.S. economy grew substantially in the third quarter. Real gross domestic product (GDP) increased at an annual rate of 2.9% in the third quarter of 2022 versus a decrease of 0.6% in the second quarter, based on the increases in exports and consumer spending.

Moreover, Sam Stovall, chief investment strategist for CFRA Research, said, “At this point, the stock market is assuming that we won’t go into a recession or, if we do, that it will be mild and that the Fed will likely cut interest rates in the second half of 2023.”

As the so-called “Santa Rally” might create a bull market shortly, investors could consider adding fundamentally strong stocks Amgen Inc. (AMGN), Cognizant Technology Solutions Corporation (CTSH), and Dole plc (DOLE) to their portfolio to garner good returns in the near term.

Amgen Inc. (AMGN)

AMGN discovers, develops, manufactures, and delivers human therapeutics globally. The company primarily focuses on inflammation, oncology/hematology, bone health, cardiovascular disease, nephrology, and neuroscience.

On October 28, AMGN declared a $1.94 per share dividend for the fourth quarter of 2022, payable to shareholders on December 8, 2022. This reflects the shareholder return ability of the company.

On October 20, AMGN announced that it had completed its acquisition of ChemoCentryx, Inc. (CCXI), a biopharmaceutical company, for $52 per share in cash, representing aggregate merger consideration of approximately $3.7 billion. The acquisition should enhance AMGN’s inflammation and nephrology portfolio.

For the third quarter of 2022, AMGN’s non-GAAP operating income rose 7.4% year-over-year to $3.28 billion. Its non-GAAP net income increased 8.9% year-over-year to $2.53 billion, while its non-GAAP EPS grew 15.2% year-over-year to $4.70.

AMGN’s revenue is expected to increase 3.7% year-over-year to $6.47 billion in the fiscal first quarter ending March 2023. Its EPS is expected to increase 7% year-over-year to $4.55 in the same quarter. Additionally, it surpassed EPS estimates in all four trailing quarters, which is impressive.

The stock has gained 27.1% year-to-date to close the last trading session at $285.94. Over the past month, the stock has gained 5.1%.

AMGN’s POWR Ratings reflect this promising outlook. The company has an overall rating of B, which translates to Buy in our proprietary rating system. The POWR Ratings assess stocks by 118 different factors, each with its own weighting.

AMGN has an A grade for Quality and a B for Stability. Within the Biotech industry, it is ranked #11 out of 379 stocks.

Beyond what is stated above, one can see the additional AMGN grades for Momentum, Growth, Value, and Sentiment here.

Cognizant Technology Solutions Corporation (CTSH)

CTSH is a professional services company providing consulting, technology, and outsourcing services globally. The company has four operating segments: Financial Services; Healthcare; Products and Resources; and Communications, Media, and Technology.

On November 29, CTSH announced it had entered into an agreement to acquire AustinCSI, a digital transformation consultancy specializing in enterprise cloud and data analytics advisory services. This acquisition is expected to bolster the company’s advisory capabilities.

On November 1, CTSH announced that it had agreed to acquire the professional services and application management practices of OneSource Virtual. The acquisition is expected to complement its existing finance and HR advisory implementation services.

During the fiscal third quarter that ended September 30, CTSH’s revenue increased 2.4% year-over-year to $4.86 billion. Its adjusted income from operations grew 6.5% from its year-ago value to $798 million, while the net income increased 15.6% from its prior period to $629 million. The company’s adjusted earnings per share increased 10.4% year-over-year to $1.17.

Analysts expect CTSH’s revenue to increase 1.3% year-over-year to $4.89 billion for the fiscal first quarter ending March 2023. The company’s EPS is expected to grow 2% year-over-year to $1.10 in the same quarter. Also, it has an impressive earnings surprise history as it surpassed the consensus EPS estimates in each of the trailing four quarters.

The company’s shares have increased 2.5% over the past five days and marginally intraday to close its last trading session at $62.62.

The company’s promising prospect is reflected in its POWR Ratings. The stock has an overall B rating, equating to a Buy in our proprietary rating system. CTSH also has an A grade for Quality and a B for Value. Within the A-rated Outsourcing – Tech Services industry, it is ranked #2 of 10 stocks.

To see additional POWR Ratings for Growth, Momentum, Stability, and Sentiment for CTSH, click here.

Dole plc (DOLE)

DOLE, headquartered in Dublin, Ireland, engages in sourcing, processing, marketing, and distributing fresh fruit and vegetables. The company operates through four segments: Fresh Fruit; Diversified Fresh Produce – EMEA; Diversified Fresh Produce – Americas and ROW; and Fresh Vegetables.

On November 15, Dole Fresh Vegetables, a division of DOLE, announced the implementation and activation of two General Electric 2.8-Megawatt wind turbines at its salad processing plant in Soledad, CA.

Timothy Escamilla, President of Dole Fresh Vegetables, said, “The turbines are projected to produce over 19 million kilowatt hours of clean electricity per year, which will result in a 70% offset to our overall energy consumption at this site.”

For the third quarter that ended September 30, DOLE’s revenue rose 16.8% year-over-year to $2.27 billion. Its adjusted EBITDA rose 32.8% year-over-year to $72.98 million. Its adjusted net income increased 127% year-over-year to $13.53 million, while its adjusted EPS grew 100% year-over-year to $0.14.

DOLE’s revenue is expected to increase 2.6% year-over-year to $9.30 billion in the fiscal year ending December 2023. Its EPS is expected to increase 21% year-over-year to $1.19 in the same year. Additionally, it surpassed EPS estimates in all four trailing quarters, which is impressive.

The stock has gained 14.8% over the past three months to close the last trading session at $10.46. Over the past month, the stock has gained 21.9%.

DOLE has an overall rating of B, which translates to Buy in our proprietary rating system. It also has a B grade for Growth and Value. Within the Agriculture industry, it is ranked #12 out of 28 stocks.

Beyond what is stated above, we’ve also rated DOLE for Momentum, Stability, Sentiment, and Quality. Get all DOLE ratings here.


AMGN shares were trading at $284.81 per share on Friday morning, down $1.13 (-0.40%). Year-to-date, AMGN has gained 30.60%, versus a -13.93% rise in the benchmark S&P 500 index during the same period.


About the Author: Sristi Suman Jayaswal

The stock market dynamics sparked Sristi’s interest during her school days, which led her to become a financial journalist. Investing in undervalued stocks with solid long-term growth prospects is her preferred strategy. Having earned a master’s degree in Accounting and Finance, Sristi hopes to deepen her investment research experience and better guide investors.

More…

The post 3 Stocks Every Investor Should Add to Their Watchlist This Week appeared first on StockNews.com

https://www.entrepreneur.com/article/440305


1 Stable Stock Warren Buffett Likes to Own

World-famous investor Warren Buffett picked up shares of healthcare services provider McKesson Corporation (MCK) this year. The company has raised its dividends for 16 consecutive years. With a recession expected next year, this healthcare services stock is expected to remain stable as demand for healthcare and related services usually remain unaffected regardless of economic conditions. Thus, investors may consider buying the stock now. Read more….

shutterstock.com – StockNews

Warren Buffett is unarguably the world’s most famous investor, as his investments have made him billions. Buffett’s Berkshire Hathaway picked up 2.92 million shares of healthcare services provider McKesson Corporation (MCK) in the first quarter and added 276K more in the second quarter.

MCK missed the consensus EPS estimate by 0.7% in the last quarter. However, its revenue beat analyst estimates by 0.2%. MCK raised its outlook for fiscal 2023. It expects its adjusted EPS to come between $24.45 and $24.95 from the previous expectation of $23.95 to $24.65.

The company is expected to pay a quarterly dividend of $0.54 on January 3, 2023. Its annual dividend of $2.16 yields 0.57% on the current share price. It has a four-year average yield of 0.94%.

Its dividend payouts have increased at an 8.1% CAGR over the past three years and a 10.3% CAGR over the past five years. The company has grown its dividend payments for 15 consecutive years.

MCK’s shares have gained 52.8% in price year-to-date and 76.3% over the past year to close the last trading session at $379.72. Wall Street analysts expect the stock to hit $425.73 in the near term, indicating a potential upside of 12.1%.

Here’s what could influence MCK’s performance in the upcoming months:

Strategic Acquisition

On September 19, 2022, MCK announced that it had signed an agreement to acquire Rx Savings Solutions (RxSS). MCK’s CEO Brian Tyler said, “We expect the acquisition of Rx Savings Solutions to accelerate McKesson’s growth priority in biopharma services by extending our ecosystem of differentiated medication access solutions to patients.”

Robust Financials

MCK’s revenues increased 5.4% year-over-year to $70.15 billion for the second quarter ended September 30, 2022. The company’s operating income increased 108.5% year-over-year to $1.12 billion.

For the six months ended September 30, 2022, MCK’s cash and cash equivalents at the end of the period increased 35.6% year-over-year to $2.91 billion. Its net income attributable to MCK increased 247% year-over-year to $926 million.

Favorable Analyst Estimates

MCK’s EPS for fiscal 2023 and 2024 is expected to increase 4.4% and 6.5% year-over-year to $24.73 and $26.33, respectively. Its revenue for fiscal 2023 and 2024 is expected to increase 4.5% and 3.8% year-over-year to $275.87 billion and $286.46 billion, respectively.

Discounted Valuation

In terms of forward non-GAAP P/E, MCK’s 15.35x is 22.8% lower than the 19.88x industry average. Its forward P/S of 0.20x is 95.7% lower than the 4.53x industry average. Also, the stock’s 11.20x trailing-12-month EV/EBITDA is 17.1% lower than the 13.52x industry average.

High Profitability

MCK’s trailing-12-month net income margin is 0.76% compared to the negative industry average. Likewise, its trailing-12-month EBIT margin is 1.20%, compared to the negative industry average. Furthermore, the stock’s trailing-12-month levered FCF margin is 1.37% compared to the negative industry average.

POWR Ratings Show Promise

MCK has an overall rating of A, which equates to a Strong Buy in our POWR Ratings system. The POWR Ratings are calculated by taking into account 118 different factors, with each factor weighted to an optimal degree.

Our proprietary rating system also evaluates each stock based on eight distinct categories. MCK has a B grade for Value, consistent with its discounted valuation.

It has a B grade for Quality, in sync with its high profitability. In addition, its favorable analyst estimates justify its B grade for Sentiment.

MCK is ranked first out of 79 stocks in the Medical – Services industry. Click here to access MCK’s Growth, Momentum, and Stability ratings.

Bottom Line

Despite the underperformance of the major indexes, Warren Buffett’s holding MCK is trading above its 50-day and 200-day moving averages of $366.99 and $334.36, respectively, indicating an uptrend. The company’s stability can be gauged from the fact that it has raised its dividends for 15 consecutive years. Its acquisition of Rx Savings Solutions will help its growth in biopharma services.

Given its robust financials, solid dividend payouts, favorable analyst estimates, high profitability, and discounted valuation, it could be wise to buy Warren Buffett’s stock.

How Does McKesson Corporation (MCK) Stack up Against Its Peers?

MCK has an overall POWR Rating of A, equating to a Strong Buy rating. Check out these other stocks within the Medical – Services industry with an A (Strong Buy) or B (Buy) rating: HealthStream, Inc. (HSTM), AmerisourceBergen Corporation (ABC), and Addus HomeCare Corporation (ADUS).


MCK shares were trading at $384.88 per share on Friday morning, up $5.16 (+1.36%). Year-to-date, MCK has gained 55.77%, versus a -14.12% rise in the benchmark S&P 500 index during the same period.


About the Author: Dipanjan Banchur

Since he was in grade school, Dipanjan was interested in the stock market. This led to him obtaining a master’s degree in Finance and Accounting. Currently, as an investment analyst and financial journalist, Dipanjan has a strong interest in reading and analyzing emerging trends in financial markets.

More…

The post 1 Stable Stock Warren Buffett Likes to Own appeared first on StockNews.com

https://www.entrepreneur.com/article/440304


3 Stocks You Won’t Regret Buying in December 2022

The Fed Chairman recently indicated a slower pace of rate increases. However, many analysts still believe the economy will face a mild recession next year. Therefore, it could be wise to invest in quality stocks with solid growth prospects, such as AbbVie (ABBV), Bristol-Myers Squibb (BMY), and Lifeway Foods (LWAY). Read more….

shutterstock.com – StockNews

The Federal Reserve’s aggressive rate hikes to curb the persistently high inflation and geopolitical concerns have brought upon a stock market downturn this year. However, the last CPI data showed signs of slowing inflation. Therefore, Fed Chairman Jerome Powell recently indicated that the central bank would raise interest rates at a slower pace.

Analysts expect a 50-basis-point rate increase at the Fed’s December monetary policy meeting. Powell said, “It makes sense to moderate the pace of our rate increases as we approach the level of restraint that will be sufficient to bring inflation down.”

U.S. equities rallied after Powell’s speech, with the S&P 500 index moving above its 200-day moving average for the first time since April 2022. Moreover, the Dow Jones Industrial Average hauled itself from the bear market territory.

David Russell, VP of market intelligence at TradeStation Group, said, “Powell needs to keep talking tough but he gave Wall Street reason for hope.” “Everyone knows rate hikes take time to operate and we’re seeing their effects as the labor market cools” he added.

According to Goldman Sachs Research, the U.S. economy is forecasted to narrowly avoid a recession as inflation cools off and unemployment climbs slightly. The investment bank’s economists believe there is a 35% probability of the U.S. tipping into a recession over the next year. This estimate is below the median of 65% among forecasters in a Wall Street Journal survey.

Amid this backdrop, investors may consider buying fundamentally strong stocks with solid growth prospects, such as AbbVie Inc. (ABBV), Bristol-Myers Squibb Company (BMY), and Lifeway Foods, Inc. (LWAY).

AbbVie Inc. (ABBV)

Biopharmaceutical company ABBV is engaged in the research, development, manufacturing, commercialization, and sale of medicines and therapies. The company is present in various therapeutic categories like immunology, oncology, aesthetic, neuroscience, and women’s health products.

On October 22, 2022, ABBV acquired DJS Antibodies Ltd., a privately held UK-based biotechnology company involved in discovering and developing antibody medicines that target difficult-to-drug disease-causing proteins, such as G protein-coupled receptors (GPCRs).

“This acquisition will deliver new capabilities to enhance our current antibody research activities, an opportunity to strengthen our immunology portfolio, and provide a strong foothold for expanded research efforts in the dynamic bioscience hub in Oxford, UK,” said Jonathon Sedgwick, Ph.D., ABBV’s VP and Global head of discovery research.

ABBV’s net revenues increased 3.3% year-over-year to $14.81 billion in the third quarter ended September 30, 2022. The company’s operating income increased 6.9% year-over-year to $4.60 billion. Its adjusted after-tax earnings increased 29.1% year-over-year to $6.53 billion. Also, its adjusted EPS came in at $3.66, representing an increase of 29.3% year-over-year.

Analysts expect ABBV’s EPS and revenue for the quarter ending December 31, 2022, to increase 10.8% and 3.1% year-over-year to $3.67 and $15.35 billion, respectively. It has surpassed Street EPS estimates in each of the trailing four quarters. Over the past year, the stock has gained 39.8% to close the last trading session at $161.18.

ABBV’s POWR Ratings reflect solid prospects. The company has an overall rating of A, which translates to a Strong Buy in our proprietary rating system. The POWR Ratings assess stocks by 118 different factors, each with its own weighting.

It has an A grade for Quality and a B for Growth and Value. It is ranked #5 out of 160 stocks in the Medical -Pharmaceuticals industry. Click here to see the additional ratings of ABBV for Momentum, Stability, and Stability.

Bristol-Myers Squibb Company (BMY)

BMY develops, licenses, manufactures, and markets biopharmaceutical products worldwide. It offers products for hematology, oncology, cardiovascular, immunology, fibrotic, neuroscience, and COVID-19.

On August 17, 2022, BMY announced the completion of the acquisition of Turning Point Therapeutics, Inc. BMY’s Executive VP of Strategy & Business Development, Elizabeth Mily, said, “Turning Point has distinguished itself in the field of precision oncology, and this acquisition will further strengthen our leading oncology franchise.”

BMY’s total in-line products and new product portfolio revenue increased 8% year-over-year to $8.62 billion for the third quarter ended September 30, 2022. The company’s non-GAAP earnings before income taxes increased 0.9% year-over-year to $5.13 billion. Its non-GAAP EPS attributable to BMY increased 3.1% year-over-year to $1.99. Also, its total expenses increased 4.8% year-over-year to $9 billion.

For fiscal 2022, BMY’s EPS is expected to increase 1.4% year-over-year to $7.62. Its revenue for the quarter ending June 30, 2023, is expected to increase 1% year-over-year to $12 billion. It surpassed the consensus EPS estimates in each of the trailing four quarters. Over the past year, the stock has gained 49.7% to close the last trading session at $80.28.

BMY’s strong fundamentals are reflected in its POWR Ratings. The stock has an overall rating of A, which translates to a Strong Buy in our proprietary rating system.

It is ranked #4 in the same industry. It has an A grade for Value and a B for Stability, Sentiment, and Quality. To see the other ratings of BMY for Growth and Momentum, click here.

Lifeway Foods, Inc. (LWAY)

LWAY produces, markets, and sells probiotic-based products internationally. The company’s primary product is drinkable kefir, a cultured dairy product. The company also provides European-style soft cheeses. The company sells its products under the Lifeway and Fresh Made brand names and under private labels.

Julie Smolyansky, LWAY’s President and CEO, stated, “We have recently gained traction within the convenience channel, and see this as an opportunity to build brand awareness and introduce new consumers to our single-serve products. We look forward to finishing the year strong and preparing for a healthy 2023.”

LWAY’s net sales increased 29.1% year-over-year to $38.14 million in the third quarter ended September 30, 2022. The company’s gross profit increased 8.5% year-over-year to $7.58 million. Its net income increased 104.8% year-over-year to $983K. Also, its EPS came in at $0.06, representing an increase of 100% year-over-year.

Analysts expect LWAY’s EPS and revenue for fiscal 2023 to increase 375% and 5% year-over-year to $0.38 and $152 million, respectively. The stock has gained 45.2% year-to-date to close the last trading session at $6.68.

It’s no surprise that LWAY has an overall rating of A, which equates to a Strong Buy in our POWR Rating system. It has an A grade for Growth and a B for Value, Stability, Sentiment, and Quality. It is ranked #4 out of 49 stocks in the Food Makers industry. Click here to see LWAY’s rating for Momentum as well.


ABBV shares were trading at $161.01 per share on Thursday morning, down $0.17 (-0.11%). Year-to-date, ABBV has gained 23.55%, versus a -12.85% rise in the benchmark S&P 500 index during the same period.


About the Author: Dipanjan Banchur

Since he was in grade school, Dipanjan was interested in the stock market. This led to him obtaining a master’s degree in Finance and Accounting. Currently, as an investment analyst and financial journalist, Dipanjan has a strong interest in reading and analyzing emerging trends in financial markets.

More…

The post 3 Stocks You Won’t Regret Buying in December 2022 appeared first on StockNews.com

https://www.entrepreneur.com/article/440228