3 Stocks That Can Help Ease Your Recession Fears

Major macroeconomic headwinds have heightened recessionary fears in the economy. Moreover, the Fed will likely keep raising rates next year as well. Amid fears of a downturn, fundamentally strong stocks PepsiCo (PEP), Humana (HUM), and Weis Markets (WMK) might be ideal investments based on their stable and consistent dividend history. Read on.

shutterstock.com – StockNews

Rising interest rates, red-hot inflation, the war in Ukraine, and the environmental crisis have pushed the economy over the edge this year. Moreover, with China’s lockdown exacerbating supply chain and pricing pressures, the U.S. economy appears to be teetering toward recession.

Although Jerome Powell has recently signaled a slowdown in rate hikes, Beth Ann Bovino, the chief U.S. economist at S&P Global Ratings, said she expects another Fed rate increase this year, predicting the federal funds rate to reach 5% to 5.25% by the second quarter of 2023.

Bank of America has predicted recessionary pressures to hit markets in the first quarter of next year and expects growth to fall by 0.4%. Savita Subramanian, the bank’s head of U.S. equity strategy, said, “We think the market could drop as low as 3,000 based on a panoply of indicators, given a host of risks we face as payback continues and a recession unfolds.”

Amid the heightened recessionary fears, fundamentally strong stocks PepsiCo, Inc. (PEP), Humana Inc. (HUM), and Weis Markets, Inc. (WMK) might be ideal investments. Moreover, these companies have a history of stable and consistent dividend payments.

PepsiCo, Inc. (PEP)

PEP is a global beverage and convenience foods company. The company operates through seven segments: Frito-Lay North America; Quaker Foods North America; PepsiCo Beverages North America; Latin America; Europe; Africa, Middle East, and South Asia; and Asia Pacific, Australia and New Zealand and China Region.

On September 14, 2022, PEP and Archer-Daniels-Midland Company (ADM) announced a groundbreaking 7.5-year strategic commercial agreement to collaborate closely on projects that aim to significantly expand regenerative agriculture across their shared North American supply chains.

The companies’ capabilities span the food and agriculture value chains, creating a unique, large-scale platform to support farmers’ transition to regenerative agriculture while building their resilience to climate change.

On November 17, PEP declared a quarterly dividend of $1.15 per share payable on January 6, 2023, which reflects a 7% increase compared to a year-earlier period.

PEP’s annual dividend of $4.60 translates to a 2.49% yield. Over the last five years, PEP’s dividend payouts have grown at a 7.4% CAGR. PEP has paid consecutive quarterly cash dividends since 1965, and this year marked the company’s 50th consecutive annual dividend increase.

PEP’s net revenue for the third quarter ended September 3, 2022, increased 8.8% year-over-year to $21.97 billion. Its non-GAAP operating profit increased 11% year-over-year to $3.59 billion. The company’s non-GAAP net income attributable to PEP increased 10.1% year-over-year to $2.73 billion, while its adjusted EPS increased 10% from the prior-year period to $1.97.

Street expects PEP’s EPS for the current fiscal year ending December 2022 to increase 8.4% year-over-year to $6.78. Its revenue is likely to grow 6.8% year-over-year to $84.87 billion. The company has surpassed its consensus EPS and revenue estimates in each of the trailing four quarters, which is impressive.

Over the past year, the stock has gained 16.1% to close the last trading session at $185.51. PEP has a 24-month beta of 0.52.

PEP’s strong fundamentals are reflected in its POWR Ratings. The stock has an overall rating of B, equating to Buy in our proprietary rating system. The POWR Ratings are calculated by considering 118 different factors, with each factor weighted to an optimal degree.

It has an A grade for Quality and a B for Growth, Stability, and Sentiment. It is ranked #8 out of 34 stocks in the A-rated Beverages industry.

Click here to see the other PEP ratings for Value and Momentum.

Humana Inc. (HUM)

HUM is a health and well-being company that operates through three segments: Retail; Group and Specialty; and Healthcare Services. The company provides medical and supplemental benefit plans to individuals.

On November 22, HUM announced the completion of its public offering of $1.25 billion in aggregate principal amount of senior notes. These senior notes are comprised of $500 million of the company’s 5.750% senior notes due 2028 at 99.705% of the principal amount and $750 million of the company’s 5.875% senior notes due 2033 at 99.508% of the principal amount. The company expects net proceeds of approximately $1.23 billion.

On October 26, HUM and Monogram Health, a kidney-care provider, announced a new value-based care agreement for most Humana Medicare Advantage HMO and PPO plan members in four states for people with chronic kidney disease.

Carl Daley, HUM Senior Vice President of Retail Strategy and Operations, said, “Building on our existing relationship with Monogram is an important way we can provide the highest levels of support and access to care for our members.”

On October 27, HUM announced a dividend of $0.7875 per share, payable on January 27, 2023. The company’s annual dividend of $3.15 per share yields 0.59% at the current price. HUM’s dividends grew at 12.5% CAGR over the past three years and 15.5% CAGR over the last five years. The company has had five consecutive years of dividend growth.

HUM’s adjusted revenue increased 9% year-over-year to $22.75 billion in the fiscal third quarter of 2022. Its adjusted operating cash flows came in at $2.68 billion, and its adjusted EPS rose 42.4% from the prior-year period to $6.88.

Analysts expect HUM’s EPS to increase 21.3% year-over-year to $25.04 in the current fiscal year ending December 2022. Likewise, its revenue estimate of $92.81 billion for the same year indicates an improvement of 11.7% from the prior year. HUM has surpassed its consensus EPS estimates in each of the trailing four quarters.

The stock has gained 31% over the past year to close its last trading session at $549.90. HUM has a 24-month beta of 0.57.

It’s no surprise that HUM has an overall A rating, which translates to Strong Buy in our POWR Ratings system.

HUM has a B grade for Growth, Value, and Quality. It is ranked #4 out of the 11 stocks in the A-rated Medical – Health Insurance industry.

In addition to the POWR Rating grades we’ve stated above, one can see HUM ratings for Momentum, Sentiment, and Stability here.

Weis Markets, Inc. (WMK)

WMK is a food retailer that engages in the retail sale of food through a chain of supermarkets. The company operates primarily under the Weis Markets name and Weis, Weis Great Meals Start Here, Weis Gas-n-Go, and Weis Nutri-Facts brands.

On October 27, WMK declared its quarterly dividend of $0.34 per share, indicating a 6.3% increase in the quarterly cash dividend, which was payable on November 21, 2022.

The company pays $1.36 annually as a dividend, representing a yield of 1.56% at the current prices. Its dividend payouts have grown at a 1.6% CAGR over the past three years. The company has been raising its dividends for the past two years and has a record of 33 consecutive years of dividend payments.

WMK’s net sales increased 8.5% year-over-year to $1.15 billion in the fiscal third quarter ended September 24, 2022. The company’s net income rose marginally from its prior-year quarter to $28.66 million. Also, its earnings per share came in at $1.07, compared to $1.06 in the previous-year quarter.

The stock has gained 38.5% over the past year, closing the last trading session at $87.21. It has a 24-month beta of 0.38.

WMK’s fundamental strength and strong outlook are reflected in its POWR Ratings. The stock has an overall rating of A, which translates to a Strong Buy in our proprietary rating system.

WMK has a grade of A for Stability and Quality. It is ranked #13 of 39 stocks in the A-rated Grocery/Big Box Retailers industry.

Click here to see additional POWR Ratings for Growth, Value, Sentiment, and Momentum for WMK.


PEP shares fell $1.12 (-0.60%) in premarket trading Thursday. Year-to-date, PEP has gained 8.29%, versus a -13.03% rise in the benchmark S&P 500 index during the same period.


About the Author: Kritika Sarmah

Her interest in risky instruments and passion for writing made Kritika an analyst and financial journalist. She earned her bachelor’s degree in commerce and is currently pursuing the CFA program. With her fundamental approach, she aims to help investors identify untapped investment opportunities.

More…

The post 3 Stocks That Can Help Ease Your Recession Fears appeared first on StockNews.com

https://www.entrepreneur.com/article/440227



When Will the Bear Market Roar Again?

Many signs are pointing to the recent bear market rally running out of steam. Thus, investors are watching closely for signs of the next catalyst to send stocks lower once again. 40 year investment veteran Steve Reitmeister lines up the events on the upcoming economic calendar that could indeed spark the next big sell off. This comes hand in hand with a “Bear Market Game Plan” with 9 trades to profit as the stock market (SPY) heads lower.

shutterstock.com – StockNews

You could tell the market was oversold back as we were making fresh lows in mid October. So no surprise a bounce was soon to follow.

That rally has been distorted and overextended by investors not understanding basic economics. That being inflation coming down from 8% to 7.7% is not even close to the Fed target of 2%. Thus, their work to rein in inflation, and l likely harm the economy, is far from over.

Now stocks are consolidating under resistance at 4,000 for the S&P 500 (SPY) awaiting the next catalyst. What will it be and what happens next?

That will be the focus of this week’s Reitmeister Total Return commentary.

Market Commentary

Last week I noted that the bullish bias of holiday weeks was an optical illusion. So don’t fall for the seeming bullish signal of crossing above 4,000.

Indeed it didn’t take long for the turkey hangover to kick in as stocks got busy to the downside on Monday with a -1.54% session closing at 3,963.94. And then went a few ticks lower on Tuesday.

The long term outlook is decidedly bearish for a multitude of reasons stated in my recent commentaries. In fact, the vast majority of investors now see the formation of a recession coming in the first half of 2023 which should lead to further stock downside.

The interesting question is what will it take to kick that next downward leg into motion?

Since it was a false understanding of October inflation reports that sparked the recent rally…then likely it is the removal of that catalyst to get stocks retesting the October low of 3,491 in earnest.

That catalyst could occur as early as Wednesday or Thursday of this week with the release of PCE Core Prices and PCE Core Index respectively. These are considered the Feds favorite measures of inflation and could have marketing moving impact.

Or perhaps it could be further evidence of economic decay being displayed in the following roll call of economic reports:

12/1 ISM Manufacturing

12/2 Government Employment Situation

12/5 ISM Services

After that will be a brief pause until we consider this next slate of news:

12/9 Producer Price Index (PPI)

12/12 Consumer Price Index (CPI)

12/13 Fed Interest Rate Decision

For as strongly as I believe in the extension of the bear market into 2023, I have to admit that anything is possible. Especially true with energy prices coming down of late. That can often have far reaching dis-inflationary benefits increasing the odds of a soft landing.

Don’t get me wrong…most signs point bearish. And nothing about the recent rally is out of the ordinary for long term bear market cycles. However, when most investors gang up on one side of the market see-saw it can often lead to surprising action in the other direction.

It is from that counterintuitive notion that comes one of the most oft used investment sayings:

“The market climbs a wall of worry and slides down the slope of hope”.

Meaning that the stock market often does the opposite of what you expect. So it is a call to keep watching each new clue as it comes out and to stay nimble in your trading plan to account for these fresh inputs.

Long story short, the smart money still rides on recession and deeper bear market in early 2023. The 8 key economic events coming between now and mid December noted above will likely hold the clues for what happens next.

As always I will keep vigilant watch for these events and make any necessary changes in our portfolio. Until then most evidence currently in hands still points to recession in 2023 with bear market bottom closer to 3,000.

What To Do Next?

Discover my special portfolio with 9 simple trades to help you generate gains as the market descends further into bear market territory.

This plan has been working wonders since it went into place mid August generating a robust gain for investors as the market tanked.

And now is great time to load back as we deal with yet another bear market rally before stocks hit even lower lows in the weeks and months ahead.

If you have been successful navigating the investment waters in 2022, then please feel free to ignore.

However, if the bearish argument shared above does make you curious as to what happens next…then do consider getting my updated “Bear Market Game Plan” that includes specifics on the 9 unique positions in my timely and profitable portfolio.

Click Here to Learn More >

Wishing you a world of investment success!


Steve Reitmeister…but everyone calls me Reity (pronounced “Righty”)
CEO, Stock News Network and Editor, Reitmeister Total Return


SPY shares . Year-to-date, SPY has declined -15.82%, versus a % rise in the benchmark S&P 500 index during the same period.


About the Author: Steve Reitmeister

Steve is better known to the StockNews audience as “Reity”. Not only is he the CEO of the firm, but he also shares his 40 years of investment experience in the Reitmeister Total Return portfolio. Learn more about Reity’s background, along with links to his most recent articles and stock picks.

More…

The post When Will the Bear Market Roar Again? appeared first on StockNews.com

https://www.entrepreneur.com/article/440099


How To Lower Your Risk With A Conservative Covered Call Approach On 3 Strong Buy Dividend-Paying ETFs

Selling covered calls on conservative dividend paying ETFs can lower your risk but still provide real returns for astute investors and traders.

shutterstock.com – StockNews

The recent drop in 10-year Treasury yields back well below the 4% level has made dividend paying stocks comparatively more attractive once again. The fact the Fed is nearer the end than the beginning of the recent rate hikes makes higher yield stocks a solid choice over the coming months.

Rather than trying to pick individual stocks, buying a higher yielding ETF can be a safer and saner approach. Here are three A rated – Strong Buy- Dividend funds to consider purchasing along with a covered call to consider selling.

  • Vanguard High Dividend Yield ETF (VYM)
  • SPDR Dividend ETF (SDY)
  • iShares Select Dividend ETF (DVY)

These three ETFs all have below market risk (lower than 1.00 beta) and below market valuations on both Price to Earnings (P/E) and Price to Sales (P/S) basis. They each carry a bigger dividend yield than the S&P 500 as well. So generally, a safer choice than the overall market. A quick comparison of the three dividend ETFs versus the S&P 500 is shown below.

Plus selling a covered call against the dividend ETF can further reduce the risk and generate potentially higher returns.

Each of the three higher yielding ETFs has different components that comprise the overall basket of stocks. Notice how oil giant Exxon Mobil (XOM) is a big part of all three ETFS but has a slightly different weighting and ranking within each fund.

Let’s take a quick walk through the three.

VYM (Vanguard High Dividend Yield ETF)

VYM has a Price to Earnings (P/E) ratio of just over 14 (14.09) and Price to Sales (P/S) ratio just north of 2 (2.06). Both are at a discount to the similar metrics for the S&P 500 of 18.43 for P/E and 2.96 (P/S). The beta for the VYM is 0.85 so a lower risk than the overall market. It sports a yield of 3.02%, well above the S&P 500 yield of just 1.64%. It ranks number 3 in the Large Cap Value ETF category.

The top 10 holdings in VYM account for over 23% of the total assets. J.P. Morgan (JPM) and Johnson and Johnson (JNJ) hold the two top spots.

Selling the July $116 call against the underlying purchase of VYM can reduce the net cost by about $5.00 (over 4%) while still leaving an upside appreciation of roughly 3% open to the short strike of $116. Plus you still get over 3% dividend as long as VYM stays below $116.

SDY (SPDR S&P Dividend ETF)

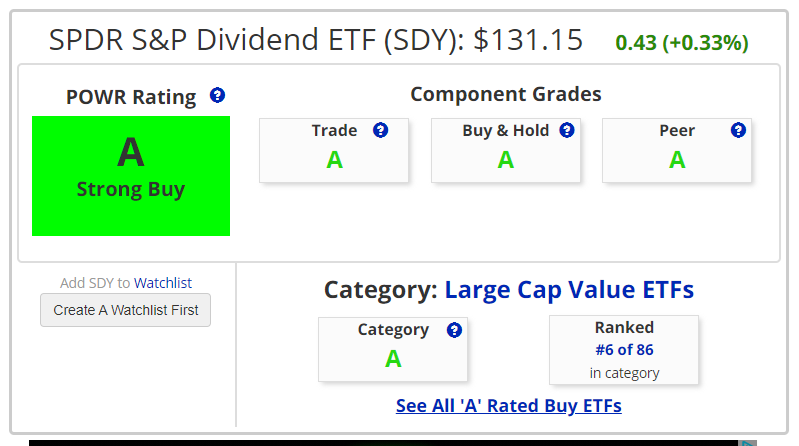
It checks in at number 6 in the Large Cap Value ETFs.

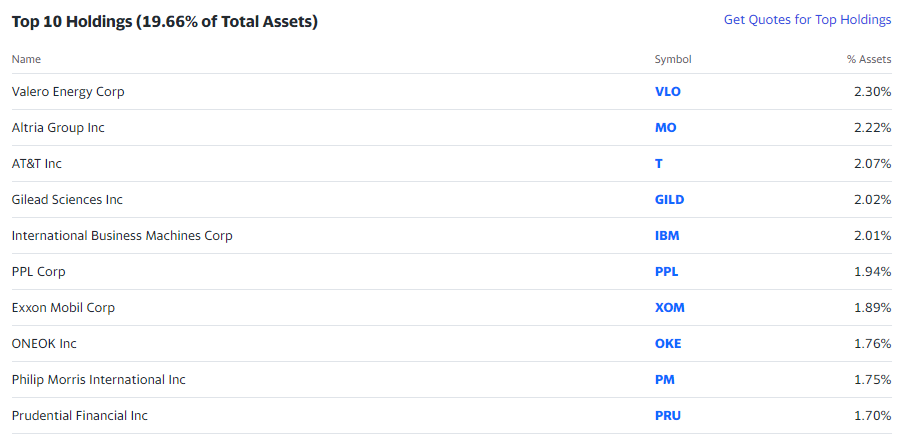
The biggest 10 holdings in SDY make-up just over 20% of the overall ETF. ExxonMobil (XOM) and AT&T (T) are the top two.

Selling the July $137 call against the underlying purchase of SDY can reduce the net cost by about $5.00 (just under 4%) while still leaving an upside appreciation of over 4% open to the short strike of $137. Plus you still get over 2.5% dividend as long as SDY stays below $137.

DVY (iShares Select Dividend ETF)

DVY holds the number 8 spot in the Large Cap Value ETF category.

The Top 10 holdings for DVY are shown below. They are just less than 20% of the overall assets. Valero (VLO) and Altria (MO) grab the highest weightings.

Selling the June $130 call against the underlying purchase of DVY can reduce the net cost by about $4.20 (well over 3%) while still leaving an upside appreciation of about 4% open to the short strike of $130. Plus you still get over 3.3% dividend as long as DVY stays below $130.

After the recent red-hot run up in stocks, many traders and investors are looking to lower risk and still retain return. Taking a more conservative covered call approach on quality higher-yielding, lower beta ETFs is certainly a solid way to play in a saner way.

POWR Options

What To Do Next?

If you’re looking for the best options trades for today’s market, you should check out our latest presentation How to Trade Options with the POWR Ratings. Here we show you how to consistently find the top options trades, while minimizing risk.

If that appeals to you, and you want to learn more about this powerful new options strategy, then click below to get access to this timely investment presentation now:

How to Trade Options with the POWR Ratings

All the Best!

Tim Biggam

Editor, POWR Options Newsletter


SPY shares closed at $402.33 on Friday, down $-0.09 (-0.02%). Year-to-date, SPY has declined -14.31%, versus a % rise in the benchmark S&P 500 index during the same period.


About the Author: Tim Biggam

Tim spent 13 years as Chief Options Strategist at Man Securities in Chicago, 4 years as Lead Options Strategist at ThinkorSwim and 3 years as a Market Maker for First Options in Chicago. He makes regular appearances on Bloomberg TV and is a weekly contributor to the TD Ameritrade Network “Morning Trade Live”. His overriding passion is to make the complex world of options more understandable and therefore more useful to the everyday trader. Tim is the editor of the POWR Options newsletter. Learn more about Tim’s background, along with links to his most recent articles.

More…

The post How To Lower Your Risk With A Conservative Covered Call Approach On 3 Strong Buy Dividend-Paying ETFs appeared first on StockNews.com

https://www.entrepreneur.com/article/439924


What is “Active Investing”?

Long term investing is not an easy path to top the stock market (SPY). On the other hand most active trading approaches miss some key elements that lead to outperformance. So let’s talk about a best of both worlds approach called “Active Investing”. Read on below for more.

shutterstock.com – StockNews

The world is moving faster by the day.

Not just technological change…but the speed in which industry peers find ways to beat their competitors. This makes buy and hold investing more difficult than ever as stocks that once looked fundamentally promising can sour quickly and become a drain on your portfolio.

This calls out for each of us to consider the virtues of “Active Investing” which leads you to closely and continuously purge weak stocks at the earliest possible stage to avoid undue harm.

Note that I am drawing a clear distinction between “Active Investing” and “Active Trading”. Meaning this is not a call to becoming a day trader…or slave to the market guzzling Red Bull all day long while watching 8 computer monitors.

Rather it is about proactively making sure that you stay in the healthiest stocks to give yourself the best chance to outperform. That’s because at the end of the day fundamentals are what truly drives stock prices.

Why?

Because we are actually buying an ownership stake in a company (not just random stats or a chart pattern on a screen…but a real living/breathing entity with a clearly definable value).

My goal for this article is two-fold.

First, to convince you that it is in your financial best interest to become a more active investor.

Second, to give you free access to a set of tools that provides a fountain of profitable picks for active investors.

The Importance of Timeliness

Some investors are more focused on preserving capital. While most have their eyes set on outperforming the market.

The only way to accomplish the latter task is to have timely stocks. The ones ready to rise now.

The #1 ingredient of timely stocks is improving fundamentals. That’s because the attractiveness of that healthier growth profiles is what leads investors to bid up shares.

On the surface this sounds like an overwhelming task as there are literally thousands of fundamental factors to consider.

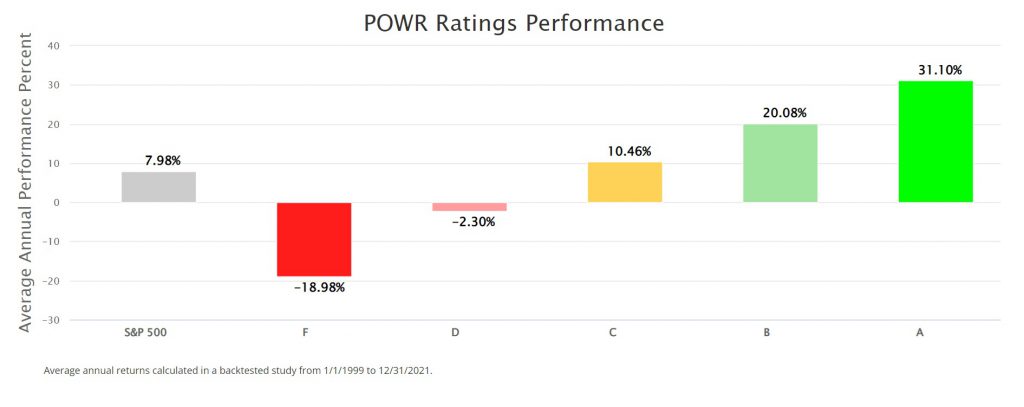
Gladly, members of StockNews already know that the POWR Ratings gives them a leg up in this journey. That’s because this proven stock rating model narrows down to 118 unique factors that have historically pointed to stocks likely to outpace the market.

These impressive gains come from the computers doing the heavy lifting crunching these numbers daily in order to make our lives easier. But there is still 1 more problem to solve…

1,300 Buy Rated Stocks is Too Many

The POWR Ratings does a phenomenal job scanning over 5,300 stocks to narrow down to the top 25% ready to outperform (A & B rated).

However, that is still a whopping 1,300 stocks to consider on any given day.

No matter how much you love picking stocks…reviewing 1,300 is still a daunting and unwelcome task.

It is for this reason that we created several unique portfolio recommendation services to narrow down to the very best stocks.

In fact, right now we only have 41 total active recommendations across our popular portfolio trading services:

  • Reitmeister Total Return
  • POWR Growth
  • POWR Stocks Under $10
  • POWR Trends
  • POWR Value
  • POWR Breakouts
  • POWR Options

Even better, 34 of those 41 trades are winners…not easy to do with so much market volatility.

However, it does make clear the benefit of the POWR Ratings system in the hands of veteran investors who manage these newsletter portfolios for the benefit of our customers.

What to Do Next?

Remember what I said about the goal of this article up top:

“…give you free access to a set of tools that provides a fountain of profitable picks for active investors.”

And that is exactly what we will do now.

Look again at the above list of seven market topping newsletter portfolio services. The bundle of all those newsletters is what we call POWR Platinum.

Now you can enjoy a free 7 day test drive of POWR Platinum to see all of these services including the ability to see all 41 of our top trade ideas.

All you have to do is click the link below to get started:

7 Day Free Trial to POWR Platinum to See All 41 Trades >

p.s. Please note that this offer is only available until Sunday November 27th @ midnight.

Wishing you a world of investment success!


Steve Reitmeister…but everyone calls me Reity (pronounced “Righty”)
CEO, Stock News Network and Editor, Reitmeister Total Return


SPY shares were trading at $402.27 per share on Friday afternoon, down $0.15 (-0.04%). Year-to-date, SPY has declined -14.32%, versus a % rise in the benchmark S&P 500 index during the same period.


About the Author: Steve Reitmeister

Steve is better known to the StockNews audience as “Reity”. Not only is he the CEO of the firm, but he also shares his 40 years of investment experience in the Reitmeister Total Return portfolio. Learn more about Reity’s background, along with links to his most recent articles and stock picks.

More…

The post What is “Active Investing”? appeared first on StockNews.com

https://www.entrepreneur.com/article/439907


9 Trades to Tame the Bear Market

More economists are pointing out the recessionary storm clouds that do not portend well for stock prices. Gladly the stock market (SPY) offers the opportunity to make profits no matter of direction…if you apply the right strategies. This article will give more details on the market outlook along with a trading strategy with 9 picks to come out on the right side of the action. Read on below for more….

shutterstock.com – StockNews

Let me jump to the vital conclusion of this week’s commentary.

Not only do I believe we have a much steeper bear market in front of us, but I have hand selected 9 trades to set you up for gains as the market tumbles to new lows.

More on that a little later. First, it’s important that you appreciate the gathering storm clouds for recession in the next 12 months and why stocks will soon tumble much lower…

Earlier this week I put forward my most consequential commentary to help explain why a recession and steeper bear market are on the way. In fact, I shed light on why the Fed very much wants, and even needs, this to happen.

Yes, that sounds pretty conspiratorial on the surface. However, I think as you read through it the verity of the case will emerge quite easily.

I will share the link below in case you have not read it yet as it forms a good back drop for what we discuss next:

The Fed WANTS a Bear Market & Recession

One of the key points in there is about the Feds array of tools to help reign in demand to bring down inflation. The least talked about, and yet still powerful tool, is the idea of “talking down the market”.

Here is the key section from the article on that topic:

“So “talking down the market” is about creating a pessimistic atmosphere that leads to lower demand. That can best be understood by appreciating that the people who own the most stocks are also the wealthiest people in the country who spend the most as consumers. Those very same people are also the captains of industry who control corporate purse strings.

With that in mind now consider this chain reaction:

More Bearish on Stock Market > More Pessimistic Economic Outlook > Less Spending (consumer and business) > Lower Demand > Lower Inflation

Once again it seems that I am going the conspiratorial route with this conversation. But do consider the STERN comments made by Fed officials every time we have had a spike in stock prices over the last few months. This is the very essence of talking down the markets.”

With that backdrop in place consider the speech made by Fed Governor Bullard Thursday morning that got stocks heading lower in a hurry. Here is a link to a more complete article on what he discussed. And here is what I believe to be the key eye-opening comment:

“However, Bullard’s presentation argued that 5% could serve as the low range for the where the funds rate needs to be, and that upper bound could be closer to 7%. That is well out of sync with current market pricing, which also sees the fed funds rate topping out around 5% by mid-2023.”

Let me reframe this vital conversation.

Many traders thought that the potential signs of peaking inflation found in the CPI report this month was good cause to start the next bull market. This had them believing that the previously understood 5% level for Fed Funds rate was never going to be achieved because not necessary.

Not only is Bullard saying that 5% is still in play. Rather, it is at the low end of the range of what is needed to corral inflation with 7% a real possibility. That level of hawkishness is comes hand in hand with a recession.

Let me assure you that the leaders of the early November rally up to 4,000 did not appreciate this vital fact. Heck, even the bears pushing stocks down to 3,491 in early October did not appreciate this possibility which now doubt will have detrimental effects on the economy and stock market by extension.

Once again, the recession and bear market thesis is still in full swing with lower lows on the way this year. That is why a recent Wall Street Journal survey showed that market experts now have a 65% expectation of a recession coming within the next 12 months.

Note that the average recession and bear market came with only a 40% expectation of that negative outcome. So, this shows you a very marked increase in negativity of what the future holds for investors.

For these reasons, and many more, I still believe that the 2,800 to 3,200 is the basic range of this bear market’s bottom for the S&P 500 (SPY). And if you stuck a gun to my head to pick the precise level I would say a little under 3,000 would probably be the proper cause for panic and capitulation that should mark the true and lasting bottom.

However, we are getting way ahead of ourselves as that is like happening 3-6 months from now.

Simply stated, you should expect more stock market downside in the weeks and months ahead. Thus, best to prepare your portfolio accordingly to not just survive…but thrive in that market environment.

What To Do Next?

Discover my special portfolio with 9 simple trades to help you generate gains as the market descends further into bear market territory.

This plan has been working wonders since it went into place mid August generating a robust gain for investors as the market tanked.

And now is great time to load back as we deal with yet another bear market rally before stocks hit even lower lows in the weeks and months ahead.

If you have been successful navigating the investment waters in 2022, then please feel free to ignore.

However, if the bearish argument shared above does make you curious as to what happens next…then do consider getting my updated “Bear Market Game Plan” that includes specifics on the 9 unique positions in my timely and profitable portfolio.

Click Here to Learn More >

Wishing you a world of investment success!


Steve Reitmeister…but everyone calls me Reity (pronounced “Righty”)
CEO, Stock News Network and Editor, Reitmeister Total Return


SPY shares were unchanged in after-hours trading Friday. Year-to-date, SPY has declined -15.65%, versus a % rise in the benchmark S&P 500 index during the same period.


About the Author: Steve Reitmeister

Steve is better known to the StockNews audience as “Reity”. Not only is he the CEO of the firm, but he also shares his 40 years of investment experience in the Reitmeister Total Return portfolio. Learn more about Reity’s background, along with links to his most recent articles and stock picks.

More…

The post 9 Trades to Tame the Bear Market appeared first on StockNews.com

https://www.entrepreneur.com/article/439533


How to Take Advantage of Opportunities Created by This Bear Market

Bear markets can be brutal and messy. They often don’t end until testing the resolve of investors. And even for bears, they aren’t easy affairs as evidenced by the stock market’s 7% pop following a soft CPI report. They also are necessary and healthy as they cleanse the financial system and economy of fraud and bad actors as we are seeing with the FTX blowup. In terms of the economy, certain parts of the economy are under pressure, but there’s nothing rotten systemically or signs of excess leverage which would cause a cascade lower like 2008. In today’s commentary, I want to talk about the inflation report and put it in context within today’s stock market (SPY). Then, I want to touch on the various blowups that we’ve seen during the bear market and my gameplan for taking advantage of the opportunities created amid the wreckage. Read on below to find out more….

shutterstock.com – StockNews

(Please enjoy this updated version of my weekly commentary published November 15th, 2022 from the POWR Growth newsletter).

As usual, we will start by reviewing the past week…

Here is an hourly, 3-week chart of the S&P 500 (SPY):

Over the last week, the S&P 500 is up by just under 7% with the major catalyst being a softer-than-expected CPI report.

Inflation Report

[This section is from the POWR Stocks Under $10 commentary but modified to make it more appropriate for growth stocks.]

It should be obvious to anyone why falling inflation is a big deal and bullish for asset prices as it basically would mean that a massive market headwind turns into a tailwind.

Falling inflation, on its own, would bring relief to consumers and lead to margin expansion for companies. In addition, it would result in rates turning lower which would also boost the housing market and reduce borrowing costs for corporations.

Not to mention that falling rates would automatically boost growth stocks… even if the economic outlook deteriorates.

In essence, it would reverse a lot of the market pain.

And that was evident in Thursday’s action which saw leadership from both homebuilding stocks and speculative tech stocks as both groups have been hammered by rising rates even though these sectors have little connection to each other on a fundamental basis.

Thus, it makes sense that if rates are going to reverse and turn lower, these are the groups that will outperform on the upside.

In hindsight, it’s quite possible that inflation peaked this summer and is now plateauing or rolling over. And, it’s possible that the stock market successfully sniffed this out as it bottomed along with the high reading in the CPI.

Then, these lows were re-tested and undercut in October with a lower high for the CPI but a higher high for core CPI, before once again recovering higher the last couple of weeks.

Going into the CPI report, I was of mixed opinion about the number but leaning bearish on the market due to a hawkish Fed and a slowing economy. The inflation reading neuters the former factor at least for the short term.

This is evident with the big decline in yields, and it would take higher highs in inflation to get new highs in yields.

In fact, it’s possible that we have seen the cycle high in yields, especially if the economy starts to seriously slow.

This means the bearish case rests on seeing a contraction in earnings which causes another leg lower in stock prices.

And on a longer-term basis, the path that inflation takes will now be the major focus of Fed policy and be the main factor in determining whether we are in the end stages or middle stages of the bear market.

Bear Market Blowups + Gameplan

The bear market for the overall market (SPY) began in January 2022 but the bear market for tech and specifically high-multiple, speculative, and crypto began in early 2021.

Over the course of many months, we have seen all the leveraged players in the crypto space blow up, while many prominent startups have been unable to get funding or have seen their valuations dramatically diminish.

In terms of public markets, there are so many carcasses like Carvana, ARK, Peloton, Teladoc, Zoom, etc. Many of these companies continue to lose money and have no viable path to profitability or positive cash flow.

They simply had the fortune to raise money at inflated valuations which is giving them a long runway.

This happens in every bear market as we see fraud and rot taken out of the system, setting the stage for the next bull market. The negative price action leads to bearish sentiment and very favorable valuations.

For example, after the 2008 Great Recession, there was a great chance to buy innovative and game-changing stocks like Apple, Amazon, Netflix, Green Mountain Coffee, etc., at attractive valuations.

My ultimate gameplan is to take advantage of these opportunities and maximize our capital to be aggressive when the time is right. Of course, we’ve accomplished the first step of the plan by avoiding these blowups in the first place which have destroyed so many portfolios.

What To Do Next?

The POWR Growth portfolio was launched in April last year and since then has greatly outperformed just about every comparable index…including the S&P 500, Russell 2000 and Cathie Wood’s Ark Innovation ETF.

What is the secret to success?

The portfolio gets most of its fresh picks from the Top 10 Growth Stocks strategy which has stellar +49.10% annual returns. I then take the very best stocks from this strategy and tell you exactly what to buy & when to sell, so you can maximize your gains.

If you would like to see the current portfolio of growth stocks, and be alerted to our next timely trades, then consider starting a 30 day trial by clicking the link below.

About POWR Growth newsletter & 30 Day Trial

All the Best!

Jaimini Desai
Chief Growth Strategist, StockNews
Editor, POWR Growth Newsletter


SPY shares . Year-to-date, SPY has declined -15.13%, versus a % rise in the benchmark S&P 500 index during the same period.


About the Author: Jaimini Desai

Jaimini Desai has been a financial writer and reporter for nearly a decade. His goal is to help readers identify risks and opportunities in the markets. He is the Chief Growth Strategist for StockNews.com and the editor of the POWR Growth and POWR Stocks Under $10 newsletters. Learn more about Jaimini’s background, along with links to his most recent articles.

More…

The post How to Take Advantage of Opportunities Created by This Bear Market appeared first on StockNews.com

https://www.entrepreneur.com/article/439250


The Fed WANTS a Bear Market & Recession

The stock market (SPY) rally since Thursday’s better than expected CPI report has been impressive. And on the surface, it only seems to be bolstered by Tuesdays PPI report. Unfortunately, that would be missing the forest for the trees. Let’s take a much deeper dive into why the Fed needs to fight inflation. And the tools at their disposal to do so. And why the sum total of that still equates to recession and bear market. Meaning this is yet another sucker’s rally before the bear market mauls stock prices even lower. This commentary will explain why and how to keep your portfolio on track.

shutterstock.com – StockNews

Today I want to discuss some fresh ideas to explain the Fed’s inflation fight to clarify why things are still quite bearish. Those topics include:

  • Stated Reasons Why the Fed Wants Lower Inflation
  • Ulterior Motive for Wanting Lower Inflation
  • Fed Tools to Fight Inflation
  • Fed WANTS Bear Market

I know bullets 2 and 4 are kind of head scratchers on the surface. That’s why I explain it in full in the sections that follow…

Why Does the Fed Want to Fight Inflation?

Inflation is an economic disease that once “entrenched” leads to lower growth. Yes, that word “entrenched” keeps coming up in Fed speeches to point out that the longer inflation stays high…the more it becomes expected by everyone…the more it sticks arounds…the more it harms the economy.

But, how does high inflation hurt the economy?

The following equation showing the important connections and correlations is the quickest way to spell it out:

Higher Rates > Less Borrowing > Less Investment in Future Growth > Less Long Term Employment > Less Spending > Slower Economic Growth

This benefit to the economy is the STATED reason why the Fed wants to fight inflation. Now let’s consider…

The Fed’s Ulterior Motive to Lower Inflation

Yes, I understand how conspiratorial that sounds on the surface. But when I spell it out you will appreciate why the Fed cannot publicly talk about this issue as it may create an untimely panic.

It should be a shock to no one that the US government has too much debt. Amazingly we keep piling on more debt without creating a crisis. One thing that has certainly helped in adding more debt is historically low borrowing rates over the past 12 years.

So the ulterior motive of the Fed to fight inflation is to avoid any risk of a Government debt crisis. That because higher inflation begets higher interest rates for government bonds which only puts more stress on the nation’s financial stability.

On top of that consider the massive entitlement programs like Social Security, Medicare and Government employee pension plans also would buckle under the pressure of much higher costs due to long term inflation. This is money we simply do not have with a tremendous increase in taxes which would only further harm the economy.

It should be clear that reigning in inflation to subdue these issues would be pretty high on the Fed’s reasons to lower inflation. And the reason they can’t talk about this issue publicly is that the mere mention of their concern could well spark a debt crisis as investors may rush out of the bonds only for rates to spike further.

Just because they are not saying this concern out loud doesn’t make it any less true.

What Tools Does the Fed Have to Lower Inflation?

The main goal of the Fed right now is to lower demand to bring down prices. This really goes back to Econ 101 to appreciate how supply and demand work together to beget prices.

Remember that this recent bout of inflation was caused by supply chain issues which limited supply. That plus firm demand = higher prices.

Increasing supply is not really in the Fed’s toolbox. So they have a better chance of lowering demand to bring down prices and thus tamp down the flames of inflation.

Now let’s talk about how the Fed can lower demand. First and most obvious is their desire to raise rates which makes borrowing more expensive which limits spending and investments in future growth (as shared earlier in the commentary).

We all know that they have raised rates 6 times this past year. Truly the fastest and most aggressive rate hike regime ever. Most signs point to them not being done, but may indeed slow down the pace of rate hikes to 25 or 50 basis points instead of the recent slate of 75.

The second and less talked about approach is Quantitative Tightening (QT). This is the opposite of Quantitative Easing (QE) which was a long term program of the Fed to buy up $9 trillion worth of bonds on the open market and keep them on their balance sheet.

QE was invented to help lower rates to get the economy back on track after catastrophes like the Great Recession and Covid crisis. Thus, QT is meant to do the opposite.

That being when the Fed sells $90 billion of bonds a month back to the open market it increases supply of bonds, which with equal demand begets lower prices and higher rates on those bonds. Like I said earlier…

Higher Rates > Less Borrowing > Less Investment in Future Growth > Less Long Term Employment > Less Spending > Slower Economic Growth

The final tool in the Fed’s arsenal is the idea of “talking down the market”. Meaning to use their statements and speeches to help curb demand. This is a subtle yet effective approach where I tell you with all sincerity that the Fed WANTS to create a recession and bear market.

Let me take a step back to take the next step forward in our conversation.

Earlier I said the Fed wants to bring down inflation. But when you consider the long term risk of a debt crisis, then they actually NEED to bring down inflation (and interest rates by extension).

So “talking down the market” is about creating a pessimistic atmosphere that leads to lower demand. That can best be understood by appreciating that the people who own the most stocks are also the wealthiest people in the country who spend the most as consumers. Those very same people are also the captains of industry who control corporate purse strings.

With that in mind now consider this chain reaction:

More Bearish on Stock Market > More Pessimistic Economic Outlook > Less Spending (consumer and business) > Lower Demand > Lower Inflation

Once again it seems that I am going the conspiratorial route with this conversation. But do consider the STERN comments made by Fed officials every time we have had a spike in stock prices over the last few months. This is the very essence of talking down the markets:

8/26/22 Chairman Powell’s Jackson Hole speech about long term inflation battle and to expect “economic pain”. This speech single handedly put a nail in the coffin of the 18% summer rally that took stocks up to 4,300. Next stop on the tour was hitting new lows under 3,500. That is the text book definition of “talking down the market”.

11/2/22 Chairman Powell’s speech to accompany the most recent 75 basis point rate hike. He reiterated many of the key points made in the Jackson Hole speech about this being a long term battle to lower inflation. The key statement being the ability to generate a soft landing has greatly diminished. This also had stocks tumbling lower.

11/13/22 Fed Governor Waller speaking at a UBS conference to combat the false ideas investors had about the recent CPI report. Here are the key quotes from that speech:

“The market seems to have gotten way out in front over this one CPI report. Everybody should just take a deep breath, calm down. We’re going to see a continued run of this kind of behavior and inflation slowly starting to come down, before we really start thinking about taking our foot off the brakes here. We’ve got a long, long way to go…Rates are going to keep going up and they are going to stay high for a while until we see this inflation get down closer to our target (2%…not 7.7%).”

No doubt there will be more Fed statements in coming weeks to further talk down the market as investors are getting a bit too giddy. Interestingly, since the misunderstood CPI report created the most recent rally it was also accompanied by a spike in commodity prices which is inflationary.

Meaning that the Fed is still on a long term course to keep raising rates + QT + talking down the market to move CPI much lower. NOT from 8% to 7.7%. Remember they want to make it all the way down to 2%.

In conclusion, short sighted traders have misunderstood the battle lines drawn in front of them and falsely bid up stock prices. Truly NOTHING has changed in the economic picture that stops the looming recession invented and fully supported by the Fed.

Once the Pandora’s Box known as recession comes on the scene it will start to take on a life of its own outside of the Fed’s control. Meaning we don’t know how bad employment will get and how steep will be the cuts to the corporate earnings outlook. This goes hand in hand with what is fair valuation to pay for those lower earnings.

When we have a better view of the bottom of that recessionary well is when stocks will find bottom for stock prices and investors can start preparing for the next bull market. That likely unfolds 3-6 months from now.

This means our bearish thesis and game plan are still VERY MUCH still in effect. We just need to patiently wade through another in a long line of ill fated rallies before the bear mauls prices to new lows.

Not just the 3,500 level for the S&P 500 found in October. But likely somewhere between 2,800 and 3,200 is where true and lasting bottom will be found. Again, I suspect that occurs 3-6 months from now. I hope you have the patience to see the plan through for the betterment of your portfolio.

Gladly all bear markets end and I very much look forward getting back to bullish times later in 2023. Until then hold firm to the bearish view as that is what will pay the bills in coming weeks and months.

What To Do Next?

Discover my special portfolio with 9 simple trades to help you generate gains as the market descends further into bear market territory.

This plan has been working wonders since it went into place mid August generating a robust gain for investors as the market tanked.

And now is great time to load back as we deal with yet another bear market rally before stocks hit even lower lows in the weeks and months ahead.

If you have been successful navigating the investment waters in 2022, then please feel free to ignore.

However, if the bearish argument shared above does make you curious as to what happens next…then do consider getting my updated “Bear Market Game Plan” that includes specifics on the 9 unique positions in my timely and profitable portfolio.

Click Here to Learn More >

Wishing you a world of investment success!


Steve Reitmeister…but everyone calls me Reity (pronounced “Righty”)
CEO, Stock News Network and Editor, Reitmeister Total Return


SPY shares fell $0.65 (-0.16%) in after-hours trading Tuesday. Year-to-date, SPY has declined -15.13%, versus a % rise in the benchmark S&P 500 index during the same period.


About the Author: Steve Reitmeister

Steve is better known to the StockNews audience as “Reity”. Not only is he the CEO of the firm, but he also shares his 40 years of investment experience in the Reitmeister Total Return portfolio. Learn more about Reity’s background, along with links to his most recent articles and stock picks.

More…

The post The Fed WANTS a Bear Market & Recession appeared first on StockNews.com

https://www.entrepreneur.com/article/439249


Inflation…How Low Can You Go?

The October CPI came in below expectations and fueled an explosive rally on Wall Street with the S&P 500 (SPY) up by more than 4% and bonds also shooting higher. In essence, the odds of a soft landing increase if inflation can turn lower and then keep moving lower. This development would also likely cause the Fed to slow its pace of hikes. Of course, the next big question, assuming that inflation has peaked, is how low will it fall? Will it plateau at higher levels or will it fall back to the 2% range? Today’s commentary will explore these questions and the implications for our portfolio. Read on below to find out more….

shutterstock.com – StockNews

(Please enjoy this updated version of my weekly commentary originally published November 11th, 2022 in the POWR Stocks Under $10 newsletter).

Over the last week, the S&P 500 (SPY) is up by 6.4%. Following the FOMC, stocks were pretty choppy before roaring higher following the softer than expected CPI report.

It should be obvious to anyone why falling inflation is a big deal as it basically would mean that a massive market headwind turns into a tailwind.

Falling inflation, on its own, would bring relief to consumers and lead to margin expansion for companies.

In addition, it would result in rates turning lower which would also boost the housing market and reduce borrowing costs for corporations.

In essence, it would reverse a lot of the market pain. And that was evident in today’s action which saw leadership from both homebuilding stocks and speculative tech stocks as both groups have been hammered by rising rates.

Thus, it makes sense that if rates are going to reverse and turn lower, these are the groups that will outperform on the upside.

Inflation’s Path + Earnings

In hindsight, it’s looking like inflation peaked this summer. And, it’s possible that the stock market successfully sniffed this out as it bottomed along with the high reading in the CPI.

Then, these lows were re-tested and undercut in October with a lower high for the CPI but a higher high for core CPI, before once again recovering higher the last couple of weeks.

Going into the CPI report, I was of mixed opinion about the number but leaning bearish on the market due to a hawkish Fed and slowing economy.

The inflation reading neuters the former factor at least for the short-term. This is evident with the big decline in yields, and it would take higher highs in inflation to get new highs in yields.

In fact, I’m confident that we have seen the cycle high in yields.

This means the bearish case rests on seeing a contraction in earnings which causes another leg lower in stock prices.

And on a longer-term basis, the path that inflation takes will determine Fed policy and whether we are in the end stages or middle stages of the bear market.

Portfolio Implications

We moved to a neutral stance prior to the FOMC. And ironically we are back to those levels at today’s close.

Even with a higher than average cash allocation, our portfolio was up more than 3%, and we had numerous stocks that were up between 5 and 9%. YTD, the portfolio is down 5%, while the broader stock market (SPY) is down by 15% with an even deeper drawdown for the Russell 2000.

Like I said above, I do think the CPI report is a gamechanger… in the short term. It should put a bid under the market as it removes a bearish risk – yields constantly marching higher as inflation spiraled upwards.

In the more intermediate-term, if we assume that inflation keeps falling, then the focus will shift to earnings.

If earnings can stay flat or even keep growing, then I think stocks will keep rallying. If earnings begin to show damage, then we could see stock prices fall along with yields and inflation.

In terms of the portfolio, I have eschewed many tech and housing stocks due to the relentless rise in yields. This is no longer the case, and I think we can start bargain-hunting among this group.

Summary 

The FOMC meeting was bearish, because it meant that the window for a ‘soft landing’ had narrowed.

In my opinion, the latest CPI does strengthen the bullish case and could significantly bolster the bullish case if it proves to be the start of a trend of falling inflation.

But, it’s too soon to say if this is the case. And, we also have the dynamic of a slowing economy which is enough to pull stocks lower even with inflation moving lower.

What To Do Next?

If you’d like to see more top stocks under $10, then you should check out our free special report:

3 Stocks to DOUBLE This Year

What gives these stocks the right stuff to become big winners, even in the brutal 2022 stock market?

First, because they are all low priced companies with the most upside potential in today’s volatile markets.

But even more important, is that they are all top Buy rated stocks according to our coveted POWR Ratings system and they excel in key areas of growth, sentiment and momentum.

Click below now to see these 3 exciting stocks which could double or more in the year ahead.

3 Stocks to DOUBLE This Year

All the Best!

Jaimini Desai
Chief Growth Strategist, StockNews
Editor, POWR Stocks Under $10 Newsletter


SPY shares closed at $398.51 on Friday, up $3.82 (+0.97%). Year-to-date, SPY has declined -15.12%, versus a % rise in the benchmark S&P 500 index during the same period.


About the Author: Jaimini Desai

Jaimini Desai has been a financial writer and reporter for nearly a decade. His goal is to help readers identify risks and opportunities in the markets. He is the Chief Growth Strategist for StockNews.com and the editor of the POWR Growth and POWR Stocks Under $10 newsletters. Learn more about Jaimini’s background, along with links to his most recent articles.

More…

The post Inflation…How Low Can You Go? appeared first on StockNews.com

https://www.entrepreneur.com/article/439038


1 Software Stock to Buy This November and 1 to Avoid

The latest inflation report has raised the odds of the Fed slowing down on its aggressive rate hikes, which might bode well for the tech sector. Moreover, demand for software goods and services remains robust amid the rapid digital transformation. Given the backdrop, quality software stock Salesforce (CRM) could be an ideal buy now. However, Bill.com Holdings (BILL) might be best avoided, given its bleak fundamentals. Keep reading….

shutterstock.com – StockNews

The consumer price index increased 7.7% in October, lower than expected, raising hopes that the Fed might slow down the pace of its rate hike in the next meeting, which might bode well for the software sector. San Francisco Fed President Mary Daly said, “Stepping down is an appropriate thing to think about.” The tech-heavy NASDAQ Composite has gained 6.1% over the past week.

Moreover, according to Gartner, enterprise software spending is projected to grow 8.6% in 2023. In addition, rapid digital transformation worldwide is boosting the application development software market growth. The market for application development software is anticipated to grow at a CAGR of 27.4%.

Given the backdrop, it could be wise to scoop up shares of fundamentally sound stock Salesforce, Inc. (CRM). However, Bill.com Holdings, Inc. (BILL) could be best avoided now, given its weak growth prospects.

Stock to Buy:

Salesforce, Inc. (CRM)

CRM is a customer relationship management technology provider. The company’s Customer 360 platform enables its customers to work together to deliver connected experiences.

On September 21, 2022, CRM partnered with Zywave at InsureTech Connect Vegas 2022. This collaboration aims to integrate the domains of insurance agency sales and client service, leading to more efficient, strategic workflows.

In terms of forward Price/Book, CRM is currently trading at 2.56x, 35.8% lower than the industry average of 3.99x.

CRM’s gross profit margin of 72.61% is 44.54% higher than the 50.24% industry average.

CRM’s total revenues came in at $7.72 billion for the second quarter that ended July 31, 2022, up 21.8% year-over-year. Moreover, its gross profit came in at $5.59 billion, up 18.3% year-over-year. Also, its income from operations came in at $5.4 billion, up 22.9% year-over-year.

Analysts expect CRM’s revenue to increase 17% year-over-year to $30.99 billion in 2023. Its EPS is expected to increase by 15.3% per annum for the next five years. It surpassed EPS estimates in all four trailing quarters. Over the past month, the stock has gained 7.3% to close the last trading session at $156.30.

CRM’s strong fundamentals are reflected in its POWR Ratings. The stock’s overall B rating indicates a Buy in our proprietary rating system. The POWR Ratings assess stocks by 118 different factors, each with its own weighting. 

CRM has a B grade for Sentiment. In the Software – Application industry, it is ranked #31 out of 143 stocks. Click here for the additional POWR Ratings for Value, Stability, Momentum, Growth, and Quality for CRM.

Stock to Avoid:

Bill.com Holdings, Inc. (BILL)

BILL provides cloud-based software that simplifies, digitizes, and automates back-office financial operations for small and midsize businesses worldwide.

In terms of forward Price/Sales, BILL is currently trading at 12.63x, 400.7% higher than the industry average of 2.52x. The stock’s forward Price/Cash Flow multiple of 247.21 is 1340.8% higher than the industry average of 17.16.

BILL’s negative EBIT margin of 40.8% is lower than the 6.99% industry average. Its negative EBITDA margin of 29.1% is lower than the 12.18% industry average.

BILL’s loss from operations came in at $87.69 million for the first quarter that ended September 30, 2022, up 18.2% year-over-year. Moreover, its net loss came in at $81.64 million, up 9.9% year-over-year.

BILL’s EPS is expected to decrease by 28.7% per annum for the next five years. Over the past year, the stock has lost 63.3% to close the last trading session at $120.14.

BILL’s overall D rating equates to a Sell in our POWR Ratings system.

It has an F grade for Stability and a D for Value, Momentum, and Quality. It is ranked #121 in the same industry. Beyond what is stated above, we’ve also rated BILL for Growth and Sentiment. Get all BILL’s ratings here.


CRM shares were trading at $159.33 per share on Friday afternoon, up $3.03 (+1.94%). Year-to-date, CRM has declined -37.30%, versus a -15.03% rise in the benchmark S&P 500 index during the same period.


About the Author: RashmiKumari

Rashmi is passionate about capital markets, wealth management, and financial regulatory issues, which led her to pursue a career as an investment analyst. With a master’s degree in commerce, she aspires to make complex financial matters understandable for individual investors and help them make appropriate investment decisions.

More…

The post 1 Software Stock to Buy This November and 1 to Avoid appeared first on StockNews.com

https://www.entrepreneur.com/article/439023


3 Semiconductor Stocks That Aren’t as Safe as They Used to Be

Regulatory action has hit the semiconductor industry, which could affect the sector’s near-term prospects. Against this backdrop, we think semiconductor stocks NVIDIA (NVDA), Advanced Micro Devices (AMD), and Marvell Technology (MRVL) might not be safe investments now. Read on….

shutterstock.com – StockNews

Last month, the U.S. Department of Commerce imposed rules to cut-off China’s supply to key chips and components for supercomputers. This has put U.S. companies under heavy restrictions to export machinery to Chinese companies that are manufacturing chips of a certain sophistication.

However, this move is expected to create near-to-medium-term volatility in the semiconductor industry, especially in the earnings of U.S. companies with considerable exposure to the Chinese market.

Moreover, following strong growth in the first half, global semiconductor sales have slowed down recently due to macroeconomic headwinds. The Semiconductor Industry Association (SIA) announced that September sales had dropped 3% year-over-year, marking the first drop since January 2020.

Given this backdrop, semiconductor stocks NVIDIA Corporation (NVDA), Advanced Micro Devices, Inc. (AMD), and Marvell Technology, Inc. (MRVL) are not safe investments now.

NVIDIA Corporation (NVDA)

NVDA is a global provider of graphics, computation, and networking solutions. The company operates through two segments: Graphics and Compute & Networking. The company’s products are used in gaming, professional visualization, datacenter, and automotive markets.

In September, the U.S. government blocked NVDA from exporting two of its top computing chips, A100 and H100 graphic processing units, to China for artificial intelligence (AI) work. The company stated that the ban is expected to impact its revenue by $400 million.

For the second quarter that ended July 31, NVDA’s revenue came in at $6.70 billion, up 3% year-over-year. However, its non-GAAP income from operations came in at $1.33 billion, down 56.9% year-over-year.

In addition, its non-GAAP net income came in at $1.29 billion, down 50.7% year-over-year, while its non-GAAP net income per share came in at $0.51, down 51% year-over-year.

Analysts expect NVDA’s EPS to decline 39.5% year-over-year to $0.71 for the fiscal third quarter ended October 2022. Its revenue is expected to decrease 17.7% year-over-year to $5.85 billion for the same quarter.

Over the past year, the stock has lost 52.6% to close the last trading session at $146.02. It has lost 17.9% over the past three months.

This bleak outlook is reflected in NVDA’s POWR Ratings. The stock has an overall D rating, equating to Sell in our proprietary rating system. The POWR Ratings assess stocks by 118 different factors, each with its own weighting.

NVDA has a D grade for Growth, Stability, and Value. Within the Semiconductor & Wireless Chip industry, it is ranked #77 of 91 stocks.

Click here for the additional POWR Ratings for NVDA (Momentum, Sentiment, and Quality).

Advanced Micro Devices, Inc. (AMD)

AMD operates as a global semiconductor company through its Computing and Graphics; and Enterprise, Embedded, and Semi-Custom segments. It serves OEMs, public cloud service providers, original design manufacturers, independent distributors, online retailers, and add-in-board manufacturers.

On November 3, AMD unveiled the AMD Radeon RX 7900 XTX and Radeon RX 7900 XT graphics cards. The gaming graphics cards use an advanced AMD chiplet design. However, there might still be some time before significant gains can be realized from the new products as they are expected to not be available before December.

For the third quarter that ended September 24, AMD’s net income came in at $66 million, down 92.8% year-over-year. In addition, its non-GAAP operating expenses increased 46.9% year-over-year to $1.52 billion, while its non-GAAP earnings per share came in at $0.67, down 8.2% year-over-year.

AMD’s revenue is expected to decrease 4.3% year-over-year to $5.64 billion for the quarter ending March 2023. Its EPS is expected to fall 37.1% year-over-year to $0.71 for the same period.

Over the past year, the stock has lost 57.5% to close the last trading session at $63.85. It has lost 36.2% over the past three months.

AMD’s POWR Ratings reflect its poor prospects. It has an overall F rating, which indicates a Strong Sell. The stock has an F grade for Stability and a D for Growth, Sentiment, and Quality. Within the same industry, AMD is ranked #89.

Click here to access the additional POWR Ratings for AMD (Value and Momentum).

Marvell Technology, Inc. (MRVL)

MRVL designs, develops, and markets analog, mixed-signal, digital signal processing, embedded, and standalone integrated circuits. The company offers Ethernet solutions and storage products.

It was reported that Marvell was eliminating some roles in China as part of a realignment of its global research and development investments.

For the fiscal second quarter ended July 30, MRVL’s total non-GAAP operating expenses increased 17.8% year-over-year to $431.60 million. Net cash used in investing activities rose 239.2% from the prior-year quarter to $129.90 million. MRVL’s total current liabilities came in at $2.16 billion for the period ended July 30, 2022, compared to $1.39 billion for the period ended January 29, 2022.

Its EPS is expected to come in at $0.59 for the fiscal third quarter ended October 2022. Analysts expect its revenue to amount to $1.56 billion for the same quarter.

The stock has declined 28.4% over the past three months to close its last trading session at $39.79. It has fallen 54.5% year-to-date.

It’s no surprise that MRVL has an overall D rating, equating to a Sell in our proprietary rating system. The stock has a D grade for Stability and Quality. MRVL is ranked #79 in the same industry.

Click here to see the additional POWR Ratings for MRVL for Value, Growth, Momentum, and Sentiment.


NVDA shares were trading at $138.93 per share on Wednesday afternoon, down $7.09 (-4.86%). Year-to-date, NVDA has declined -52.73%, versus a -19.75% rise in the benchmark S&P 500 index during the same period.


About the Author: Anushka Dutta

Anushka is an analyst whose interest in understanding the impact of broader economic changes on financial markets motivated her to pursue a career in investment research.

More…

The post 3 Semiconductor Stocks That Aren’t as Safe as They Used to Be appeared first on StockNews.com

https://www.entrepreneur.com/article/438817