1 Cash-Rich Stock You Can Buy Now and Hold Forever

Tech giant Microsoft (MSFT) delivered better-than-expected first-quarter results and is well-positioned to drive profitability and free cash flow in the upcoming quarters. The company’s strong cash position allows it to pay dividends at an increasing rate, ensuring a steady income stream. Hence, we think it could be wise to buy and hold onto this cash-rich stock to dodge the uncertain macro environment. Keep reading….

shutterstock.com – StockNews

Amid persistently high inflation, aggressive interest rate hikes, and a potential economic slowdown, cash-rich companies like Microsoft Corporation (MSFT) are witnessing huge investor interest. MSFT’s strong cash position allows it to advance organic growth, pursue strategic acquisitions, pay dividends, and buy back shares.

The tech giant had cash and cash equivalents of $22.88 billion as of September 30, 2022, compared to $13.93 billion as of June 30, 2022. The company had current liabilities of $87.39 billion as of September 30 versus $95.08 billion as of June 30.

On September 20, MSFT declared a quarterly dividend of $0.68 per share, reflecting a 10% increase over the prior quarter’s dividend. The dividend is payable on December 8, 2022.

The company pays a $2.72 dividend annually, yielding 1.15% at the current share price. Its 4-year average dividend yield is 1.07%. Its dividend payouts have grown at a CAGR of 10.5% over the past three years and 9.7% over the past five years. Moreover, the company has increased its dividends over the past 17 years.

Furthermore, MSFT has landed profitable long-term deals with leading market players. On October 20, MSFT and UBS Group AG (UBS) announced a landmark expansion of their partnership to accelerate UBS’s public cloud footprint over the next five years. MSFT’s rich set of productivity and collaboration tools would enable UBS to increase the speed at which it can deliver and improve upon its digital experiences for clients and employees. 

On October 12, MSFT and Cisco Systems, Inc. (CSCO) announced a new partnership to provide customers with more choices. In the first half of 2023, CSCO and MSFT will offer the ability to run Microsoft Teams natively on Cisco Room and Desk devices Certified for Microsoft Teams, with Teams as the default experience option. This is expected to broaden the reach of MSFT’s suite of productivity and collaboration tools.

MSFT has gained marginally over the past month to close the last trading session at $235.87. Moreover, Wall Street analysts expect the stock to hit $297.19 in the near term, indicating a potential upside of 26%.

Here is what could influence MSFT’s performance in the upcoming months:

Robust Financials

For the fiscal 2023 first quarter ended September 30, 2022, MSFT’s total revenue increased 10.6% year-over-year to $50.12 billion, driven by growth in Intelligent Cloud and Productivity and Business Processes segments. Its operating income grew 6.3% from the year-ago value to $21.52 billion.

Furthermore, the company’s adjusted net income and earnings per share came in at $17.56 billion and $2.35, representing increases of 2% and 4% year-over-year, respectively.

Favorable Analyst Estimates

Analysts expect MSFT’s revenue for the fiscal 2023 third quarter (ending March 2023) to come in at $52.72 billion, indicating an increase of 6.8% year-over-year. The current year’s consensus EPS estimate of $2.35 indicates a 5.7% year-over-year increase. The company has surpassed the consensus revenue and EPS estimates in three of the trailing four quarters, which is impressive.

In addition, the consensus revenue and EPS estimate of $212.37 billion and $9.53 for the current fiscal year (ending June 2023) represents 7.1% and 3.4% year-over-year increases, respectively. Also, the company’s revenue and EPS for fiscal 2024 are expected to increase 14.4% and 11.3% year-over-year to $242.97 billion and $11.29, respectively.

Higher-than-industry Profitability

In terms of the trailing-12-month gross profit margin, MSFT’s 68.26% is 35.6% higher than the 50.33% industry average. Its trailing-12-month EBIT margin of 41.69% is 489.3% higher than the industry average of 7.07%. Likewise, its 48.67% trailing-12-month EBITDA margin is 299.6% higher than the industry average of 12.18%.

Furthermore, the stock’s trailing-12-month ROCE, ROTC, and ROTA of 42.88%, 21.97%, and 19.40% compare to the industry averages of 6.63%, 3.73%, and 2.22%, respectively. Its trailing-12-month CAPEX/Sales of 12% is 423.5% higher than the industry average of 2.29%.

POWR Ratings Show Promise

MSFT has an overall rating of B, equating to a Buy in our POWR Ratings system. The POWR Ratings are calculated by considering 118 different factors, each weighted to an optimal degree.

Our proprietary rating system also evaluates each stock based on eight distinct categories. The stock has a B grade for Quality, in sync with its higher-than-industry profitability.

MSFT is ranked #10 out of 52 stocks in the B-rated Software – Business industry. Click here to access MSFT’s Growth, Value, Sentiment, Stability, and Momentum.

Bottom Line

MSFT’s revenue and net income have increased at CAGRs of 16.1% and 19.3% over the past three years, respectively. Moreover, the company’s levered free cash flow has grown at a CAGR of 10.9% over the past three years. Its balance sheet seems rock solid, with cash outweighing its liabilities. The tech giant also raised its quarterly dividend by 10%.

Given its robust financials, solid analyst estimates, and high profitability, we think it could be wise to buy this cash-rich stock and hold it forever.

How Does Microsoft Corporation (MSFT) Stack Up Against its Peers?

MSFT has an overall POWR Rating of B, equating to a Buy. Check out these other stocks within the Software – Business industry with an A (Strong Buy) or B (Buy) rating: VMware Inc. (VMW), Amdocs Limited (DOX), and Agilysys, Inc. (AGYS).


MSFT shares fell $2.26 (-0.96%) in premarket trading Monday. Year-to-date, MSFT has declined -29.41%, versus a -17.15% rise in the benchmark S&P 500 index during the same period.


About the Author: Mangeet Kaur Bouns

Mangeet’s keen interest in the stock market led her to become an investment researcher and financial journalist. Using her fundamental approach to analyzing stocks, Mangeet’s looks to help retail investors understand the underlying factors before making investment decisions.

More…

The post 1 Cash-Rich Stock You Can Buy Now and Hold Forever appeared first on StockNews.com

https://www.entrepreneur.com/article/438191


Stock Market Rally Déjà Vu?

It feels even more like deja vu as the S&P 500 (SPY) is embarking on its 3rd bear market rally of 2022 with each taking place during earnings season. Despite a handful of high-profile misses, the Q3 earnings season has continued the trend of previous ones by coming in better than expected. Given the market’s oversold state and some bullish seasonals, as we begin Q4, this has been sufficient to send the market more than 10% higher over the last 2 weeks. As we covered previously, it’s difficult to predict an endgame for the rally as this depends on dynamic factors like economic data and earnings, but we can be certain of its outcome. In today’s commentary, I want to recap our strategy for the current environment and then do our monthly review of various market topics. Read on below to find out more….

shutterstock.com – StockNews

(Please enjoy this updated version of my weekly commentary originally published October 27th, 2022 in the POWR Stocks Under $10 newsletter).

Over the last week, the S&P 500 (SPY) is up by 4%. And, it’s indeed confirmation of the bear market rally thesis vs a bounce as we easily exceeded the previous high.

In terms of sector performance, I think one development is the outperformance of small caps which are up 7% vs the Nasdaq which is up 2%. Of course, the major factor is the high-profile earnings misses of companies like Meta, Microsoft, and Google.

In contrast, the “market of stocks’ is holding much better as evidenced by the Russell 2000 and the performance of the median company in terms of beating expectations for the top and bottom line. Additionally, margins continue to remain much more resilient.

There also continues to be some evidence for a “soft landing’ as the labor market shows no signs of cracking and GDP came in at 2.6% on a preliminary basis.

Recapping Our Strategy

However, nothing has changed about my more bearish stance in the intermediate and longer term. In fact, any positive news for the economy and financial markets is just more bullets for Fed tightening.

Any strength in these areas is construed by the Fed as evidence that it’s not doing its job to a sufficient degree.

It’s kind of like the absence of pockets of excess and speculation in financial markets is evidence that the Fed has more room to stimulate.

We are in the opposite situation. As we have discussed in previous commentaries, the good news is bad, because its means a tighter Fed, and bad news is bad, because it means that earnings will decline.

So, we are going to use this temporary period of strength to slowly take some profits and shift into a more neutral stance.

Constructive Criticism

I would say the biggest flaw in my performance this year has been not recognizing how quickly gains in the market and individual stocks can vanish once the bear market reasserts itself.

I’m determined not to repeat that mistake this time. And, I think one key is to sell on the way up and to act quickly once the short-term trend breaks.

Market Topics

Energy: Here’s a reminder of what I said last week on this topic.

“Lately, we’ve seen some relief in terms of energy prices with supply coming back, while demand has been less than expected due to China. In fact, analysts estimate that China is consuming about 2 million barrels per day less than it would usually does.

At the same time, Russian oil continues to find its way onto the market.

There are also rumors of the US easing sanctions against Venezuela and allowing exports which could add another 500,000 barrels per day.

There were also reports of negotiations with Iran although these seem to have ended with no resolution and are unlikely to restart given the crackdown against protesters.

And, of course, we have OPEC+’s decision to cut production by 2 million barrels per day.

Another factor in the mix has been the SPR’s sales of oil which have put downwards pressure on prices. There have also been questions about when the US will become a buyer and replenish these holdings.

Usually, my reflexive stance is to be critical of governments and find fault in their actions. However, this is an exception. The US government is reportedly going to buy oil futures contracts at around $70 per barrel for 2025.

This will effectively put a floor on oil prices which will increase production and give producers more certainty about prices.

The bear market in oil has led to caution among oil producers who were burnt badly by investing aggressively following the 2008-2012 period when prices averaged above $100 per barrel. Many of these projects went bust or were money losers over the next decade.

Thus, this will lead to more certainty among producers and increase CAPEX. It’s also a rare win for the government which effectively sold oil above $100 and is buying it back around $70 while helping alleviate the supply-side issues.”

I just want to share my current summation of the matter – longer-term, I continue to see powerful factors on the supply side that are supportive of a multiyear, bull market. In the short term, I think these factors will be overwhelmed by eroding demand due to a brutal global recession.

Defensive Strategies: One limitation of this universe of stocks is the lack of places to hide during adverse market conditions. One strategy is to overweight cash which we have done for nearly the whole year. But, that’s really it.

Most stocks under $10 are quite speculative in nature and have limited institutional ownership which makes them more susceptible to deep declines during major selloffs in the market which are a routine part of bear markets.

In my POWR Growth portfolio, we have overweighted cash in addition to defense & aerospace and pharmaceutical stocks which are up double-digits (or close to it), while the market is down double digits since the positions’ inception.

Election: I do believe that one factor in the recent market strength are the rising odds of a Republican win. This would eliminate the chances of any fiscal stimulus over the next 2 years which is bullish in an inflationary environment.

However, it does increase the odds of gamesmanship over the debt ceiling which could rear its head as a threat sometime next year. But, the bigger point is that Republicans are currently favored to win control of the House and Senate.

What To Do Next?

If you’d like to see more top stocks under $10, then you should check out our free special report:

3 Stocks to DOUBLE This Year

What gives these stocks the right stuff to become big winners, even in the brutal 2022 stock market?

First, because they are all low priced companies with the most upside potential in today’s volatile markets.

But even more important, is that they are all top Buy rated stocks according to our coveted POWR Ratings system and they excel in key areas of growth, sentiment and momentum.

Click below now to see these 3 exciting stocks which could double or more in the year ahead.

3 Stocks to DOUBLE This Year

All the Best!

Jaimini Desai
Chief Growth Strategist, StockNews
Editor, POWR Stocks Under $10 Newsletter


SPY shares closed at $389.02 on Friday, up $9.04 (+2.38%). Year-to-date, SPY has declined -17.15%, versus a % rise in the benchmark S&P 500 index during the same period.


About the Author: Jaimini Desai

Jaimini Desai has been a financial writer and reporter for nearly a decade. His goal is to help readers identify risks and opportunities in the markets. He is the Chief Growth Strategist for StockNews.com and the editor of the POWR Growth and POWR Stocks Under $10 newsletters. Learn more about Jaimini’s background, along with links to his most recent articles.

More…

The post Stock Market Rally Déjà Vu? appeared first on StockNews.com

https://www.entrepreneur.com/article/438143


#2 Investment for 2023

In a world with more than 20,000 investments to chose from, then being my #2 selection for the year ahead is still pretty impressive. Discover why the ARK Innovation ETF (ARKK) has earned this top honor. The key is knowing when to buy your shares during the current bear market cycle. Read on below for full details.

shutterstock.com – StockNews

A couple weeks ago I posted my #1 investment pick for the coming year. That was featured in this article.

However, it is not easy to narrow down to just one pick when there are obviously so many quality choices out there. So, my solution is to roll out my #2 pick for 2023.

Let me set the backdrop first.

It is now late October 2022. And anyone reading my ongoing market commentary knows quite clearly that I am still very bearish on the on the short term outlook. My expectation is for the S&P 500 (SPY) to find bottom somewhere between 2,800 to 3,200 in early 2023.

But then things become glorious for the bulls.

Because from that darkest hour stocks will rise with gusto. We are truly talking about the “phoenix rising from the ashes” which is how all new bull markets begin.

In fact, going all the way back to 1900, the average first year gain for new bull markets is +46.2%.

My #1 pick for the market was TNA which is a 3X bullish ETF focused on small cap stocks. That’s because small caps outperform the S&P 500. Plus you get the benefit of 3X leverage.

However, with that 3X leverage comes additional risk that not everyone is going to stomach. So yes, it would be easy to simply switch to the 1X small cap ETF variety like IWM. Indeed that would do quite well as the bull market resumes. Gladly we can do a notch better than that.

Which is why my #2 investment for 2023 is: ARK Innovation ETF (ARKK)

Right now Cathie Wood’s fund is the laughing stock of the investing world as it has fallen nearly 60% in 2022. Yes, that is about three times worse than the S&P 500.

The reason is simple. She is focused on the highest growth stocks that also carry the highest beta. That is glorious when the bull is running…and an absolute death sentence when the bear comes to town.

Here again, we are talking about a great investment idea 2023…and buying it as the new bull market emerges. So if the average one year return for the S&P 500 during a new bull is 46.2%, then it would not surprise me to see ARKK double that return without any leverage.

Here again, look at the top 5 holdings to appreciate how far these stocks have fallen of late…and thus how much they will likely bounce when the bull is ready to run:

Tesla (TSLA)

Roku (ROKU)

Teladoc Health (TDOC)

Square (SQ)

Zoom Video (ZM)

Aye, But Here is the Rub…

If you buy too early, and the market is still racing lower, you will have tremendous losses on your hands. So I caution against just blindly buying it without some consideration for determining market bottom.

Again, right now it is late October 2022. So this is an evolving story that needs vigilant watch on all the key indicators like employment, earnings, inflation, Fed rates and price action. That is the only way to determine when it may be time to enact this ARKK trade. Probably some time in early 2023.

If you would like some help with that timing, then get your hands on my “Bear Market Game Plan“.

This will provide the top picks to make money now as the bear market grinds lower. Plus help with timing the market bottom so you can properly load up on your ARKK shares.

Discover “Bear Market Game Plan” >

Wishing you a world of investment success!


Steve Reitmeister…but everyone calls me Reity (pronounced “Righty”)
CEO, StockNews.com

Editor of Reitmeister Total Return


ARKK shares closed at $38.89 on Friday, up $1.02 (+2.69%). Year-to-date, ARKK has declined -58.89%, versus a -17.15% rise in the benchmark S&P 500 index during the same period.


About the Author: Steve Reitmeister

Steve is better known to the StockNews audience as “Reity”. Not only is he the CEO of the firm, but he also shares his 40 years of investment experience in the Reitmeister Total Return portfolio. Learn more about Reity’s background, along with links to his most recent articles and stock picks.

More…

The post #2 Investment for 2023 appeared first on StockNews.com

https://www.entrepreneur.com/article/438142


When Will This “Suckers Rally” End?

Indeed this nearly 9% rally for the S&P 500 (SPY) from the recent bottom has been impressive. Then again so was the 18% rally back during the summer that fizzled out before new lows were made. THIS TIME WILL BE NO DIFFERENT! This article will explain why plus how to prepare your portfolio to generate profits even as the market heads lower once again.

shutterstock.com – StockNews

Stocks continue to bounce this week even in the face of very weak earnings from many leading bellwether stocks.

Why?

Because…that’s why.

Remember that a rally in the midst of a bear market is no more meaningful than a correction in the midst of a bull market. They can happen at any time for any reason.

The key is to realize the long term trajectory is unchanged and that we have not yet seen the lows for this bear market cycle.

How much higher could this current rally go?

That will be focus of this week’s commentary.

Market Commentary

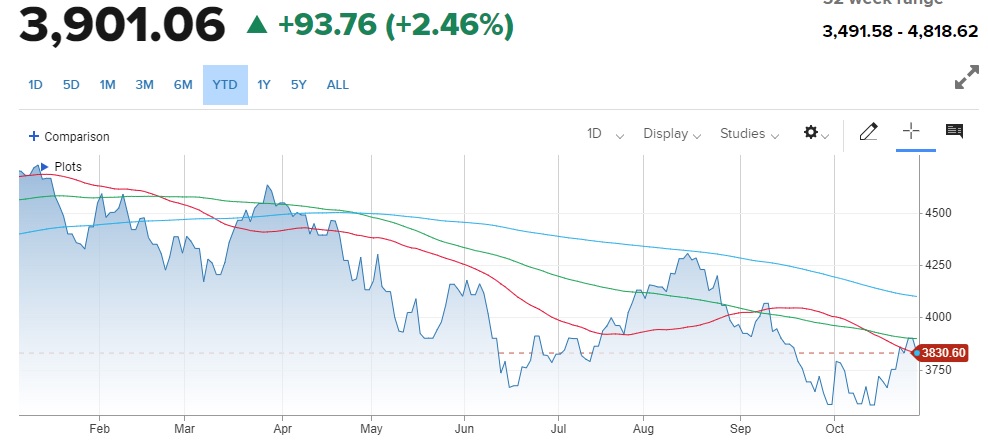
Let’s start with the year-to-date chart for the S&P 500 (SPY):

I have also layered on the 3 key moving averages:

Red = 50 Day = 3,842

Green = 100 Day = 3903

Blue = 200 Day = 4,113

The first thing to notice on the chart is how many failed rallies there have been already this year before new lows were made. That includes the seemingly impressive 18% rally from June to August that sucked in many investors only to spit them out with a move to new lows.

This rally will also fail. Probably next week for 2 good reasons.

First, is that we are right now pressing up against the 100 day moving average. We could easily run out of steam at this level especially given the way we ended the week.

That being a TERRIBLE earnings report for Amazon (on top of the bad news from Meta and Google) that absolutely has broad meaning for the economy headed in the wrong direction. That Amazon report had stocks properly heading lower at the open only to dramatically reverse course end the session with a rip roaring rally at +2.46%.

That type of reversal is very common for the last gas of a rally before heading in the other direction. Meaning that the buying pressure may be exhausted and hard to get above resistance at the 100 day moving average (3,903).

Second, and more importantly, next week brings the most vital economic reports for November starting with ISM Manufacturing on Tuesday. This is followed on Wednesday by the Fed rate decision with another hike on the way. Coming down the home stretch we have ISM Services on Thursday and then Government Employment on Friday.

Please remember that the Flash PMI report from Monday already confirmed weakening conditions for both manufacturing and services. (49.9 and 47.3 respectively…both under 50 meaning contraction). This bodes poorly for the more widely followed, and market moving, ISM versions of this report.

Along with that we are still likely in a world of where most everything that happens next week is negative for stocks. Even positive economic news would be a signal that more inflation is in our future which points to more aggressive Fed. Thus, I expect the recent bear market rally to fizzle out with investors getting back in a selling mood.

From previous commentaries I have shared the view that the likely bottom of this bear is somewhere around 3,000. And if things fall into their typical bear market pattern that is happening in the first half of 2023 just as the economy is likely finding the depths of the recession.

Yes, it is possible that stocks could keep moving higher a bit longer not unlike the illogical mid-summer rally before new bear market lows were established.

Bear market rallies are called “suckers rallies” for a reason.

So the word to the wise is…don’t be a sucker.

Expect this rally to fizzle out, as early as this week. But probably no higher than the 200 day moving average at 4,100 that capped the last rally.

Invest accordingly.

What To Do Next?

Discover my special portfolio with 9 simple trades to help you generate gains as the market descends further into bear market territory.

This plan has been working wonders since it went into place mid August generating a robust gain for investors as the S&P 500 (SPY) tanked.

And now is great time to load back up as we make even lower lows in the weeks and months ahead.

If you have been successful navigating the investment waters in 2022, then please feel free to ignore.

However, if the bearish argument shared above does make you curious as to what happens next…then do consider getting my updated “Bear Market Game Plan” that includes specifics on the 9 unique positions in my timely and profitable portfolio.

Click Here to Learn More >

Wishing you a world of investment success!


Steve Reitmeister…but everyone calls me Reity (pronounced “Righty”)
CEO, Stock News Network and Editor, Reitmeister Total Return


SPY shares . Year-to-date, SPY has declined -17.15%, versus a % rise in the benchmark S&P 500 index during the same period.


About the Author: Steve Reitmeister

Steve is better known to the StockNews audience as “Reity”. Not only is he the CEO of the firm, but he also shares his 40 years of investment experience in the Reitmeister Total Return portfolio. Learn more about Reity’s background, along with links to his most recent articles and stock picks.

More…

The post When Will This “Suckers Rally” End? appeared first on StockNews.com

https://www.entrepreneur.com/article/438127


#1 Investing Strategy for 2022

Investing before 2022 was easy. Just pick the hottest growth stocks and ride them higher. It kind of felt like 1999 all over again as there seemed to be no end to the gains…that was before the calendar flipped to 2022 and these stocks were crushed. In fact, famed growth investor Cathie Wood’s Ark Innovation fund is down 61.6% on the year. This article will share with you the strategy that is working in 2022 even as the S&P 500 (SPY) is in bear market territory. Read on below for more….

shutterstock.com – StockNews

Some people were starting to believe that value investing was dead.

Yes, that sounds extreme. However, for the bulk of the last several years the path to stock market success was paved with buying growth companies no matter how much momentum…no matter how high their nose bleed PE.

I am referring to every hot trend from Electric Vehicles to Cannabis to 3D Printers to Metaverse to (fill in the blank).

This growth only investment blueprint appears to negate the virtue of classic value principles pioneered by Benjamin Graham (and his most famous pupil Warren Buffett) as these “in favor” investments have gravity defying multiples.

Those who walked away from value investing point to 3 fatal flaws:

  1. Value Traps (where stocks head lower and lower)
  2. Classic Value Metrics Don’t Work Anymore
  3. Lack of Timeliness Deadens ROI

So, what’s the solution?

Please give me just a few minutes of your time so I can spell it out for you. Especially as value investing is making a strong come back in 2022.

This includes sharing details on our coveted Top 10 Value Stocks strategy that has scored an average +37.67% gain since 1999 (4.5x better than the S&P 500 over that stretch).

Let me first tell you more about this computer generated model. Then we will discuss how it solves all 3 of the fatal flaws of value investing.

That journey starts with a brief discussion of our quant ranking system; the POWR Ratings.

If you have spent any time on StockNews.com you have certainly seen information on our exclusive POWR Ratings system. Indeed, these ratings really do help investors gain a decided advantage over the market, as can clearly be seen in the performance chart below.

Where Does the Outperformance Come From?

The POWR Ratings model is the most complete review of a stock available to individual investors today. All in all, we look at 118 different factors of a stock before assigning an A to F rating.

Which 118 factors? 

The simple answer is ONLY the ones that lead to more profitable stock selection. Truly this is like a DNA check of each stock getting down to the molecular level to appreciate the stocks built to outperform.

Once that analysis of the overall POWR Rating is done, we then break down those 118 factors into 6 additional grades to appreciate the virtue of a stock on the following dimensions:

  • Value
  • Growth
  • Momentum
  • Stability
  • Quality
  • Sentiment

For those quick on the draw, you probably just figured out that if you combine a strong overall POWR Rating with a healthy Value score, that you are well on our way to picking the best value stocks.

Gladly that process will get you going in the right direction.

Sadly you will still end up with a list of over 700 stocks to research.

That is not so bad if picking stocks is your full-time job. However, for most of you that is far too time consuming.

This led to an “Aha!” moment.

What if we could develop a strategy to unearth the 10 top value stocks at any time producing consistent outperformance?

So, we went back to the same Data Scientist who created the POWR Ratings and asked the seemingly impossible—could he turn up the volume on the value metrics and somehow exceed their already market beating returns?

After months of research and rigorous testing the Top 10 Value Stocks strategy was born.

Not only did we narrow to just 10 value stocks. But we also greatly increased performance to +37.67% per year since 1999.

The hallmark of this screen is a zealous focus on the 31 individual value factors that help to consistently discover the market’s best value stocks (and just as importantly, ignoring the 100’s of factors that actually don’t work at all!).

Combining those 31 unique value factors together in optimal fashion leads to uncovering this incredibly consistent winning strategy.

I’ve Heard Enough…Where Can I See These Top Value Stocks? >

The Key Word is “Consistency”

That’s because the POWR Ratings also focuses on the consistency of growth. Not just earnings growth, but also improvements in revenue, profit margins and cash flow.

Then our rating model goes further into the Quality of a stock by drilling down on the main metrics that show the health of operations over time.

The steps noted above solve the #1 fatal flaw of value investing. That being how to avoid the value traps that are really just poorly run companies that go from bad to worse. The focus on Growth and Quality aspects are the best possible health checks to alleviate these problems.

Meaning that we look beyond the overly simplistic value measurements used in the past, allowing us to deliver to you the healthiest growing companies, that just so happen to be trading at attractive discount prices.

Next up we need to tackle the 2nd fatal flaw. Which is that most classic value metrics don’t work like they used to. 

Consider this.

Computer driven trading now dominates the investment landscape. No longer is it seasoned investment managers making the decisions. Instead the vast majority of trades are run by these quant models.

This has been true for more than 10 years. And truly billions of dollars have been thrown at these quant models to squeeze out every last drop of profit hidden in shares.

So long ago these models tapped into the benefit of the typical value approaches like PE, Book Value, PEG, Price to Sales etc.

Now after years of high volume trading of these models it could be said that the value well has run dry.

More precisely, the best value metrics have very little benefit on their own. So the key to success is to stack as many of these metrics in your favor as possible. Like the 31 value metrics inside the POWR Ratings model.

That’s 31 advantages working in your favor to generate outperformance. Each one increasing the odds of success. And that’s how the Top 10 Value Stocks strategy is able to produce a +37.67% annual return.

I’ve Heard Enough…Where Can I See These Top Value Stocks? >

Finally we address the 3rd fatal flaw which is that value stocks are generally not timely which damages your ROI.

Value is considered a contrarian investing style. That’s because you are betting on companies that are currently out of favor hoping that the share price turns around.

Unfortunately the longer it takes…the more it harms your Return On Investment.

Gladly the POWR Ratings focuses on 25 different factors that greatly increase the timeliness and ROI of the stocks.

13 Sentiment Factors

12 Momentum Factors

Sentiment factors track what the smart money is doing with the stock such as institutional ownership, Wall Street analyst estimates and insider buying. These are time-tested ways of finding timely, in-favor stocks.

Next up is narrowing in on 12 different Momentum factors that targets stocks ready to rise. Indeed Momentum is just like physics where “a body in motion… stays in motion”.

All in all the POWR Ratings applies 118 factors to find the best stocks. The combination of which truly helps overcome the 3 fatal flaws of value investing.

Then we dial up value attributes to create the Top 10 Value Stocks strategy that increases performance to a stellar +37.67% a year.

This is how you solve the 3 fatal flaws of value investing.

And this is the consistent path to finding the best value stocks in the future…

One last improvement

For as great as the Top 10 Value Stocks strategy truly is, there is still one glaring flaw that exists in all quantitative systems. And that is understanding the all-important WHY behind which stocks to buy, and when to sell to maximize gains.

That is why I go one step further, using my 40 years of investing experience to dive deeper into each stock, pulling the curtain back on the all-important qualitative metrics that no computer ratings system can uncover.

The final result is the very best value stocks, that I hand select for subscribers to our popular POWR Value Newsletter.

This is truly a best of both world’s solution:

+37.67% annual return from Top 10 Value strategy

+

Steve Reitmeister with 40+ years of investing experience with a keen eye for uncovering hidden value stocks

=

POWR Value newsletter to help you discover the best value stocks for today’s market.

Yes, even in these volatile markets, where the portfolio has delivered a solid profit since December 1st, 2021, while the overall market was descending deep into bear market territory.

Now you can experience the market beating returns of the POWR Value newsletter, for just $1 for a full 30 days.

During your trial you’ll get full access to the current portfolio, my weekly market commentary and every trade alert by text & email.

There’s no obligation beyond the 30 day trial, so there is absolutely no risk in getting started today.

About POWR Value & 30 day Trial > >

Wishing you a world of investment success!

Steve Reitmeister…but everyone calls me Reity (pronounced “Righty”)
CEO, StockNews.com
Editor of Reitmeister Total Return & POWR Value


SPY shares . Year-to-date, SPY has declined -17.15%, versus a % rise in the benchmark S&P 500 index during the same period.


About the Author: Steve Reitmeister

Steve is better known to the StockNews audience as “Reity”. Not only is he the CEO of the firm, but he also shares his 40 years of investment experience in the Reitmeister Total Return portfolio. Learn more about Reity’s background, along with links to his most recent articles and stock picks.

More…

The post #1 Investing Strategy for 2022 appeared first on StockNews.com

https://www.entrepreneur.com/article/438126


Extra Money in Your Pocket? Put These 3 Stocks to Work in Q4

With the Fed on track to approve another significant interest rate hike and willing to risk recession to bring inflation under control, the stock market is expected to remain under pressure in the upcoming months. Hence, it would be wise to invest in fundamentally strong stocks Comcast (CMCSA), Hackett (HCKT), and J. Jill (JILL) at discounts to make your extra money work. Continue reading….

shutterstock.com – StockNews

September’s employment and inflation data have beaten expectations and seem to have paved the way for the Fed to respond with another aggressive rate hike during its November meeting.

With the previous rate hikes manifesting in the form of softening demand, increased borrowing costs, and compressed margins in the Q3 earnings, a soft landing for the economy increasingly seems like an improbable scenario. Based on the probability model, the Conference Board has predicted a 96% likelihood of a recession in the United States within the next 12 months.

Moreover, the recent relief rally backed up by initial corporate earning beats fades as growth fears loom, and the earnings from tech companies have started to show the effects of the slowdown. According to Fahad Kamal, chief investment officer at Kleinwort Hambros, slow growth in advertising in these bellwethers “adds weight to the fear of an earnings slowdown.”

Amid an uncertain market backdrop, it could be wise to put your extra money into fundamentally strong stocks Comcast Corporation (CMCSA), Hackett Group Inc. (HCKT), and J.Jill, Inc. (JILL), which are available at discounts to generate solid returns in the long run.

Comcast Corporation (CMCSA)

CMCSA is a global media and technology company. It operates through three segments: Cable Communications; Media; Studios; Theme Parks; and Sky.

On October 26, CMCSA paid its quarterly dividend of $0.27 a share on the company’s common stock. The company pays $1.08 as a dividend annually, which translates to a yield of 3.42% at the current price. This compares favorably to the 4-year average dividend yield of 2.03%. CMCSA’s dividend payouts have grown for the past five years at an 11.7% CAGR.

On September 21, CMCSA announced that it is working with Samsung to deliver 5G Radio Access Network (RAN) solutions that can be used to enhance 5G connectivity for Xfinity Mobile and Comcast Business Mobile customers in Comcast service areas. The company expects this to deliver more next-generation applications and services to its customers seamlessly.

On September 14, CMCSA announced an expansion in its share repurchase authorization to a total of $20.0 billion, with $9 billion worth of shares repurchased to date. This demonstrates the company’s financial strength and commitment to enhancing shareholder value.

For the second quarter of the fiscal year 2022 ended June 30, CMCSA’s revenue increased 5.1% year-over-year to $30.02 billion. The company’s adjusted EBITDA increased 10.1% year-over-year to $9.83 billion, while its adjusted net income grew 14.3% year-over-year to $4.51 billion. As a result, its adjusted EPS rose 20.2% year-over-year to $1.01.

Analysts expect CMCSA’s revenue to increase 4.5% year-over-year to $121.57 billion in the current fiscal year, ending December 31, 2022, while its EPS is expected to grow 11% year-over-year to $3.59 for the same period. Also, the company has an impressive earnings history, surpassing the consensus EPS estimates in each of the four trailing quarters.

The stock has gained marginally over the past month to close the last trading session at $31.56. In terms of forward non-GAAP P/E, the stock is trading at 8.8x, 36.3% lower than the industry average of 13.81x.

CMCSA’s POWR Ratings reflect its promising outlook. It has an overall rating of A, which equates to a Strong Buy in our proprietary rating system. The POWR Ratings are calculated considering 118 different factors, with each factor weighted to an optimal degree.

It has a grade of B for Value and Quality. CMCSA tops the list of nine stocks in the Entertainment – TV & Internet Providers industry.

Click here for the additional POWR Ratings for Growth, Momentum, Stability, and Sentiment for CMCSA.

Hackett Group Inc. (HCKT)

HCKT operates as a business and technology consulting firm. The company offers benchmarking, executive advisory, business transformation, and cloud enterprise application implementation.

On September 22, HCKT announced the launch of a new Market Intelligence Service for software and service providers and users. The service will measure software and service providers’ ability to deliver business value and their unique capabilities to help companies achieve Digital World Class performance.

HCKT believes the new service will be a powerful and attractive value proposition for all C-level executives and their respective teams.

HCKT’s total revenue increased 3.7% year-over-year to $75.93 million for the second quarter of 2022. The company’s total assets stood at $217.89 million as of July 1, 2022, compared to $207.54 million as of December 31, 2021.

Analysts expect HCKT’s revenue and EPS for the fiscal year 2022 to increase 6.6% and 10.4% year-over-year to $297.20 million and $1.45, respectively. Also, the company has surpassed the consensus EPS estimates in each of the trailing four quarters.

HCKT’s stock has gained 19.3% over the past month to close the last trading session at $21.14. In terms of forward non-GAAP P/E, the stock is trading at 14.61x, 18.1% lower than the industry average of 17.84x.

HCKT’s promising outlook is reflected in its overall POWR Rating of A, which translates to a Strong Buy in our proprietary rating system. It also has a grade of A for Quality and B for Stability and Sentiment.

HCKT tops the list of 10 stocks in the A-rated Outsourcing – Tech Services industry.

Click here for additional ratings of HCKT (Growth, Value, and Momentum).

J.Jill, Inc. (JILL)

JILL is an omnichannel retailer of women’s apparel. The company’s flagship brand J.Jill is focused on clothing for women in the 45-age segment. It offers two sub-brands extensions of its brand aesthetic: Pure Jill and Wearever.

For the second quarter of fiscal 2022 ended July 30, JILL’s net sales increased marginally year-over-year to $160.34 million, while its adjusted income from operations increased 16.8% year-over-year to $28.19 million. The company’s adjusted EBITDA and net income grew 8.8% and 34.6% year-over-year to $35.57 million and $17.69 million, respectively.

Furthermore, JILL’s adjusted quarterly net income per share increased 33.3% year-over-year to $1.24.

Analysts expect JILL’s revenue and EPS for the current fiscal year (ending January 2023) to increase 4% and 26.8% year-over-year to $608.8 million and $2.7, respectively. The company has an impressive earnings surprise history of surpassing its consensus EPS estimates in each of the trailing four quarters.

JLL’s stock has gained 16.3% over the past month and 24% over the past year to close the last trading session at $19.32. In terms of forward non-GAAP P/E, the stock is trading at 8.59x, 66.8% lower than the industry average of 25.83x.

It is no surprise that JILL has an overall rating of A, which translates to Strong Buy in our POWR Ratings system. JILL also has a grade of A for Sentiment and Quality and a B for Value.

JILL is ranked #2 among 66 stocks in the Fashion & Luxury industry.

Beyond what we have stated above, we have also given JILL grades for Growth, Momentum, and Stability. Get all JILL ratings here.


CMCSA shares were trading at $31.56 per share on Wednesday afternoon, down $0.00 (0.00%). Year-to-date, CMCSA has declined -35.63%, versus a -18.66% rise in the benchmark S&P 500 index during the same period.


About the Author: Santanu Roy

Having been fascinated by the traditional and evolving factors that affect investment decisions, Santanu decided to pursue a career as an investment analyst. Prior to his switch to investment research, he was a process associate at Cognizant. With a master’s degree in business administration and a fundamental approach to analyzing businesses, he aims to help retail investors identify the best long-term investment opportunities.

More…

The post Extra Money in Your Pocket? Put These 3 Stocks to Work in Q4 appeared first on StockNews.com

https://www.entrepreneur.com/article/437952


How To Use The VIX To Make Better Stock Picks

Be like Buffett and use the VIX to buy fear and sell greed in the SPY.

shutterstock.com – StockNews

The VIX finally closed below 30 on Friday and below the 20-day moving average of 31.20. It is also nearing the critical 27.50 area that served as serious upside resistance for most of September until it finally gave way. Earnings from tech bell weathers Apple (AAPL) and Microsoft (MSFT) next week and the Fed rate decision the following week will likely tell the tale regarding direction of both stocks and the VIX into year-end.

I had written an article in late August on how option prices can help predict future stock prices. I specifically used the VXN -or VIX of the NASDAQ stocks- to show how the big pullback in VXN equated to a short-term top in NASDAQ stocks (QQQ), as shown below.

But rather than just calling tops, using an IV based methodology can be a robust market timing tool to use to help discern turning points in the overall market from both a bullish and bearish perspective.

Remember, the VIX and VXN are both measures of 30-day implied volatility (IV) in the S&P 500 and NASDAQ 100 respectively. In this article I will explore how using the VIX can greatly aid in discerning the upcoming market movement for the S&P 500 (SPY)  both to the upside and the downside.

The chart below shows how extended moves higher in VIX towards 35 followed by subsequent weakness has been a bona-fide buy signal in SPY over the past year. Conversely, sharp drops lower in VIX with subsequent strength have been solid sell signals in stocks.

The table below summarizes the initial buy signal and subsequent sell signal based on this VIX methodology.

The total P/L for the 5 buy and sell signals is 35.86%, with an average gain of just over 7%. Worst gain was still 3%. Compare that to the overall loss of over 20% in the SPY over the past 12 months.

The average days held for each buy/sell signal was roughly a month. Total time held for all signals combined was less than half a year. So big gains in under 50% of the time using the VIX methodology compared to bigger losses holding SPY all the time.

A new buy signal was generated a few weeks ago as the SPY hit annual lows. No sell signal evident yet, but the unrealized gain on that latest buy signal is now over 5%.

Using the VIX to help tell whether the SPY is at a turning point is akin to the Warren Buffett adage to be greedy when others are fearful and fearful when others are greedy. Certainly, a little of the fear has come out of the market if VIX is any guide. Still haven’t reached the greedy level yet so stay tuned and see what happens over the coming weeks!

POWR Options

What To Do Next?

If you’re looking for the best options trades for today’s market, you should check out our latest presentation How to Trade Options with the POWR Ratings. Here we show you how to consistently find the top options trades, while minimizing risk.

If that appeals to you, and you want to learn more about this powerful new options strategy, then click below to get access to this timely investment presentation now:

How to Trade Options with the POWR Ratings

All the Best!

Tim Biggam

Editor, POWR Options Newsletter


SPY shares closed at $374.29 on Friday, up $8.88 (+2.43%). Year-to-date, SPY has declined -20.28%, versus a % rise in the benchmark S&P 500 index during the same period.


About the Author: Tim Biggam

Tim spent 13 years as Chief Options Strategist at Man Securities in Chicago, 4 years as Lead Options Strategist at ThinkorSwim and 3 years as a Market Maker for First Options in Chicago. He makes regular appearances on Bloomberg TV and is a weekly contributor to the TD Ameritrade Network “Morning Trade Live”. His overriding passion is to make the complex world of options more understandable and therefore more useful to the everyday trader. Tim is the editor of the POWR Options newsletter. Learn more about Tim’s background, along with links to his most recent articles.

More…

The post How To Use The VIX To Make Better Stock Picks appeared first on StockNews.com

https://www.entrepreneur.com/article/437731


Fade the Friday Rally

Bull markets do not go straight up. There are plenty of down days, weeks and even months for the S&P 500 (SPY) added into the mix. Conversely bear markets do not go straight down. In fact, they have some pretty sizeable rallies that come along the way often clouding the picture of what comes next. This is why we call them “suckers rallies” as investors get sucked in…just before they get spit back out on the next leg lower. This is all to say we are still very much in a bear market with lower lows on the way. Here is why.

shutterstock.com – StockNews

The 24/7 investment media like CNBC needs to keep things interesting to keep you watching all in the name of selling more ads. Their favorite trick is to show the great importance of that day’s news and how it affected the S&P 500 (SPY).

That means that on Thursday they were telling people why things are so terrible and why stocks are down. And then Friday they put on a broad smile talking about how Fed whispers of potentially less stringent rate hikes led to a monster rally.

Interesting for sure…just not profitable advice.

Let’s talk about what is really happening…and why…and why stocks are still in a long term bear market battle with lower lows on the way.

Market Commentary

Stocks were floating around this past week until another shot was fired by the Fed to dampen the mood. I am talking about the mid-day Thursday comments from Philadelphia Fed President, Patrick Harker. Here the key excerpt from the CNBC article on the topic:

“Philadelphia Federal Reserve President Patrick Harker on Thursday said higher interest rates have done little to keep inflation in check, so more increases will be needed.

“We are going to keep raising rates for a while,” the central bank official said in remarks for a speech in New Jersey. “Given our frankly disappointing lack of progress on curtailing inflation, I expect we will be well above 4% by the end of the year.”

The latter comment was in reference to the fed funds rate, which currently is targeted in a range between 3%-3.75%.

“Sometime next year, we are going to stop hiking rates. At that point, I think we should hold at a restrictive rate for a while to let monetary policy do its work,” he said. “It will take a while for the higher cost of capital to work its way through the economy. After that, if we have to, we can tighten further, based on the data.”

Pretty much from that moment stocks reversed out of early gains to end firmly lower. The reason should be obvious. That we may not currently see the full measure of pain in the economy because the Fed’s work is FAR from over.

So if their efforts to date have not resulted in moderating inflation, then it will take much higher rates and likely much more damage to the economy to get the job done. And those hoping for a soft landing should start abandoning that flawed assumption.

I say that even as Friday there was a bounce for the “supposed” reason that some investors heard some talk at the Fed that would point to fewer rate hikes and less pain to the economy. Here is a CNBC article on that topic:

Stocks rally Friday as traders hope Fed rate hikes will slow down, Dow up 500 points

Sorry folks. I don’t give that much merit.

Remember that the Fed will always have internal debates on the pros and cons of any policy decision. The consensus outcome is what you see issued to the public followed by a speaking tour of Fed officials to give those comments additional weight and color.

Let there be NO DOUBT that they are currently on course with what was shared by Powell at Jackson Hole. That being a long term battle with inflation. Do NOT expect any rate cuts through the end of 2023. And do expect it to create economic pain (slowing of growth and dampening of the labor market).

Now let’s layer on top of this somber note the growing legion of corporate executives that are sounding the alarm on a looming recession. Jeff Bezos of Amazon is the one listed first in this article, but as you scroll down in the article you will see many more pounding the table followed by Elon Musk echoing that sentiment on Friday.

The most interesting part is that on this list are many Wall Street executives. The great curiosity is that crowd rarely says recession or bear market. That’s because when they do that, then more clients go from investments in stocks to cash where they make little to no fees.

Instead these folks typically speak in riddles about volatility or potential difficulties on the horizon. So historically you would have to read through the lines to get down to their real meaning.

The point being if Wall Street execs are straight up telling you that a recession is on the way…then best you believe it to be true and invest accordingly. (Which we are…more on that below).

On the economic front weakness found in the Empire State Manufacturing report on Monday was confirmed on Thursday be an even worse showing for the Philly Fed Manufacturing Index. The way forward does not look much better as the New Orders component remains weak at -15.9.

Remember that manufacturing is often a leading indicator for the economy as a whole. So the weakness here will likely spread to the services. Some of that was already on display last week from the Retail Sales report which shows that overall spending is ONLY higher because of inflation. If you remove inflation you see net spending is lower. This is likely a big part of the reason that Jeff Bezos is sounding the recession alarm.

Bull markets are long term trends that typically last 5-6 years. Once on track…it is hard to knock off its axis.

Bear markets are more like 12-18 month affairs. Not as long, but also hard to knock off its trajectory once the ball is rolling. And indeed it is rolling. And will keep rolling until the Fed has hit the brakes hard enough to throttle the economy and put an end to inflation.

Please remember the battle cry of “Don’t Fight the Fed!”

In the Fed’s own words, this is a long term battle with no signs of lower rates til 2024. This is why so many corporate executives are preparing for recession. And this is why so many investment experts, including yours truly, are beating the bearish drum.

So yes, there will be bear market rallies here and there. Some quite impressive as we saw with the 18% gain from mid June til mid August when investors regained their senses. However, the long term picture points to lower lows on the way and you would be wise to get your portfolio in tune with that reality.

What To Do Next?

Discover my special portfolio with 9 simple trades to help you generate gains as the market descends further into bear market territory.

This plan has been working wonders since it went into place mid August generating a robust gain for investors as the S&P 500 (SPY) tanked.

If you have been successful navigating the investment waters in 2022, then please feel free to ignore.

However, if the bearish argument shared above does make you curious as to what happens next…then do consider getting my updated “Bear Market Game Plan” that includes specifics on the 9 unique positions in my timely and profitable portfolio.

Click Here to Learn More >

Wishing you a world of investment success!


Steve Reitmeister…but everyone calls me Reity (pronounced “Righty”)
CEO, Stock News Network and Editor, Reitmeister Total Return


SPY shares were trading at $374.66 per share on Friday afternoon, up $9.25 (+2.53%). Year-to-date, SPY has declined -20.20%, versus a % rise in the benchmark S&P 500 index during the same period.


About the Author: Steve Reitmeister

Steve is better known to the StockNews audience as “Reity”. Not only is he the CEO of the firm, but he also shares his 40 years of investment experience in the Reitmeister Total Return portfolio. Learn more about Reity’s background, along with links to his most recent articles and stock picks.

More…

The post Fade the Friday Rally appeared first on StockNews.com

https://www.entrepreneur.com/article/437715


3 Factors to Find Breakout Stocks

Investors often assume that if the overall market (SPY) is in bear market territory…that means that every stock is down. It’s true that the vast majority head lower. But it is also true that there is “always a bull market somewhere”. Mean some stocks go up even during the worst of times. This article shares insights on 3 factors that help find more of these breakout stocks in good times and bad. Read on below for details.

shutterstock.com – StockNews

This week we were blessed with our largest crowd ever for a live investment webinar where we unveiled a new way to pick winning stocks. Click below to see what the excitement is all about:

3 Factors to Find Breakout Stocks >

On the surface I understand this seems like an odd choice of a webinar in the midst of a bear market with the S&P 500 (SPY) in the tank.

However, let’s remember that not all stocks are down this year. Plus, there have been some pretty glorious bounces that have led to some timely gains.

How can you enjoy more of those winners in the weeks and months ahead?

Watch the webinar to see how we combine 3 vital factors that firmly put the odds firmly in your favor.

No longer do we have to debate which is better: Fundamentals vs. Technicals?

The answer is that both increase the odds of success. So, it is best to use both.

Easy to say…but how do you do it in reality? And how to do it consistently?

This webinar replay has the answers…so start watching now!

3 Factors to Find Breakout Stocks >

Wishing you a world of investment success!


Steve Reitmeister

…but everyone calls me Reity (pronounced “Righty”)
CEO, StockNews.com & Editor, Reitmeister Total Return


SPY shares were trading at $365.03 per share on Thursday afternoon, down $3.47 (-0.94%). Year-to-date, SPY has declined -22.26%, versus a % rise in the benchmark S&P 500 index during the same period.


About the Author: Steve Reitmeister

Steve is better known to the StockNews audience as “Reity”. Not only is he the CEO of the firm, but he also shares his 40 years of investment experience in the Reitmeister Total Return portfolio. Learn more about Reity’s background, along with links to his most recent articles and stock picks.

More…

The post 3 Factors to Find Breakout Stocks appeared first on StockNews.com

https://www.entrepreneur.com/article/437714


Don’t Let Wall Street Steer You Into Buying This Auto Stock

LiDAR company Luminar Technologies (LAZR) has fallen more than 55% year-to-date. However, the company has witnessed unusual options activity lately, indicating bullish investor sentiment. Given the stock’s fundamental weakness, it may not be wise to follow Wall Street’s bullishness and buy the stock. Read on to learn our view.

shutterstock.com – StockNews

Automotive technology stock Luminar Technologies, Inc. (LAZR) was an investor favorite when the stock market was on a bull run following the pandemic-led plunge. The company enables solutions for series production passenger cars and commercial trucks. The provider of lidar technology operates under two segments: Autonomy Solutions and Components.

However, since the stock market has been battling several macroeconomic and geopolitical headwinds since the beginning of this year, LAZR has gotten hammered due to concerns over its weak financials.

Surprisingly, LAZR recently witnessed unusual options activity. Over 25,000 call options were traded on October 18, indicating bullish investor sentiment.

The company failed to surpass the consensus EPS estimates in the last reported quarter. However, it beat the consensus revenue estimate by 17.5%. Moreover, the company raised its fiscal year 2022 revenue outlook to $40-$45 million from the $40 million estimated earlier.

Shares of LAZR have declined 56.3% in price year-to-date and 52.2% over the past year to close the last trading session at $7.39. It is trading 69% below its 52-week high of $23.90, which it hit on November 9, 2021.

Here’s what could influence LAZR’s performance in the upcoming months:

Weak Financials

LAZR’s non-GAAP net loss widened 134.7% year-over-year to $65.03 million for the second quarter ended June 30, 2022. Its non-GAAP loss per share widened 125% year-over-year to $0.18. The company’s non-GAAP operating expenses increased 86% year-over-year to $51.58 million. Also, its non-GAAP gross loss widened significantly to $10.91 million.

Mixed Analyst Estimates

LAZR’s EPS for fiscal 2022 and 2023 is expected to remain negative. Its revenue for fiscal 2022 and 2023 is expected to increase 37.6% and 181% year-over-year to $43.97 million and $123.59 million, respectively.

Stretched Valuation

In terms of forward EV/S, LAZR’s 60.31x is significantly higher than the 1.05x industry average. Likewise, its 60.42x forward P/S is significantly higher than the 0.82x industry average. Its 29.83x trailing-12-month P/B is significantly higher than the 1.99x industry average.

Weak Profitability

LAZR’s trailing-12-month gross profit margin is negative compared to the 36.42% industry average. Likewise, its trailing-12-month levered FCF margin is negative compared to the 1.69% industry average. Also, its 0.05% trailing-12-month asset turnover ratio is 94.8% lower than the 1.03% industry average.

POWR Ratings Reflect Bleak Prospects

LAZR has an overall F rating, equating to a Strong Sell in our POWR Ratings system. The POWR Ratings are calculated by considering 118 distinct factors, with each factor weighted to an optimal degree.

Our proprietary rating system also evaluates each stock based on eight distinct categories. LAZR has an F grade for Value, in sync with its stretched valuation.

It has an F grade for Quality, consistent with its weak profitability. In addition, LAZR’s 1.56 beta justifies its F grade for Stability.

LAZR is ranked last out of 65 stocks in the Auto Parts industry. Click here to access LAZR’s ratings for Growth, Momentum, and Sentiment.

Bottom Line

LAZR is on a downtrend, trading below its 50-day and 200-day moving averages of $8.55 and $10.82, respectively. As the Fed continues its aggressive rate hikes, the company is expected to remain under pressure in the upcoming months.

Despite the unusual call options buying witnessed on October 18, we think it could be wise to avoid the stock now, given its weak financials, stretched valuation, and weak profitability.

How Does Luminar Technologies, Inc. (LAZR) Stack Up Against Its Peers?

LAZR has an overall POWR Rating of F, equating to a Strong Sell rating. Therefore, one might want to consider investing in other Auto Parts stocks with an A (Strong Buy) or B (Buy) rating, such as Ituran Location and Control Ltd. (ITRN), LKQ Corporation (LKQ), and BorgWarner Inc. (BWA).


LAZR shares were trading at $7.20 per share on Wednesday morning, down $0.19 (-2.57%). Year-to-date, LAZR has declined -57.42%, versus a -21.10% rise in the benchmark S&P 500 index during the same period.


About the Author: Dipanjan Banchur

Since he was in grade school, Dipanjan was interested in the stock market. This led to him obtaining a master’s degree in Finance and Accounting. Currently, as an investment analyst and financial journalist, Dipanjan has a strong interest in reading and analyzing emerging trends in financial markets.

More…

The post Don’t Let Wall Street Steer You Into Buying This Auto Stock appeared first on StockNews.com

https://www.entrepreneur.com/article/437510