Wall Street’s Top 3 Software Stocks Crushing the Competition

Robust software demand among individuals and businesses and numerous technological breakthroughs have opened lucrative growth opportunities for software providers. Thus, it could be wise to invest in Wall Street’s top software stocks, F5 (FFIV), DocuSign (DOCU), and Trend Micro (TMICY), which are crushing the competition. Continue Reading….

The growing demand for software across multiple end-use sectors, such as IT, retail, manufacturing, and healthcare, has positioned the software industry for significant growth in the long term. This surge is being fueled by the increasing global spending among enterprises and the rapid adoption of emerging technologies.

Given the industry’s solid footing, it could be wise to consider buying Wall Street’s top software stocks, F5, Inc. (FFIV), DocuSign, Inc. (DOCU), and Trend Micro Incorporated (TMICY), with massive growth potential.

The software allows computer hardware to perform essential tasks and help businesses work efficiently. They enable enterprises to streamline processes, access data accurately and quickly, and analyze information easily. Gartner forecasts worldwide software spending to total $1.03 trillion in 2024, an increase of 12.7% from the previous year.

Rapid digitalization among organizations, the growing adoption of cutting-edge technologies like cloud, AI, and IoT, the quick integration of multichannel touchpoints into a single platform, and the rising need to analyze vast amounts of business data are some of the major factors boosting the business software industry’s growth and profitability.

The business software market is expected to grow at a CAGR of 11.2% during the forecast period (2024-2029), reaching about $1.10 trillion by 2029.

Business software also offers plenty of opportunities for small, medium, and large enterprises to scale their operations widely with Software as a Service (SaaS). Various global organizations are adopting SaaS for various applications, including IT infrastructure, customer relationship management (CRM), financial management, and human resource planning (HRP).

In recent times, cybercrime rates have been surging, and the increasing number of attacks put lives at risk, costing companies millions and threatening national security. There is a rapidly growing need for effective security software with an expanding risk of data breaches or ransomware attacks.

The security software market is projected to reach a total of $51.46 billion, expanding at a CAGR of 13.9% during the forecast period.

Investors’ interest in software stocks is evident from the iShares Expanded Tech-Software Sector ETF’s (IGV) 53.2% returns over the past year.

Considering the industry’s bright prospects, investors could consider adding fundamentally sound software stocks FFIV, DOCU, and TMICY to their portfolios.

Let’s discuss the fundamentals of these stocks in detail:

F5, Inc. (FFIV)

FFIV offers multi-cloud application security and delivery solutions internationally. Its distributed cloud services enable customers to deploy, secure, and operate applications in any architecture, from on-premises to the public cloud. The company offers unified, security, networking, and application management solutions.

On February 7, 2024, FFIV announced new capabilities that reduce the complexity of protecting and powering the exploding number of applications and APIs at the heart of modern digital experiences. The new end-to-end API security and AI capabilities make it easier for customers to protect their AI-powered applications.

With AI accelerating the growth of applications and the APIs that connect them, FFIV is bringing API code testing and telemetry analysis to F5 Distributed Cloud Services, creating the industry’s most comprehensive and AI-ready API security solution.

For the fiscal 2024 first quarter ended December 31, 2023, FFIV reported total net revenues of $693 million and its net revenues from services rose 7.5% year-over-year to $386.74 million. The company’s non-GAAP gross profit increased 2.1% from the year-ago value to $575 million. Its non-GAAP operating profit grew 32.9% year-over-year to $246 million.

The company’s non-GAAP net income and non-GAAP EPS of $205 million and $3.43 indicate growth of 37.6% and 38.9% from the previous year’s quarter, respectively. Its cash and cash equivalents were $822.57 million as of December 31, 2023, compared to $797.16 million as of September 30, 2023.

For the second quarter of the fiscal year 2024, FFIV expects its revenue to be in the range of $675 million to $695 million, while its non-GAAP earnings are expected to be in the range of $2.79 to $2.91 per share.

Analysts expect FFIV’s EPS for the second quarter (ending March 2024) to increase 13.3% year-over-year to $2.87. Moreover, the company has topped consensus EPS and revenue estimates in all four trailing quarters, which is impressive.

For the fiscal year ending September 2025, FFIV’s revenue and EPS are expected to grow 4.4% and 10.1% from the prior year to $2.91 billion and $13.87, respectively.

Shares of FFIV have surged 17.3% over the past six months and 28.3% over the past year to close the last trading session at $186.61.

FFIV’s bright prospects are reflected in its POWR Ratings. The stock has an overall rating of A, which translates to a Strong Buy in our proprietary rating system. The POWR Ratings are calculated by considering 118 different factors, each weighted to an optimal degree.

FFIV has an A grade for Quality and a B for Value. It is ranked #4 out of 43 stocks in the B-rated Software – Business industry.

To check POWR Ratings of FFIV for Growth, Momentum, Stability, and Sentiment, click here.

DocuSign, Inc. (DOCU)

DOCU provides electronic signature solutions internationally. It offers DocuSign e-signature solution that enables the sending and signing of agreements; Contract Lifecycle Management (CLM), which automates workflows across the entire agreement process; and Gen for Salesforce, which allows sales representatives to generate agreements automatically.

On November 30, 2023, DOCU achieved StateRAMP authorization, which deepens DOCU’s commitment to offering state and local governments access to seamless and secure agreement experiences. StateRAMP brings state and local governments together to develop standards for cloud security, educate on best practices and offer methods for verifying cloud security.

The StateRAMP authorization assists state and local governments in prioritizing data security alongside fostering and maintaining trust among their constituents and other government entities.

On November 14, DOCU launched WhatsApp Delivery, allowing users to close deals faster with the world’s most popular messaging platform. It will enable customers to reach signers seamlessly through their preferred communication platforms. DOCU eSignature integration of WhatsApp sends users real-time notifications that link directly to agreements and allow quick, secure signing.

The integration demonstrates DOCU’s commitment to international expansion, enabling quick, secure signing around the globe.

DOCU’s total revenue increased 8.5% year-over-year to $700.42 million during the third quarter that ended October 31, 2023. Its non-GAAP gross profit rose 8.1% year-over-year to $581.43 million. The company’s non-GAAP income from operations grew 27.4% from the year-ago value to $187.41 million.

In addition, the company’s non-GAAP net income came in at $163.80 million and $0.79 per share, up 38.7% and 38.5% from the previous year’s quarter, respectively. Its cash and cash equivalents were $1.19 billion as of October 31, 2023, compared to $721.89 million as of January 31, 2023.

As per business guidance for the fourth quarter of fiscal 2024, DOCU expects total revenue to be between $696 million and $700 million, and subscription revenue is expected to be between $679 million and $683 million.

Street expects DOCU’s revenue for the fiscal year (ended January 2024) to increase 9.2% year-over-year to $2.75 billion. Its EPS for the same period is expected to increase 41.5% year-over-year to $2.87. Also, the company topped consensus revenue and EPS estimates in each of the four trailing quarters.

DOCU’s stock gained marginally over the past month to close the last trading session at $51.18.

DOCU’s sound fundamentals are reflected in its POWR Ratings. The stock has an overall rating of A, which translates to a Strong Buy in our proprietary rating system.

The stock has an A grade for Growth and a B grade for Value and Quality. Within the B-rated Software – SAAS industry, DOCU has topped among the 20 stocks.

Click here to access additional ratings of DOCU for Sentiment, Momentum, and Stability.

Trend Micro Incorporated (TMICY)

Headquartered in Tokyo, Japan, TMICY develops and sells security-related software for computers and related services worldwide. It offers platforms like vision one platform, attack surface management, extended detection and response (XDR), cloud security, endpoint security, network security, email security, OT/ICS security, and threat intelligence.

On November 29, 2023, TMICY achieved the Amazon Web Services (AWS) Built-in Competency in the Security and Cloud Operations category. It gave TMICY recognition as an AWS Partner, offering an AWS built-in solution designed to install, configure, and integrate with key foundational AWS services automatically using a modular code repository (MCR).

On November 28, TMICY announced the addition of cloud risk management to its flagship cybersecurity platform. The new service adds business value by allowing organizations to consolidate their cybersecurity efforts and attain a complete view of cloud security risks across hybrid IT environments.

The release includes features like agentless and cloud-native vulnerability scanning, cloud security posture management (CSPM), cloud infrastructure entitlement management (CIEM), and risk visibility.

Also, on November 27, TMICY launched its new generative AI tool, Trend Companion, designed to empower security analysts by driving streamlined workflows and enhanced productivity. Trend Companion can reduce analyst time spent on manual risk assessments and threat investigations by 50% or more through a plain language interface.

During the nine months that ended September 30, 2023, TMICY’s net sales increased 13.3% year-over-year to ¥183.72 billion ($1.23 billion). Its operating income grew 14.5% from the prior period to ¥29.61 billion ($198.34 million). The company’s ordinary income of ¥31.93 billion ($213.89 million) indicates growth of 5% year-over-year.

Additionally, the company’s net income attributable to owners of the parent and net income per share came in at ¥12.81 billion ($85.77 million) and ¥93.26, respectively. Its total current assets were ¥352.74 billion ($2.36 billion) as of September 30, 2023, compared to ¥319.93 billion ($2.14 billion) as of December 31,2022.

Analysts expect TMICY’s revenue and EPS for the second quarter (ending June 2024) to increase 4.3% and 29.4% year-over-year to $442.13 million and $0.36, respectively. For the fiscal year 2024, the company’s revenue is expected to grow 9% year-over-year to $1.85 billion, while its EPS is expected to grow 46.1% from the prior year to $1.47.

Over the past six months, the stock has gained 32.1% and 15.1% over the past year to close the last trading session at $56.41.

TMICY’s POWR Ratings reflect its robust outlook. The stock has an overall A rating, translating to a Strong Buy in our proprietary rating system.

TMICY has an A grade for Stability and a B for Quality and Growth. It is ranked #2 among 23 stocks within the B-rated Software – Security industry.

To see the other ratings of TMICY for Sentiment, Value, and Momentum, click here.

What To Do Next?

Discover 10 widely held stocks that our proprietary model shows have tremendous downside potential. Please make sure none of these “death trap” stocks are lurking in your portfolio:

10 Stocks to SELL NOW! >


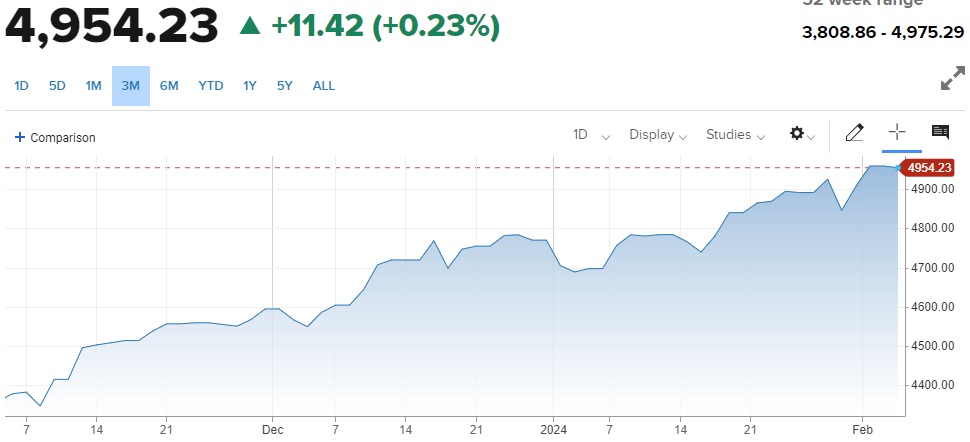
FFIV shares were unchanged in premarket trading Monday. Year-to-date, FFIV has gained 4.26%, versus a 5.45% rise in the benchmark S&P 500 index during the same period.


About the Author: Mangeet Kaur Bouns

Mangeet’s keen interest in the stock market led her to become an investment researcher and financial journalist. Using her fundamental approach to analyzing stocks, Mangeet’s looks to help retail investors understand the underlying factors before making investment decisions.

More…

The post Wall Street’s Top 3 Software Stocks Crushing the Competition appeared first on StockNews.com

https://www.entrepreneur.com/finance/wall-streets-top-3-software-stocks-crushing-the-competition/469601


5,000 Green or Red Light for Stocks???

The S&P 500 (SPY) continues to impress on this recent bull run. Yet the level of 5,000 is nearly 50% above the bear market lows and many value investors are saying that stocks are getting expensive. So will stocks race above 5,000 or will this level prove to be a long red light? 43 year investment veteran Steve Reitmeister shares his views in the commentary below along with a preview of this top 12 stocks to buy at this time.

There is no surprise that the market is flirting with 5,000 for the S&P 500 (SPY). Just too attractive of a level not to attain at this time.

The problem is that this is a very hollow rally like we saw for the majority of 2023 where almost all the gains were accruing to the Magnificent 7 mega cap tech stocks.

Unfortunately, the vast majority of stocks are actually in the red which can best appreciated by the loss for the Russell 2000 index in the new year.

Let’s discuss what this means for the market outlook and how we still chart a course to outperformance in the days and weeks ahead.

Market Commentary

Thursday offered the first attempt for stocks to break above 5,000. In fact, the index got to 4,999.89 late in the session before resistance kicked in.

Friday was much the same floating just below that 5,000 level. Taking little shots here or there. Yet at the close it fell short once again.

In the long run stocks will climb well above 5,000 as most bull markets last over 5 years and we are still at the very early stages of this bullish phase. That is not the current contemplation. Rather it is about how long it will take to breakout above 5,000?

I explored this concept in my previous article: Are Stocks Stuck til Summer?

The answer to the above question is YES…I think that 5,000 will prove to be a solid lid on stock prices until the Fed starts lowering rates.

No…I am not calling for a correction like some commentators. Perhaps a 3-5% pullback ensues then we play in a range of 4,800 to 5,000 until we get a green light from the Fed on lower rates. This is what would give investors a good reason to step on the gas pedal attaining new highs above 5,000.

Right now, I sense we will just be idling at a red light. Changing the radio station. Sneaking a quick peek at our phones. Staring at people in other cars. Etc.

But once the Fed lowers rates it means more rate cuts are to follow which increases economic growth > earnings growth > stock prices. On top of that lower bond rates makes stocks the more attractive investment by comparison.

This chain of events is the clear green light for stocks to race ahead. Until then I think that many will be worried about how long the Fed will sit on their hands. Many are already surprised they have waited this long.

Then again, when you look at the Fed’s long term track record where 12 of 15 rate hike regimes have ended in recession, then you start to appreciate that these guys often overstay their welcome with rate hikes.

Let’s not forget that there are also 6-12 months of lagged effects on their policies so even if the economy looks OK at the time that rates are cut it is still possible for a recession to form.

That is not my base case at this time. I do sense that this Fed has a better appreciation of history and is managing the dual mandate of moderate inflation and full employment quite well. Meaning that I suspect a soft landing is the most likely outcome, followed by acceleration of the economy…corporate earnings…and yes, share prices.

The point is that the Fed policies are at the center of investment equation at this time. And the key to understanding what the Fed will do is keeping an eye on economic developments. In particular, inflation and employment metrics.

Right now, employment is quite healthy…maybe too healthy for the Fed’s liking. Not just the surprisingly high 353,000 jobs added last month, but also the eerily high wage inflation readings that spiked up to 4.5% year over year.

No doubt the Fed is not fond of this sticky form of wage inflation and would like to see more easing of that pressure before they start lowering rates. The next reading of wage inflation will be on Friday March 7th.

Before that time, we will get the next round of CPI (2/13) and PPI (2/16) inflation readings. Those have been moving in the right direction for some time. In fact, PPI is the leading indicator for the more widely followed CPI, was all the way down to 1% inflation rate at last months reading.

For as good as that is, the Fed is not as fond of CPI and PPI as traders are. They prefer readings from the PCE inflation reading which doesn’t come out til 2/29.

But really they have even more sophisticated ways of reading inflation which can better be appreciated by the Sticky-Price CPI monitoring done by the Atlanta Fed.

As the chart below shows, Sticky Inflation (orange line hovering around 5%) is, well, too darn sticky at this time. Meaning that academics and economists at the Fed are likely concerned that inflation is still too persistent and that more patience is required before lowering rates.

To sum it up, I suspect that 5,000 will prove to be a point of stiff resistance for a while. This should lead to an extended trading range period with investors awaiting the green light from the Fed to start lowering rates.

Yes, it is always possible for stocks to race ahead without this clear go ahead by the Fed. That is why its wise to stay in a bullish posture to enjoy the gains whenever they unfold.

I am saying to just not be that surprised if we don’t continue to rise given 3 straight months of very bullish conditions coupled with facing an obvious place of stiff psychological resistance at 5,000.

At this stage the Magnificent 7 have had their fun. I wouldn’t be surprised if some profits are taken there and shifted to smaller stocks. What you might call a sector rotation or change in leadership. There was some good signs of that starting to be the case on Thursday as the Russell 2000 rose +1.5% on the session while the large cap focused S&P 500 hovered around breakeven.

Also, I suspect there will be a greater eye towards value as many market watchers are pointing out that earnings growth is muted and thus at this level the overall market is pretty fully valued. That is especially true for the Magnificent 7 that no value investor could stomach their exorbitant multiples.

This too calls for a rotation to new stocks that are more deserving of higher prices. It is precisely these kinds of “under the radar” growth stocks trading at reasonable prices that I cherish.

To discover which ones I am recommending in my portfolio now, then read on below…

What To Do Next?

Discover my current portfolio of 12 stocks packed to the brim with the outperforming benefits found in our exclusive POWR Ratings model. (Nearly 4X better than the S&P 500 going back to 1999)

This includes 5 under the radar small caps recently added with tremendous upside potential.

Plus I have 1 special ETF that is incredibly well positioned to outpace the market in the weeks and months ahead.

This is all based on my 43 years of investing experience seeing bull markets…bear markets…and everything between.

If you are curious to learn more, and want to see these lucky 13 hand selected trades, then please click the link below to get started now.

Steve Reitmeister’s Trading Plan & Top Picks >

Wishing you a world of investment success!


Steve Reitmeister…but everyone calls me Reity (pronounced “Righty”)
CEO, StockNews.com and Editor, Reitmeister Total Return


SPY shares rose $1.33 (+0.27%) in premarket trading Friday. Year-to-date, SPY has gained 5.12%, versus a % rise in the benchmark S&P 500 index during the same period.


About the Author: Steve Reitmeister

Steve is better known to the StockNews audience as “Reity”. Not only is he the CEO of the firm, but he also shares his 40 years of investment experience in the Reitmeister Total Return portfolio. Learn more about Reity’s background, along with links to his most recent articles and stock picks.

More…

The post 5,000 Green or Red Light for Stocks??? appeared first on StockNews.com

https://www.entrepreneur.com/finance/5000-green-or-red-light-for-stocks/469565


Are These 3 Coal Stocks Right for Your Investment Strategy?

Despite rising environmental concerns and the emergence of renewable energy alternatives, coal continues to be a desirable choice to satisfy the growing global energy demand because of its scalability and affordability. Thus, let’s determine if coal stocks Yankuang Energy (YZCAY), Warrior Met Coal (HCC), and CONSOL Energy (CEIX) fit into your investment strategy. Read on.

Despite growing concerns about the environment and increasing ecological renewable energy alternatives, demand for coal will likely remain resilient due to rapid economic growth, particularly in emerging markets. Electricity use for manufacturing, building infrastructure, and urbanization increases with the expansion of economies, boosting coal usage.

Given the industry’s tailwinds, it could be wise to invest in fundamentally sound coal stocks Yankuang Energy Group Company Limited (YZCAY) and CONSOL Energy Inc. (CEIX) for solid returns. However, it seems prudent to wait for a better entry point in Warrior Met Coal, Inc. (HCC) now.

Despite the rise of renewable energy alternatives like solar, wind, and hydroelectric power, coal continues to dominate as a reliable and affordable energy source worldwide. This constant demand is being driven by electricity generation and industrial activity requirements that require coal.

The International Energy Agency (IEA) reported that world demand for coal hit an all-time high in 2023. According to its Coal 2023 report, the IEA projected that coal demand grew to 8.54 billion tons, an increase of 1.4% compared to 2022, primarily fueled by an 8% surge in usage in India and 5% in China due to increased demand for electricity and low hydropower output.

Despite declining over the next few years, the IEA expects consumption of coal to still be above 8 billion tons through 2026.

As per the U.S. Energy Information Administration, in 2024, the total coal consumption is projected at 391.3 million st, up 1.6% from the previous month’s projection. For the electric power sector, coal consumption is anticipated at 351.9 million st this year.

The energy transition initiative is currently on the slowdown, giving plenty of opportunities for the coal market to flourish. There is still a gap between replacing the traditional fossil fuels with renewable resources. Economies have shifted their focus to the effects of climate change, leading to a slowdown in energy replacement.

According to the Transparency Market Research report, the coal market is expected to result in a market volume of $2.10 trillion by 2031, exhibiting growth at a CAGR of 4.4% during the forecast period.

With these encouraging trends in mind, let’s delve into the fundamentals of the three Coal stock picks, beginning with the third choice.

Stock #3: Warrior Met Coal, Inc. (HCC)

HCC produces and exports non-thermal metallurgical coal for the steel industry. The company operates two underground mines located in Alabama. Its metallurgical coal is sold to a customer base of blast furnace steel producers, primarily in Europe, South America, and Asia. It also sells natural gas extracted as a byproduct from coal production.

On October 24, 2023, HCC paid a regular quarterly cash dividend of $0.07 per share on November 10, 2023, to stockholders of record as of the close of business on November 3, 2023.

HCC pays an annual dividend of $0.28, which translates to a yield of 0.47% at the current share price. Its four-year average dividend yield is 4.36%. Moreover, the company’s dividend payouts have increased at a CAGR of 11.9% over the past three years.

In terms of forward non-GAAP P/E, HCC is trading at 5.99x, 62.8% lower than the industry average of 16.09x. Likewise, the stock’s forward EV/EBITDA multiple of 3.54 is 55.9% lower than the industry average of 8.02. However, its forward Price/Sales of 1.81x is 55.6% higher than the industry average of 1.20.

HCC’s trailing-12-month gross profit and EBIT margins of 43.42% and 32.39% are 52.8% and 180.2% higher than the respective industry averages of 28.42% and 11.56%. But the stock’s trailing-12-month levered FCF margin of 4.29% is 6.8% lower than the industry average of 4.60%.

During the third quarter that ended September 30, 2023, HCC’s total revenues increased 8.5% year-over-year to $423.49 million. But its operating income decreased 13.4% from the year-ago value to $107.75 million. Also, its adjusted net income came in at $96.59 million and $1.85 per share, down 11.1% and 11.9% year-over-year, respectively.

In addition, the company’s total assets stood at $2.22 billion as of September 30, 2023, compared to $2.03 billion as of December 31, 2022.

Street expects HCC’s revenue and EPS for the fourth quarter (ended December 2023) to increase 14.5% and 38.7% year-over-year to $394.64 million and $2.64, respectively.

Over the past six months, HCC’s stock has surged 46.3% and 59.4% over the past year to close the last trading session at $59.86.

HCC’s POWR Ratings reflect its mixed outlook. The stock has an overall rating of C, which translates to a Neutral in our proprietary rating system. The POWR Ratings are calculated by considering 118 different factors, with each factor weighted to an optimal degree.

HCC has a C grade for Growth and Value. It is ranked #10 out of 13 stocks in the A-rated Coal industry.

In addition to the POWR Ratings we’ve stated above, we also have HCC’s ratings for Sentiment, Momentum, Quality, and Stability. Get all HCC ratings here.

Stock #2: Yankuang Energy Group Company Limited (YZCAY)

Headquartered in Zoucheng, China, YZCAY engages in the mining, preparation, and sale of coal globally. The company provides thermal, PCI, and coking coal; manufactures, installs, repairs, and sells mining equipment and machinery; sells coal mining and excavating equipment, cable, and rubber products; and produces and sells chemicals.

In terms of forward EV/Sales, YZCAY is trading at 1.40x, 26.2% lower than the industry average of 1.90x. Likewise, the stock’s forward EV/EBIT multiple of 7.03 is 22.8% lower than the industry average of 9.11. Furthermore, its forward Price/Sales of 0.60x is 55.3% lower than the industry average of 1.33x.

YZCAY’s trailing-12-month levered FCF margin of 18.32% is 219% higher than the industry average of 5.75%. Also, the stock’s trailing-12-month ROCE and ROTC of 22.13% and 10.63% are higher than the industry averages of 19.42% and 8.97%, respectively.

YZCAY pays an annual dividend of $2.84, which translates to a yield of 14.03% on the current share prices. Its four-year average yield is 15.58%. The company’s dividend payouts have grown at a CAGR of 41.5% over the past five years. Yankuang Energy has raised its dividend for seven straight years.

For the nine months that ended September 30, 2023, YZCAY reported a total operating revenue of RMB 135.04 billion ($18.97 billion). The company’s operating profit came in at RMB 28.25 billion ($3.97 billion) for the period. Its total profit and EPS were RMB 20.87 billion ($2.93 billion) and RMB 2.08, respectively.

As of September 30, 2023, the company’s current assets and total assets amounted to RMB 90.88 billion ($12.76 billion) and RMB 337.86 billion ($47.45 billion), respectively.

Shares of YZCAY have gained 37.4% over the past six months to close the last trading session at $20.26.

YZCAY’s sound fundamentals are reflected in its POWR Ratings. The stock has an overall rating of B, which translates to a Buy in our proprietary rating system.

The stock has an A grade for Momentum and a B for Value and Stability. Within the A-rated Coal industry, YZCAY is ranked #6 of 13 stocks.

Click here to access additional ratings of YZCAY for Growth, Quality, and Sentiment.

Stock #1: CONSOL Energy Inc. (CEIX)

CEIX produces and exports bituminous coal. The company operates through the Pennsylvania Mining Complex and CONSOL Marine Terminal segments. Its Pennsylvania Mining Complex segment provides mining, preparation, and marketing of bituminous coal. Its CONSOL Marine Terminal segment offers coal export terminal services.

In terms of forward non-GAAP P/E, CEIX is trading at 4.83x, 52.3% lower than the industry average of 10.12x. Further, the stock’s forward EV/Sales multiple of 1.19 is 37.3% lower than the industry average of 1.90. Likewise, its forward Price/Sales of 1.19x is 10.4% lower than the industry average of 1.33x.

CEIX’s trailing-12-month net income and EBIT margins of 25.53% and 31.53% are 99% and 47.1% higher than the respective industry averages of 12.83% and 21.43%. Also, the stock’s trailing-12-month ROTA of 26.01% is 257.5% higher than the industry average of 7.28%.

CEIX repurchased about 1.1 million shares of its common stock from the open market during the fourth quarter of 2023. Also, through a 10b5-1 plan in place for January, CEIX repurchased an additional 307 thousand shares of its common stock.

Thus, with solid free cash flow generated during the fourth quarter, the company repurchased nearly 1.4 million shares. As a result, it allocated approximately 85% of its quarterly free cash flow toward share repurchases.

For the fourth quarter that ended December 31, 2023, CEIX’s total revenue and other income increased 1.9% year-over-year to $649.44 million. Its earnings before income tax were $178.85 million for the same period. The company’s net income and EPS came in at $157.07 million and $5.05, respectively.

Furthermore, the company’s adjusted EBITDA for the CONSOL Marine Terminal segment increased 46% year-over-year to $21 million, while its total adjusted EBITDA was $239.93 million. Its free cash flow grew 42.2% from the year-ago value to $164.99 million.

As per the financial and operating performance guidance for the full fiscal year 2024,  PAMC coal sales volume is expected to be between 25 – 27 million tons. PAMC average realized coal revenue per ton sold2 expectation of $62.50-$66.50. Also, the company projects Itmann Mining Complex coal sales volume of 600-800 thousand tons.

Analysts expect CEIX’s EPS for the third quarter (ending September 2024) to increase marginally year-over-year to $3.14. For the fiscal year ending December 2025, the company’s EPS is expected to grow 6.4% from the prior year to $13.40. Also, the company has topped the consensus revenue estimates in three of the four trailing quarters.

CEIX’s stock has surged 14.6% over the past six months and 33.8% over the past year to close the last trading session at $83.58.

CEIX’s POWR Ratings reflect its bright prospects. The stock has an overall rating of B, which translates to a Buy in our proprietary rating system.

CEIX has an A grade for Quality and Momentum. It also has a B grade for Value. It is ranked #5 among 13 stocks in the A-rated Coal industry.

To access CEIX’s POWR ratings (Stability, Sentiment, and Growth), click here.

What To Do Next?

Get your hands on this special report with 3 low priced companies with tremendous upside potential even in today’s volatile markets:

3 Stocks to DOUBLE This Year >


YZCAY shares were unchanged in premarket trading Thursday. Year-to-date, YZCAY has gained 6.07%, versus a 4.79% rise in the benchmark S&P 500 index during the same period.


About the Author: Mangeet Kaur Bouns

Mangeet’s keen interest in the stock market led her to become an investment researcher and financial journalist. Using her fundamental approach to analyzing stocks, Mangeet’s looks to help retail investors understand the underlying factors before making investment decisions.

More…

The post Are These 3 Coal Stocks Right for Your Investment Strategy? appeared first on StockNews.com

https://www.entrepreneur.com/finance/are-these-3-coal-stocks-right-for-your-investment-strategy/469461


3 Chip Stocks Poised for 2024 Growth

The chip industry is poised to remain resilient, owing to soaring demand for chips across diverse sectors, rapid technological advancements, and government support. To that end, let’s explore chip stocks Marvell Technology (MRVL), NVIDIA Corporation (NVDA), and ChipMOS TECHNOLOGIES (IMOS), poised for substantial growth in 2024. Read on….

The importance of semiconductors in today’s tech-reliant society cannot be understated. The chip industry is anticipated to thrive amid lucrative government investments and continuous technological innovation, leading to the creation of advanced chips that cater to diverse industry requirements.

Given the industry’s promising prospects, in this piece, we assessed three chip stocks to determine how they can help investors tap into the industry’s tailwinds.

While chip stock ChipMOS TECHNOLOGIES INC. (IMOS) could be a wise portfolio addition in 2024, I think Marvell Technology, Inc. (MRVL) and NVIDIA Corporation (NVDA) should be kept on one’s watchlist for better entry opportunities.

Before delving deeper into the fundamentals of the three stocks possessing substantial growth potential, let’s take a quick look at the industry landscape.

The semiconductor industry demonstrated remarkable resilience during the latter part of 2023. According to the Semiconductor Industry Association (SIA), global semiconductor sales stood at $526.80 billion in 2023, and market growth is expected to reach double digits in 2024, attesting to the industry’s strength in the current year.

Significant benefits, observed from recent subsidies announced by the Biden administration, have significantly boosted chip production within the U.S., helping the country maintain a competitive edge globally. The subsidies, a part of the Chips and Science Act, aim to allocate $53 billion to support the construction of the chip manufacturing plants. This move enables companies to develop finer semiconductors, thereby enhancing sectors like AI and military technology.

Recent mergers and acquisitions have significantly broadened the industry’s product range, reinforced the market presence of companies, and significantly augmented chip market growth.

Furthermore, expansions in cutting-edge logic and foundry capacity, applications in generative AI and high-performance computing (HPC), and resurgent end-demand for chips expand the opportunity window for further expansion in the chip industry.

The global semiconductor chip market is anticipated to reach $1.12 trillion, growing at a CAGR of 7.1% by 2032.

Considering these conducive trends, let’s look at the fundamentals of the three Semiconductor & Wireless Chip stocks, starting with number 3.

Stock #3: Marvell Technology, Inc. (MRVL)

MRVL provides data infrastructure semiconductor solutions, spanning the data center core to the network edge. The company develops, scales complex System-on-a-Chip architectures, integrating analog, mixed-signal, and digital signal processing functionality.

On January 31, MRVL paid its shareholders a quarterly dividend of $0.06 per share of common stock. Its annualized dividend rate of $0.24 per share translates to a dividend yield of 0.35% on the current share price. Its four-year average yield is 0.52%. The company has paid dividends for 11 consecutive years.

On December 6, 2023, MRVL delivered two optical PAM4 digital signal processors (optical DSPs), Perseus and Marvell Spica Gen2, to enable cloud operators to serve the exploding demand for AI, accelerated computing, and cloud services by optimizing the performance, bandwidth, and efficiency of the optical links connecting data infrastructure.

MRVL has long been at the forefront of expanding the applications and use cases for optical inside data centers. Perseus and Spica Gen2 represent the latest steps in that voyage.

MRVL’s trailing-12-month cash from operations of $1.18 billion is significantly higher than the industry average of $81.24 million. Its trailing-12-month EBITDA and levered FCF margins of 18.17% and 26.84% are 101.5% and 210.2% higher than the industry averages of 9.02% and 8.65%, respectively.

Over the past three and five years, its revenue grew at CAGRs of 23.9% and 15%, respectively, while its total assets grew at 26.1% and 16.2% CAGRs over the same periods.

For the fiscal third quarter that ended October 28, 2023, MRVL’s net revenue and non-GAAP gross profit stood at $1.42 billion and $859.20 million, respectively. For the same quarter, its non-GAAP net income and non-GAAP net income per share stood at $354.10 million and $0.41, respectively.

Moreover, for the same quarter, its cash and cash equivalents at end of period increased marginally year-over-year to $725.60 million.

Street expects MRVL’s revenue and EPS for the fiscal fourth quarter of 2024 (ended January 2024) to increase marginally year-over-year to $1.42 billion and $0.46, respectively. The company surpassed consensus revenue estimates in each of the trailing four quarters and consensus EPS estimates in three of the trailing four quarters, which is impressive.

The stock has gained 69.3% over the past nine months to close the last trading session at $69.37. Over the past year, it has gained 48.3%.

MRVL’s fundamentals are reflected in its POWR Ratings. The stock has an overall C rating, equating to Neutral in our proprietary rating system. The POWR Ratings are calculated by considering 118 distinct factors, with each factor weighted to an optimal degree.

The stock has a B grade for Growth and Sentiment. Within the 91-stock Semiconductor & Wireless Chip industry, it is ranked #61.

To see additional POWR Ratings for Value, Momentum, Stability, and Quality for MRVL, click here.

Stock #2: NVIDIA Corporation (NVDA)

NVDA provides graphics, and compute and networking solutions in the U.S., Taiwan, China, and internationally. The company has two segments: Compute & Networking and Graphics.

On February 6, NVDA collaborated with Cisco (CSCO) to deliver AI infrastructure solutions for the data center that are easy to deploy and manage, enabling the massive computing power that enterprises need to succeed in the AI era.

CSCO, with its industry-leading expertise in Ethernet networking and extensive partner ecosystem, together with NVDA, the inventor of the GPU that fueled the AI boom, share a vision and commitment to help customers navigate the transitions for AI with highly secure Ethernet-based infrastructure.

Working closely with CSCO, NVDA is making it easier than ever for enterprises to obtain the infrastructure they need to benefit from AI, the most powerful technology force.

Its annualized dividend rate of $0.16 per share translates to a dividend yield of 0.02% on the current share price. Its four-year average yield is 0.10%. NVDA’s dividend payments have grown at a 1% CAGR over the past five years.

NVDA’s trailing-12-month cash from operations of $18.84 billion is significantly higher than the industry average of $81.24 million. Likewise, its trailing-12-month ROCE, ROTC, and ROTA of 69.17%, 33.23%, and 34.88% are significantly higher than the industry averages of 1.45%, 2.46%, and 0.59%, respectively.

Over the past three and five years, its revenue grew at CAGRs of 44.8% and 29.3%, respectively, while its total assets grew at 26.3% and 31.7% CAGRs over the same periods.

For the fiscal third quarter that ended October 29, 2023, NVDA’s revenue and non-GAAP gross profit increased 205.5% and 308% year-over-year to $18.12 billion and $13.58 billion, respectively. Moreover, its free cash flow stood at $7.04 billion, up significantly from the prior-year quarter.

For the same quarter, its non-GAAP net income and non-GAAP net income per share stood at $10.02 billion and $4.02, up 588.2% and 593.1% from the year-ago quarter, respectively.

Street expects NVDA’s revenue and EPS for the fiscal fourth quarter of 2024 (ended January 2024) to increase 235.1% and 415.3% year-over-year to $20.27 billion and $4.53, respectively. The company surpassed consensus revenue and EPS estimates in each of the trailing four quarters.

The stock has gained 216.2% over the past year to close the last trading session at $700.99. Over the past nine months, it has gained 144.4%.

NVDA’s prospects are reflected in its POWR Ratings. The stock has an overall C rating, equating to Neutral in our proprietary rating system.

NVDA has an A grade for Growth and Sentiment and a B for Quality. Within the same industry, it is ranked #22.

Beyond what we’ve stated above, we have also rated the stock for Value, Momentum, and Stability. Get all ratings of NVDA here.

Stock #1: ChipMOS TECHNOLOGIES INC. (IMOS)

Headquartered in Hsinchu, Taiwan, IMOS researches, develops, manufactures, and sells high-integration and high-precision integrated circuits, and related assembly and testing services in the People’s Republic of China, Japan, Singapore, and internationally. It operates through Testing; Assembly; Testing and Assembly for LCD, OLED and Other Display Panel Driver Semiconductors; Bumping; and Others segments.

It pays an annual dividend of $1.50 per share, which translates to a dividend yield of 5.61% on the current share price. Its four-year average yield is 7.03%. IMOS’ dividend payments have grown at a 6.4% CAGR over the past three years.

IMOS’ trailing-12-month CAPEX/Sales of 16.48% is 590.7% higher than the industry average of 2.39%. Its trailing-12-month EBITDA and net income margins of 29.44% and 8.04% are 226.5% and 267.8% higher than the industry averages of 9.02% and 2.19%, respectively.

IMOS’ revenue and EBITDA grew at 2.6% and 6.8% CAGRs, respectively, over the past five years. Over the past three and five years, its tangible book value grew at CAGRs of 6.8% and 6.9%, respectively, while its levered free cash flow grew at 27.6% and 46.3% CAGRs over the same periods.

IMOS’ revenue for January 2024 amounted to TWD1.71 billion ($54.45 million), representing an increase of 28.4% year-over-year.

For the fiscal third quarter that ended September 30, 2023, IMOS’ revenue and gross profit increased 6.2% and 9.5% year-over-year to TWD5.58 billion ($177.90 million) and TWD889.08 million ($28.34 million), respectively.

For the same quarter, its profit for the period and earnings per share stood at TWD580.57 million ($18.50 million) and TWD0.80, respectively. As of September 30, 2023, IMOS’ total current assets stood at TWD20.08 billion ($639.86 million), compared to TWD16.01 billion ($510.19 million) as of September 30, 2022.

Street expects IMOS’ revenue for the fiscal first quarter ending March 2024 to increase 7.7% year-over-year to $161.36 million. The company surpassed consensus revenue estimates in three of the trailing four quarters.

The stock has gained 15% over the past three months to close the last trading session at $26.74. Over the past six months, it has gained 13.9%.

IMOS’ robust prospects are reflected in its POWR Ratings. The stock has an overall A rating, equating to a Strong Buy in our proprietary rating system.

IMOS has a B grade for Growth, Value, Momentum, and Stability. It is ranked first within the same industry.

Click here for the additional POWR Ratings for IMOS (Sentiment and Quality).

What To Do Next?

Get your hands on this special report with 3 low priced companies with tremendous upside potential even in today’s volatile markets:

3 Stocks to DOUBLE This Year >


NVDA shares were unchanged in premarket trading Thursday. Year-to-date, NVDA has gained 41.55%, versus a 4.79% rise in the benchmark S&P 500 index during the same period.


About the Author: Neha Panjwani

From her school days, Neha harbored a profound fascination for finance, a passion that steered her toward a career as an investment analyst following the completion of her bachelor’s degree in commerce. Currently enrolled in the CFA program, Neha is dedicated to further enriching her comprehension of investment fundamentals.Neha’s primary objective is to aid retail investors in discerning optimal investment opportunities by diligently evaluating crucial aspects of financial instruments, with a primary focus on stocks and ETFs. Her commitment lies in empowering individuals to make informed and strategic investment decisions in the dynamic world of finance.

More…

The post 3 Chip Stocks Poised for 2024 Growth appeared first on StockNews.com

https://www.entrepreneur.com/finance/3-chip-stocks-poised-for-2024-growth/469458


4 Wall Street Darling Gold Stocks Worth Buying

Escalating geopolitical tensions, economic uncertainty, and expectations of interest rate cuts would be positive drivers for gold this year, which is widely seen as a safe-haven asset. Amid this backdrop, it could be wise to invest in Wall Street darling gold stocks Alamos Gold (AGI), Centerra Gold (CGAU), Centamin (CELTF), and Dundee Precious Metals (DPMLF). Continue reading….

Gold is widely considered a safe-haven asset, given its ability to remain a reliable store of value. Despite a relatively slow start to the new year, after hitting a record annual price in 2023, analysts expect the precious metal to achieve another record in 2024, driven by enhanced geopolitical instability, hopes of lower interest rates, and monetary uncertainty.

Hence, fundamentally sound gold stocks Alamos Gold Inc. (AGI), Centerra Gold Inc. (CGAU), Centamin plc (CELTF), and Dundee Precious Metals Inc. (DPMLF) could be worth buying now for substantial gains.

Gold prices soared significantly in the last few months of 2023, fueled by increased central bank purchasing and rising investor concerns over the escalating geopolitical tensions due to the Israel-Hamas and Russia-Ukraine conflicts. Further, a declining U.S. dollar and expectations of rate cuts by the Fed drove gold prices, which hit a record high of $2,135.39/oz in December.

After increasing the Fed’s benchmark short-term rate to a 22-year high of 5.25%-5.5%, policymakers on the Federal Open Market Committee (FOMC) indicated at least three rate cuts this year, thanks to a slower pace of inflation. With gold prices hovering around $2,000/oz, another bullish run is anticipated for the yellow metal as interest rates begin to fall.

“Across all metals, we have the highest conviction on a bullish medium-term forecast for both gold and silver over the course of 2024 and into the first half of 2025, though timing an entry will continue to be critical,” said Gregory Shearer, Head of Base and Precious Metals Strategy at J.P. Morgan.

Shearer added, “At the moment, gold still appears quite rich relative to underlying rates and foreign exchange (FX) fundamentals, and still looks vulnerable to another modest retreat in the near-term, as Fed rate cut expectations are now running earlier than our forecasts.”

In addition to imminent interest rate cuts and increased geopolitical instability, central banks were a primary driver of gold prices last year and will continue to be in 2024. J.P Morgan Research estimates global purchases by the central bank for the year to hit about 950 tonnes, with China being a significant buyer.

According to J.P. Morgan, gold prices are expected to peak at $2,300/oz in 2025. This forecast assumes the Fed will deliver 125 basis points of rate cuts over the second half of 2024, pushing bullion prices to new nominal highs.

Moreover, Joni Tevas, precious metals strategist at UBS, expects gold prices to hit $2200/oz by the end of 2024. “We are expecting gold to be pushed higher by a Fed easing. Also this comes with a weaker dollar,” Teves said.

Investors’ interest in gold stocks is evident from the SPDR Gold Shares ETF’s (GLD) 8.5% gains over the past year.

In light of these encouraging trends, let’s look at the fundamentals of the four best Miners – Gold stocks, beginning with number 4.

Stock #4: Alamos Gold Inc. (AGI)

Based in Toronto, Canada, AGI engages in the acquisition, development, and extraction of precious metals. It mainly explores for gold and silver deposits. The company holds 100% interest in the Young-Davidson mine and Island Gold mine located in Ontario, Canada; the Mulatos mine situated in Sonora, Mexico; and the Lynn Lake project located in Manitoba, Canada.

On January 15, 2024, AGI entered a definitive agreement under which Alamos will acquire all the issued and outstanding shares of Orford Mining Corporation (ORM). This acquisition will consolidate Alamos’ existing ownership of Orford shares, through which the company will add to the highly prospective Qiqavik Gold Project, situated in Quebec, Canada.

In addition, Alamos will acquire interests in various exploration stage critical mineral and gold projects in Quebec, including West Raglan, the Joutel Properties, and Nunavik Lithium. This strategic acquisition of Orford aligns with AGI’s strategy of building out a pipeline of high-quality, long-term projects to complement its near-term organic growth projects in Canada.

On November 9, 2023, AGI announced outstanding results from its near-mine and regional exploration drilling program at Island Gold. The underground exploration drilling continues to extend high-grade gold mineralization across the Island Gold Deposit in the E1E and C-Zones and adjacent wall and footwall structures close to existing underground infrastructure.

Alamos finished 2023 with another solid quarter, achieving the top end of its increased annual guidance (515,000-530,000) with a record production of 529,300 ounces of gold. This represents a 15% increase from 2022, driven by low-cost growth from La Yaqui Grande. It sold 526,257 ounces of gold at an average realized price of $1,944 per ounce for record revenues of $1 billion.

AGI ended the year 2023 with nearly $225 million of cash and cash equivalents, an increase from $130 million at the end of 2022. Also, the company remains debt-free.

For the third quarter that ended September 30, 2023, AGI’s operating revenues increased 19.9% year-over-year to $256.20 million. Its earnings from operations grew 176.3% from the year-ago value to $82.60 million. The company’s adjusted net earnings and adjusted EPS rose 102.6% and 100% year-over-year to $54.50 million and $0.14, respectively.

Analysts expect AGI’s revenue for the fourth quarter (ended December 2023) to grow 12.8% year-over-year to $261.48 million. The company’s EPS for the same period is expected to increase 33.8% year-over-year to $0.12. Moreover, the company surpassed the consensus EPS estimates in all four trailing quarters, which is impressive.

AGI’s stock has gained 8.1% over the past six months and 18.4% over the past year to close the last trading session at $12.31.

AGI’s robust outlook is reflected in its POWR Ratings. The stock has an overall rating of B, which translates to Buy in our proprietary rating system. The POWR Ratings are calculated by considering 118 different factors, each weighted to an optimal degree.

AGI has a B grade for Sentiment, Growth, and Quality. It is ranked #11 out of 41 stocks within the Miners – Gold industry.

In addition to the POWR Ratings I’ve highlighted, you can access AGI’s Value, Momentum, and Stability ratings here.

Stock #3: Centerra Gold Inc. (CGAU)

Headquartered in Toronto, Canada, CGAU is a gold mining company that engages in the acquisition, exploration, development, and operation of gold and copper properties. It explores gold, copper, and molybdenum deposits. Its flagship projects include the 100% owned Mount Milligan gold-copper mine in British Columbia, Canada, and the Öksüt Gold Mine located in Turkey.

On November 3, 2023, CGAU announced that the Toronto Stock Exchange (TSX) acceptance of renewed normal course issuer bid (NCIB) to purchase for cancellation up to an aggregate of 18,293,896 common shares for the period beginning November 7, 2023, and ending on November 6, 2024.

These shares represent about 8.48% of Centerra’s total issued and outstanding common shares, or 10% of the public float. The company believes that the NCIB will provide it with a flexible tool to deploy a portion of its cash balance in accordance with its capital allocation framework.

On October 31, CGAU announced a quarterly dividend payment of C$0.07 ($0.05) per common share – nearly C$15 million ($11.10 million). The dividend was paid on November 29, 2023, to shareholders of record as of November 15, 2023. Its annual dividend of $0.20 translates to a yield of 3.80% at the prevailing share price. Its four-year average dividend yield is 2.82%.

CGAU’s revenue increased 92.1% year-over-year to $343.89 million in the third quarter that ended September 30, 2023. Its earnings from mine operations rose 251.5% year-over-year to $114.60 million. Its adjusted net earnings were $44.40 million, or $0.20 per share, compared to an adjusted net loss of $15.90 million, or $0.06 per share, in the prior year’s quarter, respectively.

For the fourth quarter that ended December 2023, Street expects CGAU’s revenue to increase 66.7% year-over-year to $347.13 million. Further, the company’s revenue and EPS for the fiscal year 2024 are estimated to grow 2.3% and 1,772.8% from the prior year to $1.13 billion and $0.52, respectively.

Additionally, CGAU has surpassed the consensus revenue estimates in each of the trailing four quarters.

CGAU’s shares have declined 6% over the past month to close the last trading session at $5.26.

CGAU’s POWR Ratings reflect its promising prospects. The stock has an overall grade of B, equating to a Buy in our proprietary rating system.

CGAU has an A grade for Growth and a B for Value and Quality. It is ranked #6 of 41 stocks within the Miners – Gold industry.

To see the other ratings of CGAU for Sentiment, Momentum, and Stability, click here.

Stock #2: Centamin plc (CELTF)

CELTF, together with its subsidiaries, is engaged in the exploration, mining, and development of precious metals in Egypt, Burkina Faso, Côte d’Ivoire, Jersey, the United Kingdom, and Australia. The company’s flagship asset is the Sukari Gold Mine project, which covers an area of nearly 160 square kilometers located in the Eastern Desert of Egypt.

On January 9, 2024, CELTF announced encouraging results of its maiden drill programme on the company’s Eastern Desert Exploration (EDX) landholding in Egypt. Its EDX blocks comprise 3,000 km2 of greenfield exploration tenements in Egypt’s Nubian Shield, a highly prospective geological belt that has not been explored using modern exploration methods.

The company further provided an update on the expected exploration programme for 2024. It includes delineating potential resources and drill targets in Egypt as part of its growth strategy, which has already raised pre-depletion Group reserves by 3.5Moz over the last three years.

On October 12, CELTF announced Sukari’s new life of mine plan that reestablishes it as a world tier-one gold asset. The plan forecasts long-term production above 500,000 ounces per year at all-in sustaining costs below $1,000 per ounce, underscoring the company’s commitment to maximizing free cash flow generation.

The new plan is not only a substantial improvement on what was priorly published, but it incorporates reduced operational risk and delivers enhanced carbon abatement. It also underpins CELTF’s strategy to optimize the value of Sukari as the foundation for growth and diversification with stakeholder returns.

In 2023, Centamin delivered another solid performance, underscored by its enhanced safety results. The company achieved 9.5 million hours worked at the Sukari gold mine with zero lost time injuries (LTIs). Its fourth-quarter gold production was 128,127 ounces, totaling 450,058 produced for 2023.

In addition, CELTF’s revenue was $265 million and $892 million for the fourth quarter and fiscal year 2023, respectively. The company’s cash and liquid assets stood at $153 million as of December 31, 2023, and total liquidity was $303 million.

For the fiscal year ending December 2024, the consensus revenue estimate of $952.89 million indicates an improvement of 7.6% year-over-year. Shares of CELTF have gained 12.6% over the past three months and 3.1% over the past six months to close the last trading session at $1.21.

CELTF’s robust prospects are reflected in its POWR Ratings. The stock has an overall rating of A, which translates to a Strong Buy in our proprietary rating system.

CELTF has a B grade for Value, Growth, Quality, and Stability. It is ranked #3 out of 41 stocks within the Miners – Gold industry.

To access the other CELTF ratings for Momentum and Sentiment, click here.

Stock #1: Dundee Precious Metals Inc. (DPMLF)

DPMLF engages in the acquisition of mineral properties and exploration, development, mining, and processing of precious metals. It operates a gold, copper, and silver mine located east of Sofia, Bulgaria; a gold mine located in southeastern Bulgaria, near the town of Krumovgrad; and a custom smelter situated in Tsumeb, Namibia. It is based in Toronto, Canada.

On January 24, 2024, DPMLF filed a technical report for its Čoka Rakita gold project in Serbia. The report’s purpose was to support the maiden Mineral Resource Estimate (MRE) for the Čoka Rakita gold project in eastern Serbia, as previously disclosed in the company’s news release dated December 11, 2023.

DPMLF, on December 11, announced a maiden MRE of 1.78 million ounces for its Čoka Rakita gold project, where DPMLF announced a high-grade discovery in January 2023. The Inferred MRE comprises gold within 9.79 million tonnes at a grade of 5.67 g/t for 1.78 million ounces of gold.

The initial MRE marks a significant milestone for DPMLF’s future growth and confirms Čoka Rakita’s potential as an attractive, high-quality gold project.

On December 18, 2023, DPMLF announced an acquisition of Osino Resources Corp. (OSI). This acquisition will add Osino’s high-quality, long-life Twin Hills open-pit gold project and an extensive exploration portfolio in Namibia to DPM’s existing portfolio of assets.

For the third quarter that ended September 30, 2023, DPMLF’s revenue increased 4.9% year-over-year to $135 million. Its earnings before income taxes were $34.50 million, up 164% year-over-year. Its adjusted net earnings and adjusted earnings per share came in at $27.13 million and $0.15, increases of 7.3% and 15.4% from the prior year’s quarter, respectively.

Furthermore, the company’s free cash flow rose 3.2% year-over-year to $44.61 million. Its current assets stood at $733.31 million as of September 30, 2023, compared to $610.92 million as of December 31, 2022.

Analysts expect DPMLF’s revenue for the fiscal year (ended December 2023) to increase 12.1% year-over-year to $638.70 million. The stock has plunged marginally over the past year to close the last trading session at $6.15.

DPMLF’s sound fundamentals are reflected in its POWR Ratings. The stock has an overall A rating, equating to a Strong Buy in our proprietary rating system.

DPMLF has an A grade for Quality and Value. The stock also has a B grade for Stability. It is ranked #2 among 42 stocks within the Miners – Gold industry.

Click here for the additional POWR Ratings for DPMLF (Growth, Momentum, and Sentiment).

What To Do Next?

Discover 10 widely held stocks that our proprietary model shows have tremendous downside potential. Please make sure none of these “death trap” stocks are lurking in your portfolio:

10 Stocks to SELL NOW! >


AGI shares were unchanged in premarket trading Wednesday. Year-to-date, AGI has declined -6.38%, versus a 3.93% rise in the benchmark S&P 500 index during the same period.


About the Author: Mangeet Kaur Bouns

Mangeet’s keen interest in the stock market led her to become an investment researcher and financial journalist. Using her fundamental approach to analyzing stocks, Mangeet’s looks to help retail investors understand the underlying factors before making investment decisions.

More…

The post 4 Wall Street Darling Gold Stocks Worth Buying appeared first on StockNews.com

https://www.entrepreneur.com/finance/4-wall-street-darling-gold-stocks-worth-buying/469396


Are Stocks Stuck til Summer?

How high can the S&P 500 (SPY) go without the Fed lowering rates? Steve Reitmeister says that 5,000 is a lid on stock prices with likely pullback, trading range and sector rotation to follow. Why is that? Read on below for more.

Last week’s headline exclaimed “5,000 or Bust!”. I still believe that’s true as its easily within reach from today’s close at 4,954 (SPY).

The problem is that I don’t expect much more upside from there until the Fed starts lowering rates. If that isn’t coming in March…then how long do we need to wait???

That discussion will be at the heart of today’s Reitmeister Total Return commentary. Plus, we will plot a course to profits even if the overall market is lackluster for a while.

Market Commentary

Chairman Powell threw investors for a loop last Wednesday when he made it clear that rate cuts are highly unlikely to start at the March 21st meeting. Since then, stocks have been more volatile and less bullish.

I have even seen some market commentators calling for a nasty correction or worse. That doesn’t seem necessary. Kind of like when you pull your car up to a red light that you know at some point is going to turn green.

You don’t get out of your car and sit on the curb. Instead, you keep your eyes straight ahead and ready to step on the gas pedal once again.

When will that light for stocks turn green again?

Unfortunately, the combination of Powell’s speech and 3 strong economic reports (Government Jobs, ISM Mfg, ISM Services) pushes it out to the May 1st meeting at a minimum. Right now, investors put 65% odds of that happening. And 97% chance of cuts by the time of the June 28th meeting.

These outcomes are most certainly possible. However, I sense estimates of the rate cuts are a tad too optimistic given the facts in hand. And let’s not forget the immense patience the Fed has exhibited to date leading investors to more than once push out the date of the first cut.

Until that first cut is in hand seems like the perfect setting for a trading range scenario where 5,000 will provide a pretty tight lid on stock prices. The downside is likely 4,800 which was a previous point of stubborn resistance before the recent break above on January 18th.

Stocks never really idle in these trading ranges. More likely it is a volatile time with constant sector rotations and changes in market leadership.

Often the strongest groups becomes the weakest and the weakest becomes the strongest. If that is the case, then let’s check out what sectors are hot and not so far in 2024:

Also wise to check in with the year to date view based upon market cap:

To no one’s surprise mega cap tech stocks are soaking up most of the gains with other groups languishing. This was the picture for the stock market for much of 2023 until the script got flipped in the latter stages of the year.

I sense a similar change of leadership is going to take place at some point this year. Trading ranges offer as good of an opportunity of any for that changing of the guard. Meaning this all may be soon at hand.

So yes, in my Reitmeister Total Return portfolio I continue to have a small stock bias. But not just any small caps will do. They need to show operational excellence as best expressed through a beat and raise earnings report this quarter.

On top of that pullbacks and sector rotation periods usually have a greater eye towards value than during the big bull runs. Add this altogether and its prime time for POWR Rating stocks.

That being consistent growth companies exhibiting operational excellence while trading at reasonable prices. This has always been the most consistent path to stock market profits and no reason for that not to be the case in 2024.

What are my favorite POWR Ratings stocks now?

Find 12 of them in the next section…

What To Do Next?

Discover my current portfolio of 12 stocks packed to the brim with the outperforming benefits found in our exclusive POWR Ratings model. (Nearly 4X better than the S&P 500 going back to 1999)

This includes 5 under the radar small caps recently added with tremendous upside potential.

Plus I have 1 special ETF that is incredibly well positioned to outpace the market in the weeks and months ahead.

This is all based on my 43 years of investing experience seeing bull markets…bear markets…and everything between.

If you are curious to learn more, and want to see these lucky 13 hand selected trades, then please click the link below to get started now.

Steve Reitmeister’s Trading Plan & Top Picks >

Wishing you a world of investment success!


Steve Reitmeister…but everyone calls me Reity (pronounced “Righty”)
CEO, StockNews.com and Editor, Reitmeister Total Return


SPY shares were unchanged in after-hours trading Tuesday. Year-to-date, SPY has gained 3.93%, versus a % rise in the benchmark S&P 500 index during the same period.


About the Author: Steve Reitmeister

Steve is better known to the StockNews audience as “Reity”. Not only is he the CEO of the firm, but he also shares his 40 years of investment experience in the Reitmeister Total Return portfolio. Learn more about Reity’s background, along with links to his most recent articles and stock picks.

More…

The post Are Stocks Stuck til Summer? appeared first on StockNews.com

https://www.entrepreneur.com/finance/are-stocks-stuck-til-summer/469378


3 Smart Oil & Gas Stocks Serving Gains

Growing energy demand globally combined with supply disruptions aggravated by an uncertain geopolitical backdrop could drive crude oil prices higher. Thus, fundamentally sound oil & gas stocks MPLX (MPLX), Repsol (REPYY), and Hess Midstream Partners (HESM) could be smart investments now for substantial gains. Read on….

The wide application of crude oil and gas in diverse sectors worldwide, expansion of the petrochemical industry, and a surge in investments for oil and gas exploration would create numerous growth opportunities for oil and gas companies. Also, the possibility of higher oil prices due to robust demand and tight supplies could impact the industry positively.

Given the industry’s bright prospects, it could be wise to consider investing in fundamentally solid oil and gas stocks MPLX LP (MPLX), Repsol S.A. (REPYY), and Hess Midstream Partners LP (HESM) for potential gains.

The global oil and gas segment plays and holds a vital role in the world economy as it supplies essentials like energy resources to various industries and households. The market encompasses vast operations like exploration, production, refining, and distribution of crude oil and natural gas. The sector has bloomed and transformed drastically in recent years.

The oil and gas market size is expected to grow from $71.19 trillion in 2023 to $7.63 trillion in 2024 at a CAGR of 6.1%. Furthermore, the market is estimated to reach $9.35 trillion by 2028, growing at a CAGR of 5.2%.

Key trends such as industry players focusing on emission reduction solutions, a shift toward digital technologies, the rising popularity of reservoir modeling, and the adoption of advanced drilling solutions would boost the oil and gas industry’s growth and profitability.

According to the U.S. Energy Information Administration (EIA), U.S. crude oil production is forecasted to reach 13.2 million barrels per day (b/d) in 2024 and 13.4 million b/d in 2025. Both these estimates mark new records. Also, increases in well efficiency will positively accelerate production growth over the next two years.

In addition, EIA projects that Brent crude oil prices will average $82 per barrel (b) this year and $79/b in 2025, nearing the 2023 average of $82/b. OPEC+ production restraint is expected to keep prices near current levels. EIA forecasted that OPEC+ crude oil production will average 36.4 million (b/d) in the current year and 37.2 million b/d in 2025.

The supply disruptions due to escalating tensions in the Middle East and attacks on ships in the Red Sea further increase the possibility of higher crude oil prices.

Given the backdrop, investing in quality oil and gas stocks MPLX, REPYY, and HESM could be wise for solid gains.

Let’s discuss the fundamentals of these stocks in detail:

MPLX LP (MPLX)

MPLX owns and operates midstream energy infrastructure and logistics assets. The company functions in two segments: Logistics and Storage; and Gathering and Processing. It is involved in the gathering, processing, and transportation of natural gas; gathering, transportation, fractionation, exchange, storage, and marketing of natural gas liquids.

On January 24, 2024, MPLX’s Board of Directors declared a quarterly cash distribution of $0.85 per common unit for the fourth quarter of 2023. The distribution will be paid on February 14, 2024, to common unitholders of record as of February 5, 2024.

MPLX pays an annual distribution of $3.40 per unit, which translates to a yield of 9.08% on the current share price. Its four-year average yield is 11.19%. The company’s dividend payouts have grown at a CAGR of 5.7% over the past three years. MPLX has raised its dividends for ten consecutive years.

The company continues to advance its Permian growth strategy through the acquisition of the remaining 40% interest in a gathering and processing joint venture for nearly $270 million. This transaction closed in December 2023.

MPLX’s trailing-12-month gross profit margin and EBIT margin of 56.01% and 39.74% are higher than the respective industry averages of 46.47% and 21.44%. Likewise, the stock’s trailing-12-month EBITDA margin of 51.16% is 44.8% higher than the industry average of 35.32%.

During the fourth quarter that ended December 31, 2023, MPLX’s total revenue and other income increased 11.4% year-over-year to $2.97 billion. Its income from operations was $1.37 billion, up 29.7% from the prior year’s quarter. Also, net income attributable to MPLX grew 39% and 41% year-over-year to $1.13 billion and 1.10 per limited partner unit, respectively.

In addition, the company’s adjusted EBITDA rose 11.6% from the year-ago value to $1.62 billion. As of December 31, 2023, its cash and cash equivalents stood at $1.05 billion, compared to $238 million as of December 31, 2022.

Analysts expect MPLX’s revenue and EPS for the first quarter (ending March 2024) to increase 6.9% and 8.1% year-over-year to $2.90 billion and $0.98, respectively. Moreover, the company surpassed the consensus EPS estimates in each of the trailing four quarters.

MPLX’s stock has surged 6.4% over the past six months and 7.7% over the past year to close the last trading session at $37.43.

MPLX’s robust outlook is reflected in its POWR Ratings. The stock has an overall rating of A, which translates to a Strong Buy in our proprietary rating system. The POWR Ratings are calculated by considering 118 different factors, each weighted to an optimal degree.

The stock has a B grade for Quality, Stability, Sentiment, Growth, and Momentum. It has topped among the 25 stocks in the A-rated MLPs – Oil & Gas industry.

Click here to access all MPLX ratings.

Repsol, S.A. (REPYY)

Headquartered in Madrid, Spain, REPYY is a global integrated energy company. It operates through three segments – Upstream; Industrial; and Commercial and Renewables. The company engages in the exploration, development, and production of crude oil and natural gas reserves; and refining activities and petrochemicals business.

On January 3, 2024, REPYY began producing electricity at Sigma, its first renewable project in Andalusia and the third project that the company brought into operation in Spain. Located in Jerez de la Frontera (Cádiz), it is made up of five solar plants with a total installed capacity of 204 MW.

With an investment of nearly €150 million ($161.75 million), the Arco 1, 2, 3, 4, and 5 make up the Sigma project. Also, its construction has led to the creation of more than 500 jobs and will generate enough electricity for 43,000 homes. Such facilities position Repsol closer to its strategic goal of having 6 GW of installed capacity by 2025.

On December 13, 2023, REPYY received the first shipment of used cooking oil to be used as a raw material in Spain’s first renewable fuels plant. The ship unloaded the first 7,500 tons of used cooking oil at the Port of Cartagena. From here, the used cooking oil will be transformed into renewable fuels at REPYY’s industrial complex.

REPYY is transforming its industrial complexes into multi-energy centers with extensive capacity to produce fuels with a low or zero carbon footprint.

For the third quarter that ended September 30, 2023, REPYY’s revenue from operating activities increased 18.9% from the prior quarter to €16.26 billion ($17.54 billion). Its operating income grew 48% quarter-over-quarter to €1.68 billion ($1.81 billion). The company’s adjusted income came in at €1.10 billion ($1.18 billion), up 32.8% from the prior quarter.

Furthermore, the company’s earnings per share grew 365.2% quarter-on-quarter to €1.07. Its EBITDA came in at €2.89 billion ($3.12 billion), an increase of 79.9% from the previous quarter.

Shares of REPYY have gained 2.9% over the past nine months to close the last trading session at $14.50.

REPYY’s POWR Ratings reflect its promising prospects. The stock has an overall rating of A, equating to a Strong Buy in our proprietary rating system.

The stock has a B grade for Growth, Value, Stability, and Momentum. REPYY is ranked #3 of 43 stocks within the B-rated Foreign Oil & Gas industry.

To see additional POWR Ratings of REPYY for Quality and Sentiment, click here.

Hess Midstream Partners LP (HESM)

HESM owns, develops, operates, and acquires midstream assets. It operates through three segments: Gathering; Processing and Storage; and Terminaling and Export. The company owns natural gas gathering and compression systems, crude oil gathering systems, and produced water gathering and disposal facilities.

On January 29, HESM announced that the Board of Directors of its general partner declared a quarterly cash distribution of $0.6343 per Class A share for the fourth quarter that ended December 31, 2023. The distribution represents an increase of about 2.7% in the quarterly distribution per Class A share for the fourth quarter of 2023 compared to the third quarter of 2023.

HESM pays an annual distribution of $2.54 per share, which translates to a yield of 7.41% on the current share price. Its four-year average yield is 8.09%. The company’s dividend payouts have grown at a CAGR of 11.8% over the past five years. HESM has raised its dividends for six consecutive years.

“We continue to execute on our differentiated financial strategy, prioritizing consistent and ongoing return of capital to our shareholders,” said Jonathan Stein, Chief Financial Officer of Hess Midstream. The company targets at least 5% growth in annual distributions per Class A share through 2025.

HESM’s trailing-12-month EBITDA margin and gross profit margin of 74.62% and 76.79% are 109.7% and 65.9% higher than the industry averages of 35.59% and 46.28%, respectively. Further, the stock’s trailing-12-month ROTC of 14.57% is 60.8% higher than the industry average of 9.06%.

For the fourth quarter of fiscal 2023, HESM’s net revenue increased 13.3% year-over-year to $356.50 million. Its income from operations grew 7.0% from the year-ago value to $210.10 million. The company’s net income came in at $152.80 million, or $0.55 per Class A share, up 2% and 12.2% from the prior year’s quarter, respectively.

In addition, HESM’s adjusted EBITDA increased 7.7% year-over-year to $264.10 million. The company’s adjusted free cash flow came in at $146.60 million, an increase of 1.7% from the prior year’s quarter.

As per fiscal 2024 guidance, the company expects full-year net income to be between $670 million and $720 million, and its adjusted EBITDA is expected to be between $1.125 billion and $1.17 billion.

Further, in 2024, HESM anticipates generating adjusted free cash flow of between $685 million and $735 million and nearly $115 million at the midpoint of guidance after funding distributions that are targeted to grow at least 5% per annum on a distribution per Class A share basis.

Street expects HESM’s revenue for the first quarter (ending March 2024) to increase 15.6% year-over-year to $352.49 million, while its EPS is expected to grow 36.4% year-over-year to $0.64, respectively. For the fiscal year 2024, the company’s revenue and EPS are expected to grow 11.7% and 32.9% year-over-year to $1.51 billion and $2.76, respectively.

HESM’s shares have gained 12.6% over the past six months and 13.6% over the past year to close the last trading session at $34.23.

HESM’s sound fundamentals are reflected in its POWR Ratings. The stock has an overall rating of B, which translates to a Buy in our proprietary rating system.

The stock has a B grade for Value, Growth, Momentum, and Quality. Within the A-rated MLPs – Gas industry, HESM has topped among two stocks.

In addition to the POWR Ratings we’ve stated above, we also have HESM ratings for Stability and Sentiment. Get all HESM ratings here.

What To Do Next?

Get your hands on this special report with 3 low priced companies with tremendous upside potential even in today’s volatile markets:

3 Stocks to DOUBLE This Year >


MPLX shares fell $0.03 (-0.08%) in premarket trading Monday. Year-to-date, MPLX has gained 4.21%, versus a 4.01% rise in the benchmark S&P 500 index during the same period.


About the Author: Mangeet Kaur Bouns

Mangeet’s keen interest in the stock market led her to become an investment researcher and financial journalist. Using her fundamental approach to analyzing stocks, Mangeet’s looks to help retail investors understand the underlying factors before making investment decisions.

More…

The post 3 Smart Oil & Gas Stocks Serving Gains appeared first on StockNews.com

https://www.entrepreneur.com/finance/3-smart-oil-amp-gas-stocks-serving-gains/469281


BABA and SOHU – Why These 2 China Stocks Are Hot Picks for 2024

The rise in online services and e-commerce bodes well for China’s economic outlook in 2024 and beyond. Many experts are optimistic about this trend. Moreover, the potential fiscal reform in the country should bode well for its technology companies. In this context, let’s explore the fundamentals of Amazon.com (AMZN) and Alibaba Group Holding (BABA) to understand why these stocks are worth considering for investment now….

Despite challenges like deflation, high debt, property downturn, and flat trade, China’s economy surpassed the 5% target last year. Experts are optimistic for 2024, expecting China to play a major role in global growth, boosted by the widespread use of digital technologies and increased internet usage. With the help of fiscal support, China could aim for 5% growth in the year ahead.

Therefore, fundamentally strong China stocks Sohu.com Limited (SOHU) and Alibaba Group Holding Limited (BABA) could be ideal buys now.

Before diving deeper into the fundamentals of these stocks, let’s discuss how China’s economic progress could support the country’s key companies.

Despite weak sentiment and economic uncertainty affecting consumption and investment growth, Chinese think tanks foresee real potential in 2024. Upbeat economic growth driven by domestic consumption and investment, though slightly dampened by exports, underscores China’s promising trajectory.

China’s industrial output surged by 6.8% year-over-year in December 2023, outpacing November’s 6.6%, while retail sales growth lagged expectations, prompting potential policy easing measures. The Chinese Academy of Sciences anticipates 5.3% economic growth in 2024, exceeding the World Bank’s projection of 4.5%.

Despite forecasts of slower growth, China’s economy remains robust in 2024, with major investment banks projecting a 4.6% increase in real GDP. Though slower than previous years, China’s resilience amid pandemic challenges and real estate market slumps underscores its enduring economic strength.

This optimism stems from a robust new growth engine, marked by a growing middle class, evolving consumption patterns, increased greenfield investment, and the integration of AI and data into the economic landscape.

Considering these encouraging trends, let’s discuss the fundamentals of the two China stock picks, starting with the second choice.

Stock #2: Sohu.com Limited (SOHU)

Headquartered in Beijing, China, SOHU provides online media, video, and game products and services on PCs and mobile devices in China. The company offers online news, information, and content services through mobile phone applications, as well as online video content and services through mobile phone applications and a video application for PCs.

On November 11, 2023, SOHU announced a share repurchase program of up to $80 million of the company’s outstanding ADSs over the next two years. The ADSs will be purchased at prevailing market prices at Sohu’s management’s discretion, following Rule 10b-18 and Rule 10b5-1 under the Securities Exchange Act of 1934.

In terms of the trailing-12-month gross profit margin, SOHU’s 76.17% is 55.2% higher than the 49.07% industry average.

SOHU’s total revenues for the third quarter (ended on September 30, 2023) increased 4% year-over-year to $145.43 million. Its non-GAAP operating profit rose 6.1% from the previous quarter to $52 million. The company’s net income attributable to SOHU stood at $21.37 million, or $0.63 per ADS, compared to a net loss of $21.20 million or $0.62 per ADS in the year-ago quarter, respectively.

Over the past three months, SOHU’s stock has gained 16.1% to close the last trading session at $9.76.

SOHU’s POWR Ratings reflect a positive outlook. It has an overall rating of B, equating to a Buy in our proprietary rating system. The POWR ratings assess stocks by 118 different factors, each with its own weighting.

It has a B grade for Value and Sentiment. It is ranked #19 out of 41 stocks in the B-rated China industry. To see SOHU’s Growth, Momentum, Stability, and Quality ratings, click here.

Stock #1: Alibaba Group Holding Limited (BABA)

Based in Hangzhou, People’s Republic of China, BABA provides technology infrastructure and marketing reach to help merchants, brands, retailers, and other businesses engage with their users and customers internationally. The company operates through seven segments: China Commerce, International Commerce, Local Consumer Services, Cainiao, Cloud, Digital Media and Entertainment, and Innovation Initiatives and Others.

In terms of the trailing-12-month EBIT margin, BABA’s 14.66% is 94% higher than the 7.56% industry average. Its 14.50% trailing-12-month net income margin is 204.7% higher than the 4.76% industry average. Likewise, the stock’s 3.75% trailing-12-month Capex/Sales is 21.8% higher than the 3.08% industry average.

For the fiscal second quarter that ended September 30, 2023, BABA’s revenue increased 8.5% year-over-year to $30.81 billion. Its non-GAAP net income and non-GAAP earnings per ADS increased 18.8% and 21% over the prior-year quarter to $5.51 billion and $2.14, respectively. Moreover, its adjusted EBITDA came in at $6.75 billion, up 13.7% year-over-year.

Street expects BABA’s revenue for the quarter ended December 31, 2023, to increase 1.4% year-over-year to $36.39 billion, and its EPS for the quarter ending March 31, 2024, is expected to increase 9.1% year-over-year to $1.66. It surpassed the Street EPS estimates in all of the trailing four quarters. Over the past month, the stock has declined 3.9% to close the last trading session at $71.85.

BABA’s POWR Ratings reflect solid prospects. It has an overall rating of B, which translates to a Buy in our proprietary rating system.

It is ranked #14 in the same industry. It has a B grade for Momentum and Quality. Click here to see BABA’s Growth, Value, Stability, and Sentiment ratings.

What To Do Next?

Get your hands on this special report with 3 low priced companies with tremendous upside potential even in today’s volatile markets:

3 Stocks to DOUBLE This Year >


BABA shares rose $0.87 (+1.21%) in premarket trading Monday. Year-to-date, BABA has declined -7.30%, versus a 4.01% rise in the benchmark S&P 500 index during the same period.


About the Author: Abhishek Bhuyan

Abhishek embarked on his professional journey as a financial journalist due to his keen interest in discerning the fundamental factors that influence the future performance of financial instruments.

More…

The post BABA and SOHU – Why These 2 China Stocks Are Hot Picks for 2024 appeared first on StockNews.com

https://www.entrepreneur.com/finance/baba-and-sohu-why-these-2-china-stocks-are-hot-picks-for/469280


Which Financial Stock Holds the Earnings Edge – First American Financial (FAF) or Moody’s Corporation (MCO)?

Amid the ongoing demand for financial services and an increasing incorporation of digital technology, the financial industry presents a strong and promising outlook. The prevailing high-interest rate environment provides further stimulus to the financial services companies. With financial services companies Moody’s (MCO) and First American Financial (FAF) set to unveil their quarterly results soon, let’s compare the financial services stocks and ascertain which of the two holds the earnings edge. Read on to find out….

The financial services sector is poised to undergo significant expansion due to substantive demand among enterprises and the rising integration of cutting-edge technology. Banks, insurance firms, brokerage entities, and money management institutions could further benefit from the high-interest rate environment.

This article evaluates and compares the fundamentals of financial services companies, Moody’s Corporation (MCO) and First American Financial Corporation (FAF), to ascertain which one is better equipped to capitalize on the flourishing industry momentum as these stocks prepare for their quarterly earnings releases.

Historically, the financial services sector has often been a catalyst for progression, helping individuals and organizations navigate socioeconomic shifts. Service providers within the financial services industry, such as insurance, investment management, banking, and capital markets, are well-positioned to remain resilient and experience considerable long-term growth, fueled by escalating demand for financial services from enterprises.

The interest rates, currently set between 5.25%-5.5%, are anticipated to remain elevated for some more months before projected rate cuts commence. The revenue of the financial services industry positively correlates with higher interest rates. High-interest conditions compel borrowers to pay more interest, thereby creating a potential avenue for increased revenue for these service entities.

Furthermore, the continued digitalization of financial services like credit card processing, easy credit, insurance coverage, tax accounting methodologies, wealth management, mortgage financing, and ‘Buy Now Pay Later’ (BNPL) solutions have induced a paradigm shift within the finance sector.

From a technological perspective, financial companies anticipate leveraging cutting-edge GenAI technology for improved fraud detection and insightful behavioral analysis of customers. This development can, in turn, bolster sector growth even further.

The financial services market is expected to grow from $31.14 trillion in 2023 to $33.54 trillion in 2024 at a CAGR of 7.7%. The market is expected to witness stronger growth, reaching $44.93 trillion in 2028, growing at a CAGR of 7.6%.

With a market cap of over $73 billion, MCO operates as an integrated risk assessment firm worldwide. Meanwhile, FAF, with a market cap of $6.25 billion, is a premier provider of title, settlement, and risk solutions for real estate transactions and the leader in the digital transformation of its industry.

The fourth-quarter results for both MCO and FAF are due for revelation soon. MCO’s revenue and EPS are expected to increase 15.3% and 44.9% year-over-year to $1.49 billion and $2.32, in the fiscal fourth quarter ending December 2023, while FAF’s revenue and EPS are expected to decline 10% and 39% year-over-year to $1.52 billion and $0.82, respectively.

In terms of price performance, MCO has gained 30.7% over the past nine months, while FAF gained 5.9%. However, over the past year, MCO has gained 21.3% to close the last trading session at $399.60, whereas FAF has lost 5% to close the last trading session at $60.57. MCO is a clear winner here.

Here are the reasons why I think MCO might perform better in the near term:

Recent Financial Results

MCO’s revenue for the fiscal third quarter that ended September 30, 2023, came at $1.47 billion, up 15.5% year-over-year, while its adjusted operating income grew 32.2% from the prior-year quarter to $657 million.

The company’s adjusted net income and adjusted EPS rose 31.5% and 31.4% from the prior-year quarter to $447 million and $2.43, respectively. For the nine months that ended September 30, 2023, its free cash flow increased 65.3% year-over-year to $1.48 billion.

On the contrary, FAF’s net sales came to $1.48 billion during the fiscal third quarter ended September 30, 2023, reflecting a decline of 18.8% year-over-year. Adjusted net income and adjusted net income per share stood at $128.20 million and $1.22, down 27.5% and 27.4%, respectively, from the year-ago quarter.

However, FAF’s cash and cash equivalents, as of September 30, 2023, stood at $1.58 billion, compared to $1.22 billion as of December 31, 2022.

Past And Expected Financial Performance

MCO’s revenue has grown at 4.7% CAGRs over the past five years, while FAF’s revenue has grown at 1.5% CAGRs over the same period. MCO’s EBITDA and EBIT grew at 2.6% and 1.3% CAGRs, respectively, over the past five years, while FAF’s EBITDA and EBIT grew at negative 5.8% and 9.5% CAGRs, respectively.

Analysts expect MCO’s revenue to increase 9% year-over-year to $1.60 billion in the fiscal first quarter ending March 2024, while EPS is expected to come at $2.82. The company surpassed consensus revenue and EPS estimates in each of the trailing four quarters, which is impressive.

FAF’s revenue is expected to decline 1.2% year-over-year to $1.43 billion, while EPS is expected to rise 47.2% year-over-year to $0.72 in the fiscal first quarter ending March 2024. The company surpassed consensus EPS estimates in three of the trailing four quarters while failing to surpass consensus revenue estimates in three of the trailing four quarters.

Profitability

MCO’s trailing-12-month EBITDA margin of 42.80% is higher than FAF’s 9.66%. In addition, MCO’s trailing-12-month Return on Total Capital of 12.11% is higher than FAF’s 3.91%. Moreover, MCO’s trailing-12-month Return on Total Assets of 11.87% is higher than FAF’s 2.22%.

Thus, MCO seems more profitable.

POWR Ratings

MCO has an overall rating of B, which equates to a Buy in our proprietary POWR Ratings system. Conversely, FAF has an overall rating of C, translating to a Neutral. The POWR Ratings are calculated considering 118 different factors, with each factor weighted to an optimal degree.

Our proprietary rating system also evaluates each stock based on eight distinct categories. MCO’s Quality grade of B is in sync with its higher-than-industry profitability metrics. Its trailing-12-months EBIT margin of 36.43% is 71.9% higher than the industry average of 21.20%. Moreover, its trailing-12-month CAPEX/Sales of 4.84% is 138.8% higher than the industry average of 2.03.

Conversely, FAF’s C grade for Quality justifies its mixed profitability. Its trailing-12-month EBIT margin of 6.76% is 68.1% lower than the industry average of 21.20%. However, its trailing-12-month CAPEX/Sales of 4.41% is 117.7% higher than the industry average of 2.03.

Within the Financial Services (Enterprise) industry, MCO is ranked #12 out of 100 stocks, while FAF is ranked #41.

Beyond what we’ve stated above, we have also rated both stocks for Growth, Value, Momentum, Stability, and Sentiment. Click here to view MCO ratings. Get all FAF ratings here.

The Winner

As we delve deeper into the digital age, observing a marked surge in advanced technologies, the financial services industry finds itself on the cusp of unprecedented growth and expansion. High interest rates are set to further bolster this performance, potentially boosting profitability for those within the sector. Industry players MCO and FAF could benefit from these industry tailwinds.

However, it is MCO stands out notably due to its profitability, promising outlook, vigorous financial health, and encouraging bottom-line forecasts, making it the more advantageous pick now.

Our research shows that the odds of success increase when one invests in stocks with an Overall Rating of Strong Buy or Buy. View all the top-rated stocks in the Financial Services (Enterprise) here.

What To Do Next?

Get your hands on this special report with 3 low priced companies with tremendous upside potential even in today’s volatile markets:

3 Stocks to DOUBLE This Year >


MCO shares closed at $399.60 on Friday, down $-2.94 (-0.73%). Year-to-date, MCO has gained 2.31%, versus a 4.01% rise in the benchmark S&P 500 index during the same period.


About the Author: Sristi Suman Jayaswal

The stock market dynamics sparked Sristi’s interest during her school days, which led her to become a financial journalist. Investing in undervalued stocks with solid long-term growth prospects is her preferred strategy. Having earned a master’s degree in Accounting and Finance, Sristi hopes to deepen her investment research experience and better guide investors.

More…

The post Which Financial Stock Holds the Earnings Edge – First American Financial (FAF) or Moody’s Corporation (MCO)? appeared first on StockNews.com

https://www.entrepreneur.com/finance/which-financial-stock-holds-the-earnings-edge-first/469235


Did the Fed Put a Lid on Stock Prices?

The S&P 500 (SPY) was off to another great start in 2024. That was until Chairman Powell grabbed the mic at his January 31st press conference. And things went south in a hurry. Why is that? And what does that mean for stock investors in the days and weeks ahead? Investment expert Steve Reitmeister shares his views along with this top 13 trades in the commentary that follows below.

Stocks were merrily on their way towards a rendezvous with new all time highs at 5,000 before Fed Chairman Powell took the podium on Wednesday afternoon. At first investors liked what they heard with some buoyancy in stock prices.

But once Powell made it clear that he sees rate cuts as highly unlikely at the next meeting in March, then stock prices tumbled into a -1.61% loss for the S&P 500 (SPY).

Gladly it was not all bad. In fact, I would say that it was a bit of an overreaction.

So, let’s spend our time today digging into the key Fed statements and what that means for the market in the days and weeks ahead.

Market Commentary

I religiously watch the Fed press conferences which commences 30 minutes after they release their rate hike decision. The prepared statements typically reflect the same sentiment as found in the aforementioned press release.

The key to the event always resides in the Q&A section. These unprepared remarks by Powell reveal much more insight. Beyond the words is also the body language and emphasis from the Fed chairman. You can instantly see the market’s reaction to every positive and negative comment.

The net result of the January 31st press conference was a near free fall in stock prices. Beyond the -1.61% we see a much more painful -2.45% slashing of small caps in the Russell 2000 index.

Why?

It pretty much comes down to one vital sentence:

“I don’t think it’s likely that the committee will reach a level of confidence by the time of the March meeting to identify March is the time to do that (start cutting rates).”

With that the odds of a March rate cut were lowered…short term bond rates went higher…and stocks imploded.

Gladly on Thursday cooler heads prevailed. That’s because Powell also made it clear that the committee still thinks that 3 rate cuts are on the way this year. So shifting out expectations for the first cut to May 1st is not so bad in the grand scheme of things.

Net-net, the 10 year Treasury rate has dropped back under 4% and stock prices are back on the upswing with 5,000 looming large on the horizon.

Now let’s get into some of the granular detail from Powell’s press conference as there are some very interesting concepts to share. In general, I am paraphrasing what was said to get straight to the point.

(Here are the key ideas from the prepared statement section)

Inflation still too high and thus path forward is uncertain.

Policy is well into restrictive territory. And thus, doing well on dual mandate to get inflation back down to 2% goal while also achieving maximum employment.

Reversing policy too soon would risk re-igniting inflation which is bad news for the average consumer.

Reversing too late has downside risks to the economy and the labor market.

They are acutely aware of the balancing act required and continue to do what they believe is necessary.

(After Powell’s prepared statements investors are realizing it’s the same old song from the Fed and that they overreacted to some of the language in the press release. With that bond rates fell and stock prices climbed temporarily.

Now onto the Q&A portion which, as noted above, typically unlocks much more valuable insights.)

The committee is still all agreeing to cut rates. And 3 times this year is the most recent prediction. The key question is WHEN to start the cuts?

Would a weakening in the employment picture hasten your desire to cut rates? Yes!

But right now employment is still a bit strong…and that provides still too much wage inflation. Less of a problem than before…but still too high.

You didn’t agree that soft landing has happened. But would you say that a hard landing is off the table?

Executive Summary from Powell: Growth is solid to strong. Ditto for labor market. And have seen inflation come down. Overall, this is a pretty good picture.

And thus he side stepped the soft/hard landing discussion.

Key statement: Don’t think March rate cut is likely based on meeting today. And from there the bottom dropped out of the stock market.

Wednesday @ 2pm ET the S&P 500 stands at 4,889. Yet at the closed all the way down to 4,845.65 (1.61%). Russell 2000 was even worse at -2.45%.

(End of Powell press conference statements).

As noted earlier, traders were overly zealous to hit the sell button on Wednesday afternoon. Yet as they woke up Thursday they saw that in reality the investment landscape had not changed that much.

Meaning that a 6 to 12 week delay for the first rate cut doesn’t really change the economic outlook nor bullish case for stocks.

On the other hand, the S&P 500 is pretty fully valued at PE of 20. Thus, as this stage we need to see an acceleration in the economy to stoke earnings growth to substantiate much higher share prices.

This most recent earnings season does not help that picture as future estimates have actually been cut. In fact, the next 3 quarters are expected to average a tepid 1.5% average earnings growth which is well below the long term average closer to 8%.

No…this is not a case for a large scale correction nor to go bearish. This is simply a case for 5,000 likely to be a place of stiff resistance for a while leading to an extended consolidation and trading range.

In those periods the overall market average may flat line, but the cream of the crop companies will rise to the top. Especially those with healthy growth prospects trading at reasonable or discounted valuations.

This is precisely the stocks that the POWR Ratings helps us drill into and explains our recent outperformance…and consistent outperformance over time.

Want to know the best of these stocks to own now?

Read on below for the answer.

What To Do Next?

Discover my current portfolio of 12 stocks packed to the brim with the outperforming benefits found in our exclusive POWR Ratings model. (Nearly 4X better than the S&P 500 going back to 1999)

This includes 5 under the radar small caps recently added with tremendous upside potential.

Plus I have 1 special ETF that is incredibly well positioned to outpace the market in the weeks and months ahead.

This is all based on my 43 years of investing experience seeing bull markets…bear markets…and everything between.

If you are curious to learn more, and want to see these lucky 13 hand selected trades, then please click the link below to get started now.

Steve Reitmeister’s Trading Plan & Top Picks >

Wishing you a world of investment success!


Steve Reitmeister…but everyone calls me Reity (pronounced “Righty”)
CEO, StockNews.com and Editor, Reitmeister Total Return


SPY shares were trading at $493.59 per share on Friday morning, up $4.39 (+0.90%). Year-to-date, SPY has gained 3.85%, versus a % rise in the benchmark S&P 500 index during the same period.


About the Author: Steve Reitmeister

Steve is better known to the StockNews audience as “Reity”. Not only is he the CEO of the firm, but he also shares his 40 years of investment experience in the Reitmeister Total Return portfolio. Learn more about Reity’s background, along with links to his most recent articles and stock picks.

More…

The post Did the Fed Put a Lid on Stock Prices? appeared first on StockNews.com

https://www.entrepreneur.com/finance/did-the-fed-put-a-lid-on-stock-prices/469228