How Low Will Stocks Go?

It is now clear the summer bear market rally is over. Now we are descending back into bear market territory with a retest of the S&P 500 (SPY) lows at 3,636 a very likely occurrence. But is that bottom or might we be in store for even more pain? 40 year investment veteran Steve Reitmeister shares his view along with a trading plan to carve out gains as the market likely falls much, much further. Read on below for full details.

shutterstock.com – StockNews

In a war both sides fight over every inch of soil. Anything lost in a previous battle you try to win back in the future.

Often the movement of the stock market is quite the same. That being where we often retest and reclaim key price levels. In this case, stocks have now given up the majority of the gains from the surprising 18% rally from the June bottom with a likely retest of that level coming in the near future.

Why is this happening?

Short answer is that it never stopped being a bear market and the 18% rally was nothing but a 2 month detour from reality. The longer answer, along with market outlook and trading plan is shared in the updated commentary below.

Market Commentary

The S&P 500 (SPY) tumbled into the finish line this week as poor economic data coupled with a FedEx earnings warning crippled stocks. It appears we are now retracing our steps back to the June lows…and probably lower.

One of the reasons for that was the shocking bad FedEx earnings report. Typically no single company will move the market this much. However, in the case of FedEx it is a great proxy for the health of commerce with far reaching ramifications.

So with a 40% earnings miss + removal of guidance because the outlook is so bad and unmeasurable + CEO saying worldwide recession coming = investors headed for the hills.

Back to the part about bad economic data this week…

Well, the slate of reports on Thursday alone made the Atlanta Fed GDPNow model tumble from +1.3% to only +0.5% for the current quarter. Note that back on 9/1 that model was pointing +2.6% GDP growth. That is falling very far…very fast, which is most certainly not a positive for what comes next as typically these things are a statement of momentum…and it is picking up to the downside.

The most interesting part of what we learned on Thursday is that retail sales were ONLY up because of inflation…but since growth lower than inflation, then net-net shows weakness in demand. This along with more bad news on imports/exports had GDP estimates diving…and share prices heading lower once again.

As if the fundamentals aren’t bad enough, the Thursday close below 3,908.19 for the S&P 500 (SPY) equated to a new Sell signal from the famed technicians at TheDowTheory.com. Their bearish calls are pretty much the best in the technical analysis business.

There is not much else to report between now and Wednesday as investors await the Fed rate decision. Will it be 50 or 75 points?

WHO FREAK’IN CARES!!!

The myopic short sightedness of most investment news is criminally insane. Thus, please pay no heed to price action that day. The only thing the Fed could say to get the bulls back firmly in charge is that rate hikes are over and the war over inflation has been won.

But that is not going to happen. Not even close.

That’s because the Fed already told us just a couple weeks back from Jackson Hole that is NOT in the cards. And that we have a long term fight to beat down inflation and it WILL cause more economic pain.

And yes more economic pain means worse that the +0.5% GDP estimate for Q3. It means likely recession which includes rise in unemployment. That is not being served up at this moment but will likely take top billing in the months ahead. And with it the bear market should press lower.

Now let’s talk about key price areas on the way down for the market/S&P 500 (SPY):

3,855 = 20% down line from the all time highs. Meaning the point that separates bull from bear territory. That came into play today with some support and little bounce at the finish line. Yes, it may provide support a little while longer…but no doubt going to fold in due time.

3,636 = the June lows. Rarely can you have a bear market without retesting the lows. So that is likely the next point of support as we explore the true depths of this bear market.

3,373 = 30% down from the all time highs. Likely there will be some folks starting to bottom fish around there. I may do that as well.

3,180 = 34% decline from the highs which is in line with the average decline of a bear market.

3,000 = Very interesting psychological level of support. It may be hard to go lower than that unless it truly feels like a much worse than normal recession. And yes, we may never make it down here as there will be a lot of buying activity between 3,180 and 3,373.

Note that valuations got stretched on the way up in this bull market (thanks to ultra low bond rates making stocks so damn attractive). Since true, then indeed stocks may have to fall further than average to find bottom.

That could be a trip down to just 3,000. Maybe a touch lower.

Just remember that NOBODY rings a bell at the top or bottom. It will not be easy. And will be hard to do in the moment because we will want to start bottom fishing when everything looks terrible (economy…price action etc).

But indeed with the stock market it is always “darkest before the dawn”.

Or simply it becomes Warren Buffett time to…”be greedy when others are fearful”.

You now understand why the bias has pushed bearish once again. And yes, you also understand from the 18% July/August bear market rally that the road to bottom will not be easy. It requires patience and discipline.

It also requires a plan which we have and will continue to refine as the facts dictate. Meaning we will adjust our plan accordingly with conditions.

Let’s go!

What To Do Next?

Discover my hedged portfolio of exactly 9 positions to help generate gains as the market descends back into a bear market territory.

And yes, it has worked wonders since the Fed made it clear there is more PAIN ahead which had stocks tumbling from recent highs above 4,300.

This is not my first time employing this strategy. In fact, I did the same thing at the onset of the Coronavirus in March 2020 to generate a +5.13% return the same week the market collapsed -15%.

If you are fully convinced this is a bull market…then please feel free to ignore.

However, if the bearish argument shared above does make you curious as to what happens next…then do consider getting my “Bear Market Game Plan” that includes specifics on the 10 positions in my hedged portfolio.

Click Here to Learn More >

Wishing you a world of investment success!


Steve Reitmeister…but everyone calls me Reity (pronounced “Righty”)
CEO, Stock News Network and Editor, Reitmeister Total Return


SPY shares rose $1.49 (+0.39%) in after-hours trading Friday. Year-to-date, SPY has declined -18.22%, versus a % rise in the benchmark S&P 500 index during the same period.


About the Author: Steve Reitmeister

Steve is better known to the StockNews audience as “Reity”. Not only is he the CEO of the firm, but he also shares his 40 years of investment experience in the Reitmeister Total Return portfolio. Learn more about Reity’s background, along with links to his most recent articles and stock picks.

More…

The post How Low Will Stocks Go? appeared first on StockNews.com

https://www.entrepreneur.com/article/435529



Bear Market Cure

The 20% loss for the S&P 500 (SPY) this year does not really tell the story of the pain inflicted on the average investor. Most individuals were piled up in the most popular tech names. And there losses of 30 to 50% are far too common. Yet during all this time Tim Biggam unveiled a strategy that produced phenomenal gains which is why we call it the “Bear Market Cure”. Get full details on this strategy and next timely trades down below.

shutterstock.com – StockNews

I just wanted to share with you my brand-new presentation I gave this week to investors at the Mad Hedge Traders Online Summit:

Bear Market Cure >

Joining me was trading legend, Tim Biggam, to share details on a unique strategy that has delivered an impressive +65.44% since November 2021, while most investors have been mired in heavy losses.

Of all our outperforming strategies, this one has shone the brightest…delivering 43 winners in the rough and tumble bear market this past year—which is why we call it the #1 Trading Strategy for 2022.

Clearly investors agree, as this presentation was one of our most well attended of the year.

With so much uncertainty in the markets, and things unlikely to improve any time soon, now is the perfect time for you to experience this #1 strategy first hand.

Everything you need to know is revealed in this timely presentation, including details on the next 2 exciting picks to emerge from this winning strategy.

Click the link below to start watching now!

Bear Market Cure >

Wishing you a world of investment success!

Steve Reitmeister
…but everyone calls me Reity (pronounced “Righty”)
CEO, StockNews.com & Editor of Reitmeister Total Return


SPY shares were unchanged in after-hours trading Friday. Year-to-date, SPY has declined -18.22%, versus a % rise in the benchmark S&P 500 index during the same period.


About the Author: Steve Reitmeister

Steve is better known to the StockNews audience as “Reity”. Not only is he the CEO of the firm, but he also shares his 40 years of investment experience in the Reitmeister Total Return portfolio. Learn more about Reity’s background, along with links to his most recent articles and stock picks.

More…

The post Bear Market Cure appeared first on StockNews.com

https://www.entrepreneur.com/article/435528


Snap, Twitter, and 1 Other Stock You Should Sell Right Now

The raging inflation and the Fed’s aggressive rate hikes has led advertisers to cut back on spending, which is, in turn affecting social media companies. With the Fed expected to launch another significant rate hike this month, we think investors should avoid Twitter (TWTR), Snap (SNAP), and Groupon (GRPN). Read on….

shutterstock.com – StockNews

The Consumer Price Index (CPI) report came in hotter than expected, with inflation rising 8.3% in August. This could prompt the Fed to continue its rate hikes, with several analysts now expecting a 100-basis point hike next week.

Social media companies have been struggling as advertisers pared back spending amid the rate hikes and surging inflation. “If you want proof that companies are nervous about the economic outlook, just look at how media platforms and marketing agencies are bemoaning a tougher advertising market,” Russ Mould, AJ Bell investment director, said.

Given this backdrop, we think investors should avoid Twitter, Inc. (TWTR), Snap Inc. (SNAP), and Groupon, Inc. (GRPN).

Twitter, Inc. (TWTR)

TWTR operates as a popular platform for public self-expression and conversation in real-time. The company also provides promoted products that enable advertisers to promote brands, products, and services.

On July 8, TWTR received a purported termination notice from Elon Musk. In response, the Board issued the following statement – “We are committed to closing the transaction on the price and terms agreed upon with Mr. Musk and plan to pursue legal action to enforce the merger agreement. We are confident we will prevail in the Delaware Court of Chancery.”

For the fiscal quarter ended June 30, 2022, TWTR’s revenue decreased 1.2% year-over-year to $1.18 billion. Income from operations came in at a negative of $343.76 million, decreasing 1,236.3% from the prior-year period. The company’s net income and net income per share came in at negative $270.01 million and negative $0.35, respectively, down 511.3% and 537.5% from the prior-year period.

Street EPS estimate of $0.25 for the fiscal fourth quarter ending December 2022 reflects a 25.2% year-over-year decrease. TWTR missed the street EPS estimates in three of the trailing four quarters.

The stock has slumped 30% over the past year and 5.7% over the past month to close the last trading session at $41.74.

TWTR’s POWR Ratings reflect this bleak outlook. The stock has an overall rating of D, equating to a Sell in our proprietary rating system. The POWR Ratings are calculated by considering 118 different factors, with each factor weighted to an optimal degree.

TWTR has an F grade for Sentiment and a D for Momentum. It is ranked #45 of 64 stocks in the F-rated Internet industry. Click here to see the additional POWR Ratings for Growth, Value, Stability, and Quality for TWTR.

Snap Inc. (SNAP)

SNAP operates as a camera company internationally. It offers Snapchat, an application that enables people to communicate visually through short videos and images.

For the fiscal second quarter ended June 30, SNAP’s total cost and expenses increased 28.7% from its prior-year quarter to $1.51 billion. Adjusted EBITDA declined 93.9% from the prior-year quarter to $7.19 million. Non-GAAP net loss and net loss per share came in at $29.60 million and $0.02, respectively, indicating an increase of 120.5% and 120% year-over-year.

Analysts expect SNAP’s EPS to decline 50.2% year-over-year to $0.11 for the fiscal quarter ending December 2022. Its consensus revenue estimate is expected to be $1.36 billion in the same period.

The stock has declined 83.5% over the past year and 75.6% over the past nine months to close its last trading session at $11.77.

The stock has an overall F rating, equating to a Strong Sell in our POWR Ratings system. SNAP also has an F grade in Stability and Sentiment and a D in Growth, Momentum, and Quality. It is ranked #58 in the Internet industry.

In addition to the POWR Rating grades we’ve stated above, you can see SNAP’s rating for Value here.

Groupon, Inc. (GRPN)

GRPN is a marketplace operator that connects merchants to consumers. It offers services on behalf of third-party merchants and serves customers through its website and mobile applications. The company operates through two broad segments- North America and International.

GRPN’s total revenue decreased 42.4% year-over-year to $153.22 million in the fiscal quarter ended June 30, 2022. Net income attributable to GRPN declined 2,597.4% from the prior-year quarter to a negative $91.23 million. Net income per share came in at a negative $3.04, down 2,433.3% from the same period the prior year.

The consensus EPS estimate of $0.04 for the fiscal quarter ending December 2022 indicates a 95.6% year-over-year decrease. Likewise, the consensus revenue estimate of $184.31 million reflects a decline of 17.4% in the same period.

GRPN’s stock slumped 47.5% year-to-date to close the last trading session at $12.16.

It is no surprise that GRPN has an overall rating of D, equating to Sell in our POWR Ratings system. It has a Sentiment and Stability grade of F and a Momentum and Growth grade of D.

In the same industry, GRPN is ranked #53. Click here to see the additional POWR Ratings for GRPN (Value and Quality).


TWTR shares were trading at $41.71 per share on Wednesday afternoon, down $0.03 (-0.07%). Year-to-date, TWTR has declined -3.49%, versus a -16.63% rise in the benchmark S&P 500 index during the same period.


About the Author: Komal Bhattar

Komal’s passion for the stock market and financial analysis led her to pursue investment research as a career. Her fundamental approach to analyzing stocks helps investors identify the best investment opportunities.

More…

The post Snap, Twitter, and 1 Other Stock You Should Sell Right Now appeared first on StockNews.com

https://www.entrepreneur.com/article/435344


Make Learning To Trade Options Your Go To Way To Beat Inflation

Trading options, not GLD, is a great way to fight inflation.

shutterstock.com – StockNews

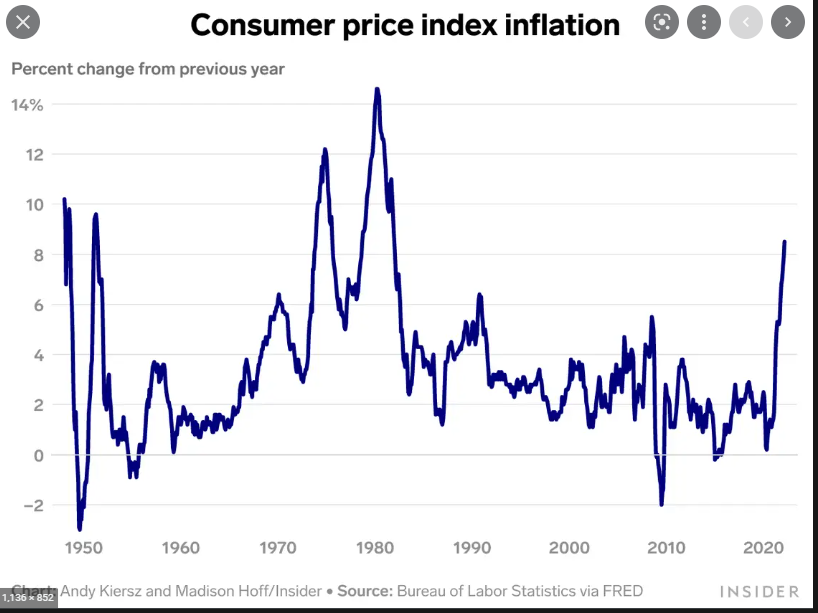
Inflation fears continue to climb in the U.S. The Federal Reserve has risen rates to combat the ever-increasing CPI (Consumer Price Index) which hit a recent historic high over 9% last June. This pushed Consumer Prices to the highest readings since late 1979.

Recent weakness in food and energy prices have served to soften the CPI, which last report stood at 8.5% in July. Better, but still not great news on inflation.

The difference between the two-year Treasury yield and ten-year Treasury yield continued to show inverson. Recession may be in the offing regardless of future Fed Policy.

Gold Prices Find Support

Gold prices (GLD) once again held major support at the $157 area.

Shares reached oversold conditions on a 9-day RSI basis before strengthening. MACD got oversold as well then turned higher. Bollinger Percent B went briefly negative but has since retaken positive territory. GLD is trading at a big discount to the 20-day moving average.

The prior four times this occurred marked significant short-term lows in GLD as highlighted in aqua on the chart. A move back above the 20-day moving average seems the most likely outcome.

It will be interesting to see if the recent rally in GLD has meaningful legs or if it will pullback to re-test support again.

Investing in gold as an inflation hedge appears to a spurious exercise at best. The fact that gold peaked in March 2022 right before the Fed began raising rates in earnest takes away much of the inflation fighting concerns to owning gold.

Instead of gold, consider using the power of POWR Options to heighten your overall returns.

POWR Options

What To Do Next?

If you’re looking for the best options trades for today’s market, you should check out our latest presentation How to Trade Options with the POWR Ratings. Here we show you how to consistently find the top options trades, while minimizing risk.

If that appeals to you, and you want to learn more about this powerful new options strategy, then click below to get access to this timely investment presentation now:

How to Trade Options with the POWR Ratings

All the Best!

Tim Biggam

Editor, POWR Options Newsletter


GLD shares closed at $159.82 on Friday, up $0.84 (+0.53%). Year-to-date, GLD has declined -6.52%, versus a -13.76% rise in the benchmark S&P 500 index during the same period.


About the Author: Tim Biggam

Tim spent 13 years as Chief Options Strategist at Man Securities in Chicago, 4 years as Lead Options Strategist at ThinkorSwim and 3 years as a Market Maker for First Options in Chicago. He makes regular appearances on Bloomberg TV and is a weekly contributor to the TD Ameritrade Network “Morning Trade Live”. His overriding passion is to make the complex world of options more understandable and therefore more useful to the everyday trader. Tim is the editor of the POWR Options newsletter. Learn more about Tim’s background, along with links to his most recent articles.

More…

The post Make Learning To Trade Options Your Go To Way To Beat Inflation appeared first on StockNews.com

https://www.entrepreneur.com/article/435099


Believe the Fed…More PAIN on the Way for Stocks

It’s easy to appreciate the confusion for investors at this time. Just when you think the bears are back in charge…next comes a big 3 day rally that calls it all into question. But why did stocks rally? And why do most signs still point bearish? And why does Steve Reitmeister believe that 3,000 to 3,200 is the more likely destination for the S&P 500 (SPY) this year? The answer to those vital questions and more awaits you in this timely market commentary below.

shutterstock.com – StockNews

Stocks enjoyed a good post Labor Day rally to end a 3 week streak of heading lower. This comes on the heels of some good news about the economy.

Unfortunately, there are two ways to look at this good news. And the other way is quite negative which is why concerns about further bearish downside still looms large.

We will review these recent catalysts and what it foretells about future market conditions in this week’s commentary.

Market Commentary

First the facts.

After several sessions under 4,000 stocks broke back above on Thursday and pushed higher still on Friday to close at 4,067. This ends the three week sell off from mid August when the S&P 500 (SPY) topped 4,300. Yet we are still far above the June lows of 3,636.

Now opinion.

I believe we are finding a new equilibrium at these levels balancing out bullish and bearish possibilities. Meaning I don’t think we will go much higher…nor much lower in the near term. More of a trading range scenario should emerge as investors await new facts that would change the bull/bear odds.

You already know I am bearish for reasons stated over and over again in my recent commentaries. So I will spare you the regurgitation of all that logic at this moment.

However, I do want to make clear that it is more important for me to be profitable…than to be proven right. Meaning if new facts emerge that are decidedly bullish…I would gladly shed my current bear coat and become a raging bull in seconds flat.

This last point is important for you to understand so you can appreciate that I am not bending the facts unnecessarily to a bearish slant. Just trying to share that there is truly more than one way to look at the latest newsbytes.

Let’s start with tumbling energy prices that made it as high as $125 just a few months back and now in the low to mid $80’s. The good news should be evident to all as energy is so essential to the inflation equation. So if prices are coming down this much this soon, then perhaps the Fed doesn’t need to fight so hard to tame inflation.

Now let’s consider the flipside. Prices are NOT coming down because of current supply/demand dynamics. Rather it is energy speculators pounding the price down given their concerns about future recession. And yes, recessions naturally mean lower demand which leads to lower prices.

If these energy traders are right, then it foreshadows more pain ahead for the overall economy. Meaning recession. And indeed recession and further stock price declines go hand in hand like peanut butter and jelly.

Now let’s consider the still strong employment picture. I had recently discussed how weekly Jobless Claims was potentially showing cracks in the strong employment foundation as the number of weekly claims had been steadily on the rise since March.

Well in the last few weeks that trend has reversed with Jobless Claims heading lower. This likely means that job gains in the economy will be robust once again for the August reading.

This points to another two edged sword similar to what I shared with lower energy prices. On the plus side the jobs market may be robust enough to handle the foul tasting higher rate medicine from the Fed. So if they can tame inflation without truly damaging the jobs market, then indeed a soft landing will have taken place which would have the bulls off to the races.

On the other hand, this healthy jobs picture may embolden the Fed to raise rates more aggressively than necessary. And once the ball starts rolling on weaker employment, it generally keeps rolling in that direction. This comes to light when you consider this vicious cycle:

Less jobs > less income > less spending > less profits > cut more jobs

And the cycle continues in rinse and repeat fashion for a long time leading to deeper recession…and steeper share price cuts.

Let’s roll back to Fed Chairman Powell’s comments from Jackson Hole. The raising of rates will cause pain…and will harm the employment picture.

Not might…WILL.

In this case we should take the Fed at their word because if anything they lean more optimistic than pessimistic with their comments. So if they tell you pain is on the way…you best believe it.

This is why I remain bearish even after this recent round of potentially good news…and recent bounce in stock prices. Clearly the well respected folks at Blackrock feel the same given these comments below:

“The Fed will be surprised by the growth damage caused by its tightening, in our view. When the Fed sees this pain, we think it will stop raising rates. It will be too late to avoid a contraction in economic activity by then, we think, but the decrease won’t be deep enough to bring PCE inflation down to the Fed’s target of 2%… That’s a big deal. We think getting inflation back to central bank targets means crushing demand with a recession. That’s bad news for risk assets in the near term.”

Just in case you were unclear…stocks are indeed risk assets. So is crypto so don’t get sucked in by today’s rally. Likely much more downside to that party which is typical after the forming of a bubble.

Back to the point…

Please remember that bull markets don’t go straight up. We have many down days…weeks…or even months mixed in. Yet we all still appreciate that the primary long term trend is up.

Same is true during a bear market in reverse. There will be up days, weeks and months. Heck, we even endured a 18% rally from mid June to mid August. And yet still very much in the midst of a long term bear market.

Given the evidence in hand I am still bearish, but appreciate that all that downside to eventual bottom closer to 3,000 to 3,200 on the S&P (SPY) will not unfold quickly or easily.

Instead I suspect we will be a bit more range bound in the near term. Maybe upside in the range to 4,100…maybe downside to 3,855 (20% decline line from all time highs).

And this is trading range represents a fair point of equilibrium for folks to ponder what comes next. And how much will the Fed need to raise rates to tame inflation. And how much damage will that cause to the economy and stock prices.

The less painful that picture…the more bullish things will become.

However, if the Fed is true to its word, and the majority of market prognosticators are right, then it will be painful…and will likely lead to recession…and will lead to a broader and deeper bear market than we have seen to date.

The latter is what I am banking on at this time…and explains the trading strategies I have employed in my trading alert services.

What To Do Next?

Discover my hedged portfolio of exactly 10 positions to help generate gains as the market descends back into a bear market territory.

And yes, it has worked wonders since the Fed made it clear there is more PAIN ahead which had stocks tumbling from recent highs above 4,300.

This is not my first time employing this strategy. In fact, I did the same thing at the onset of the Coronavirus in March 2020 to generate a +5.13% return the same week the market collapsed -15%.

If you are fully convinced this is a bull market…then please feel free to ignore.

However, if the bearish argument shared above does make you curious as to what happens next…then do consider getting my “Bear Market Game Plan” that includes specifics on the 10 positions in my hedged portfolio.

Click Here to Learn More >

Wishing you a world of investment success!


Steve Reitmeister…but everyone calls me Reity (pronounced “Righty”)
CEO, Stock News Network and Editor, Reitmeister Total Return


SPY shares fell $0.10 (-0.02%) in after-hours trading Friday. Year-to-date, SPY has declined -13.76%, versus a % rise in the benchmark S&P 500 index during the same period.


About the Author: Steve Reitmeister

Steve is better known to the StockNews audience as “Reity”. Not only is he the CEO of the firm, but he also shares his 40 years of investment experience in the Reitmeister Total Return portfolio. Learn more about Reity’s background, along with links to his most recent articles and stock picks.

More…

The post Believe the Fed…More PAIN on the Way for Stocks appeared first on StockNews.com

https://www.entrepreneur.com/article/435076


1 Energy Stock That Makes a Great Addition to Your Portfolio

Leading Oil & Gas company APA Corporation (APA) reported impressive second-quarter financials, and the stock has gained in double digits so far this year. The company is well-positioned to witness solid growth in the upcoming quarters, driven by its diversified portfolio, strategic acquisitions, and sustained energy demand. So, we think this energy stock makes a great addition to your portfolio. Continue reading….

shutterstock.com – StockNews

With an $11.97 billion cap, APA Corporation (APA) explores, develops, and produces oil and gas in the United States, Egypt, and the United Kingdom. It operates gathering, processing, and transmission assets in West Texas and owns four Permian-to-Gulf Coast pipelines.

APA delivered solid second-quarter results. The company’s diversified, unhedged portfolio largely benefitted from high prices across all three product streams. And this also helped APA to manage its spending categories, such as capital investment, operating costs, and general & administrative, well despite supply chain disruptions and overall cost environment.

The company’s production in the second quarter stood at 385,000 barrels of oil equivalent (BOE) per day.

On August 23, APA announced the first discovery at Baja-1 in Block 53 offshore Suriname. Baja-1 got drilled to a depth of 5,290 meters and encountered 34 meters of net oil pay in a single interval with the Campanian.

“Our success at Baja marks the 6th oil discovery we have participated in offshore Suriname and the first on Block 53. This result confirms our geologic model for the Campanian in the area and helps to de-risk other prospects in the southern portion of Blocks 53 and 58,” said John J. Christmann, APA’s CEO and President.

On August 3, the company announced that it bought West Texas oil-producing land for $505 million during the second quarter, strengthening its position in the Delaware portion of the Permian shale basin. The assets that the company acquired are expected to add production of between 12,000 to 14,000 barrels of oil equivalent per day (BOE) through the rest of this year.

APA has gained 36.4% year-to-date and 16.5% over the past month to close the last trading session at $36.67.

Here is what could influence APA’s performance in the upcoming months:

Solid Financials

For the fiscal 2022 second quarter ended June 30, 2022, APA’s total revenue increased 73.5% year-over-year to $3.05 billion. The company’s adjusted EBITDAX amounted to $1.96 billion, up 93.6% year-over-year. Its net income attributable to common stock grew 193% from the prior-year period to $926 million.

Furthermore, the company’s net income per common share came in at $2.71, registering an increase of 230.5% year-over-year. Cash inflows from operating activities rose 58.4% from the year-ago value to $1.54 billion. Also, free cash flow improved 100.5% year-over-year to $814 million.

Favorable Analyst Estimates

Analysts expect APA’s revenue for the fiscal 2022 third quarter (ending September 2022) to come in at $2.59 billion, indicating an increase of 56.8% from the prior-year period. The $2.42 consensus EPS estimate for the ongoing quarter indicates a 146.8% year-over-year increase. The company has topped the consensus revenue estimates in three of the trailing four quarters, which is impressive.

In addition, APA’s revenue for the fiscal year 2022 (ending December 2022) is expected to rise 35.8% from the previous year to $10.77 billion. Analysts expect the current year’s EPS to grow 141.7% year-over-year to $9.43.

High Profitability

APA’s trailing-12-month gross profit margin of 70.89% is 77.6% higher than the 39.92% industry average. Its trailing-12-month EBITDA margin of 63.18% is 153.3% higher than the 24.94% industry average. Also, the stock’s trailing-12-month net income of 27.56% is 188.8% higher than the industry average of 9.54%.

Furthermore, APA’s trailing-12-month levered FCF margin of 31.70% compares to the industry average of 6.09%. Its trailing-12-month, ROTC, and ROTA of 43.53% and 23.82% are higher than the industry averages of 6.76% and 5.79%, respectively.

Discounted Valuation

In terms of forward non-GAAP P/E, APA is currently trading at 5.59x, 36.7% lower than the industry average of 8.83x. The stock’s forward EV/Sales multiple of 2.61 is 8% lower than the industry average of 1.86. Likewise, its forward EV/EBITDA ratio of 2.54 compares with an industry average of 5.43.

In addition, in terms of forward Price/Sales, APA is currently trading at 1.11x, 18.2% lower than the industry average of 1.36x. The stock’s forward Price/Cash Flow multiple of 2.51 is 37.7% lower than the 4.02 industry average.

POWR Ratings Show Promise

APA’s overall B rating equates to a Buy in our POWR Ratings system. The POWR Ratings are calculated by accounting for 118 distinct factors, with each factor weighted to an optimal degree. 

APA has a grade of A for Quality, in sync with its higher-than-industry profitability metrics. In addition, it has a B grade for Growth, consistent with its solid revenue and earnings growth estimates.

APA is ranked #8 out of 96 stocks in the B-rated Energy-Oil & Gas industry.

Beyond what I have stated above, we have also given APA grades for Sentiment, Value, Momentum, and Stability. Get access to all APA ratings here.

Bottom Line

APA has delivered solid top- and-bottom-line results in its last quarter. Moreover, the stock is currently trading above its 50-day and 200-day moving averages of $35.27 and $36.07, respectively, indicating an uptrend. This momentum, coupled with a diversified portfolio, new strategic acquisitions, and a solid long-term outlook for energy, demonstrates the company’s solid growth prospects.

Given APA’s strong financials, impressive revenue and earnings growth estimates, higher-than-industry profitability, and low valuation, we think it could be wise to invest in this energy stock now.

How Does APA Corporation (APA) Stack Up Against its Peers?

APA has an overall POWR Rating of B. One could also check out these other stocks within the Energy-Oil & Gas industry with an A (Strong Buy) rating: Whitecap Resources, Inc. (SPGYF), Valero Energy Corp. (VLO), and Marathon Petroleum Corp. (MPC).


APA shares were trading at $37.31 per share on Thursday morning, up $0.64 (+1.75%). Year-to-date, APA has gained 40.18%, versus a -15.03% rise in the benchmark S&P 500 index during the same period.


About the Author: Mangeet Kaur Bouns

Mangeet’s keen interest in the stock market led her to become an investment researcher and financial journalist. Using her fundamental approach to analyzing stocks, Mangeet’s looks to help retail investors understand the underlying factors before making investment decisions.

More…

The post 1 Energy Stock That Makes a Great Addition to Your Portfolio appeared first on StockNews.com

https://www.entrepreneur.com/article/434969


1 Leveraged Equity ETF to Avoid and 2 to Buy

Leveraged equity ETFs are usually rewarding investments when the short-term prospects of their underlying industry or instruments are apparent. Given the resilience of the utility sector amid the current market volatility, ProShares Ultra Utilities (UPW) could be a good investment. Also, MicroSectors Gold Miners -3X Inverse Leveraged ETNs (GDXD) should benefit from the uncertainties surrounding gold. However, the potential trouble for the semiconductor industry makes Direxion Daily Semiconductor Bull 3X Shares (SOXL) best avoided now. Let’s discuss….

shutterstock.com – StockNews

A leveraged ETF is a security that uses financial derivatives and debt to amplify the returns of an underlying index. While a traditional ETF usually tracks the securities in its underlying index on a one-to-one basis, a leveraged ETF aims for two or three times amplification of the securities it holds.

Besides tracking an underlying index, a leveraged ETF might use financial products and debt to magnify returns. The main objective of leveraged ETFs is to generate daily returns that are multiples of the performance of the underlying index.

Leveraged ETFs are usually used as short-term bets by traders who want to take advantage of the index’s short-term momentum. Albeit risky, a leveraged ETF can offer significant gains exceeding the underlying index.

Amid the uncertain macroeconomic environment, utilities are expected to do well. Thus, it could be wise to add ProShares Ultra Utilities (UPW) to your portfolio. Since gold’s prospects look uncertain, MicroSectors Gold Miners -3X Inverse Leveraged ETNs (GDXD) should benefit too.

However, it could be wise to avoid Direxion Daily Semiconductor Bull 3X Shares (SOXL) due to the weak short-term prospects of the semiconductor industry.

ETF to Avoid:

Direxion Daily Semiconductor Bull 3X Shares (SOXL)

SOXL is an ETF launched by Direxion Investments. Rafferty Asset Management manages the fund, LLC. It invests directly, through derivatives and other funds, in stocks of companies operating across the information technology, semiconductors, and semiconductor equipment sectors. The fund uses derivatives such as futures and swaps to create its portfolio. It seeks to track 3x the daily performance of the PHLX Semiconductor Sector Index.

SOXL has $3.71 billion in assets under management (AUM). Its major holding is Dreyfus Government Cash Management Funds Institutional (DGCXX), with a 32.61% weighting in the fund, followed by Goldman Sachs Trust Financial Square Treasury Instruments Fund Institutional (FTIXX) at 14.19%, and U.S. Dollar at 4.43%. It currently has 35 holdings in total.

SOXL has gained 81.7% in price year-to-date to close the last trading session at $12.42.

SOXL’s POWR Ratings reflect this promising outlook. The ETF has an overall rating of F, which equates to a Strong Sell in our proprietary rating system. The POWR Ratings are calculated by considering 118 distinct factors, with each factor weighted to an optimal degree.

SOXL has an F for Trade and Buy & Hold grade and a D for Peer. Of the 101 ETFs in the F-rated Leveraged ETFs group, SOXL is ranked #46.

ETFs to Buy:

ProShares Ultra Utilities (UPW)

ProShare Advisors LLC manages UPW. It invests through derivatives in stocks of companies operating in the utility sector. It uses derivatives such as swaps to create its portfolio. The fund seeks to track 2x the daily performance of the Dow Jones U.S. Utilities Index.

UPW has $20.10 million AUM. Its major holdings include the U.S. dollar, with a 19.40% weighting in the fund, followed by NextEra Energy, Inc. (NEE) at 11.60%, and The Southern Company (SO) at 5.75%. It currently has 50 holdings in total.

The ETF’s 0.95% expense ratio compares to the 1% category average. UPW has gained 16.8% in price over the past nine months to close the last trading session at $78.89.

It’s no surprise that UPW has an overall B rating, which equates to Buy in our proprietary POWR Ratings system.

In addition, UPW has an A grade for Trade and Peer and a B for Buy & Hold. Of the 101 ETFs in the Leveraged Equities ETFs group, UPW is ranked #4.

MicroSectors Gold Miners -3X Inverse Leveraged ETNs (GDXD)

GDXD is a note that provides 3x daily inverse leveraged exposure. Its underlying index, the S-Network MicroSectors Gold Miners Index, comprises ETFs, VanEck Gold Miners ETF (GDX) and VanEck Junior Gold Miners ETF (GDXJ), which invest in the global gold mining industry. GDXD has $27.20 million AUM.

The ETF’s 0.95% expense ratio compares to the 1.12% category average. GDXD has gained 158.6% in price over the past six months to close the last trading session at $25.69.

GDXD’s POWR Ratings reflect solid prospects. It has an overall rating of B, equating to a Buy in our proprietary rating system.

GDXD has an A grade for Trade and Peer. Within the same ETFs group, GDXD is ranked #8. Click here to see GDXD’s ratings for Buy & Hold.


SOXL shares fell $12.42 (-100.00%) in premarket trading Wednesday. Year-to-date, SOXL has declined -81.98%, versus a -17.30% rise in the benchmark S&P 500 index during the same period.


About the Author: Dipanjan Banchur

Since he was in grade school, Dipanjan was interested in the stock market. This led to him obtaining a master’s degree in Finance and Accounting. Currently, as an investment analyst and financial journalist, Dipanjan has a strong interest in reading and analyzing emerging trends in financial markets.

More…

The post 1 Leveraged Equity ETF to Avoid and 2 to Buy appeared first on StockNews.com

https://www.entrepreneur.com/article/434861


Why Are Stocks Tilting Bearish Once Again?

The S&P 500 (SPY) rallied 18% from the June lows til they hit a wall in mid August. At first it seemed the reason was simply hitting the resistance level at the 200 day moving average. But really, if we are being honest with ourselves, it is the reawakening to the negative outlook for the economy. We can all thank Fed Chairman Powell for inscribing it on the tablets handed down from Mt. Jackson Hole. So where do stocks head from here? And what is the best trading plan at this time? Read on below for the answers.

shutterstock.com – StockNews

One of the most confusing things for investors to wrap their heads around is the correlation between the current economic picture versus the movement of stock prices.

If the economy looks good and the market goes down it seems counterintuitive. Same goes for the darkest hour of a bear market as stocks start to rise as the economy is still in horrendous shape.

Now is one of those times when investors are a bit befuddled by the contradiction between the seemingly healthy economy versus the red arrows abounding in stock prices. So, let’s tackle this timely topic in today’s commentary.

Market Commentary

After the first close under 4,000 on Tuesday there truly has been a “battle for the soul” of this stock market. At first on Wednesday bulls were in charge rushing back over 4,000. Then tick by tick the bears clawed their way back. In the end the S&P 500 (SPY) fell once again Wednesday to close at 3,955.

Yes, there was a little bounce Thursday for the S&P…but “Risk On” positions were pummeled as can be seen by the -1.15% showing for the small caps in the Russell 2000. Thus, notch another session for the bears with yet it was a third straight close under 4,000.

And then on Friday larger early gains were washed off the board to close down over 1% at 3,924 marking the fourth straight week of losses. Most technical analysts would call that a confirmation of the break under 4,000 as it turns from support into resistance.

All this recent negativity seems quite odd as there are some clear positives to point to in the economy. Like 315,000 jobs added in August keeping up the healthy employment trends. We could talk about many other individual economic reports showing growth, but its best to center on the GDP picture for the US as that takes everything into account.

The recently updated GDP Now estimate from the Atlanta Fed for Q3 just got bumped up to +2.6% after a solid showing for ISM Manufacturing. This starkly contrasts with the pain levied on stocks that same day as they sunk further under 4,000.

This takes us back to the theme noted in the intro: How can we explain recent stock weakness in light of solid economic readings?

The simple answer is that investors are always looking ahead. Like what is likely coming around the corner so they can make adjustments before it’s too late.

Remember that the majority of the money in the market is invested by professionals. Not individuals.

Whereas you and I can go from 100% long to 100% short in just a few minutes in our online brokerage accounts. The same is not true for professionals who often have to manage billions of dollars. Some having such large positions concentrated in just a small collection of stocks that if they sold them too fast their actions alone would crater the shares.

This explains why they need to look ahead. So, they can strategize how to make major shifts in their portfolios that could take weeks or months to complete.

So, What Are the Pros Forecasting Now?

Inflation is still too high and not fading any time soon. Add to that a VERY hawkish Fed that is pounding the table that they will keep raising rates through 2023 and it will cause economic PAIN.

Those who didn’t understand this basic equation were told so from the mountain tops of Jackson Hole last week for which stock prices have tumbled ever since. Meaning investors have received the memo.

Note everyone had this memo in hand back in May/June, but somehow lost it during the outsized and nonsensical July/August rally. Now it is taped to their monitors once again.

The message is also being received on Wall Street as Q1 2023 earnings estimates have been trimmed down to showing only 3% earnings growth. Even worse Q2 of next year is basically at no growth. This is a far cry from the 10-15% earnings growth we were enjoying in recent quarters.

Also take a gander at plummeting commodity prices this past week. Namely oil going from a recent high of $95 per barrel to $88 in just a weeks time.

That is NOT about current supply and demand dynamics. This is absolutely about speculators looking ahead to the future economic conditions and taking their money out of these trades because looming recession does = lower future demand which does = lower prices ahead.

This same song is being sung in corporate executive suites as well. According to recent surveys by The Conference Board 77% of CEO’s believe that recent economic conditions have worsened over Q2. That is up from 61% who felt that way when surveyed in Q2. Even more gloomy, only 7% predict sustained growth in 2023.

If executives are predicting recession…then it likely will become a self-fulfilling prophecy. That’s because their negativity leads to caution in how they manage their business, which leads to lower tolerance for spending or investing in the business. The more companies that move forward with that caution by its very definition equates to lower economic activity and increased odds of recession.

OK…the Outlook Has Worsened…So What is the Trading Plan NOW?

I have been on the bear market bandwagon since late May. That looked brilliant at first as stocks finally took the dive into bear market territory by mid June. But then there was a 2 month detour via an 18% bounce that bordered on criminally insane.

Since then, rationality has been restored to stock prices by heading lower once again given the ominous economic outlook. In my last commentary I talked about a fork in the road that looked like 50% odd of stocks staying range bound above 4,000. And 50% odds of descending back into bear market territory.

In the few days that have followed the latter argument is winning with stocks clawing lower and lower. At this stage the next logical support level is at the old battle ground of 3,855 for the S&P (SPY). That is the line that demarks a 20% decline from the January highs which we all appreciate that below that level is bear market territory.

That 3,855 level would be a good point for investors to pause and reflect on what comes next. Most likely with pessimism so high amongst consumers and businesses alike, we will in time keep rolling towards recession and commensurate bear market will unfold.

Just a reminder that the average bear market equates to a 34% decline from the highs. That points to 3,180 which is well below current levels.

Of course with any average there is a wide range of potential outcomes. This could be a milder bear…or a bit more ferocious. But I do sense that somewhere in the 3,000 to 3,200 area we will find bottom.

If true, then it means to prepare your portfolio for more stock price declines.

What To Do Next?

Discover my hedged portfolio of exactly 10 positions to help generate gains as the market descends back into a bear market territory.

And yes, once again it ended up firmly in the plus column this Friday even as the S&P crumbled.

This is not my first time employing this strategy. In fact, I did the same thing at the onset of the Coronavirus in March 2020 to generate a +5.13% return the same week the market collapsed -15%.

If you are fully convinced this is a bull market…then please feel free to ignore.

However, if the bearish argument shared above does make you curious as to what happens next…then do consider getting my “Bear Market Game Plan” that includes specifics on the 10 positions in my hedged portfolio.

Click Here to Learn More >

Wishing you a world of investment success!


Steve Reitmeister…but everyone calls me Reity (pronounced “Righty”)
CEO, Stock News Network and Editor, Reitmeister Total Return


SPY shares rose $0.71 (+0.18%) in after-hours trading Friday. Year-to-date, SPY has declined -16.80%, versus a % rise in the benchmark S&P 500 index during the same period.


About the Author: Steve Reitmeister

Steve is better known to the StockNews audience as “Reity”. Not only is he the CEO of the firm, but he also shares his 40 years of investment experience in the Reitmeister Total Return portfolio. Learn more about Reity’s background, along with links to his most recent articles and stock picks.

More…

The post Why Are Stocks Tilting Bearish Once Again? appeared first on StockNews.com

https://www.entrepreneur.com/article/434681


Twitter Stock Was A “Sell” Even Before Whistleblower Revealed Security Issues

Social media company Twitter (TWTR) has been experiencing a rough time. In addition to poor second-quarter performance, TWTR is fighting a legal battle with Elon Musk over his decision to abandon a $44 billion deal to buy the communications company. Moreover, the situation has gotten worse for TWTR since its former security chief, Peiter Zatko, filed a whistleblower complaint raising security concerns against the company. Read on….

shutterstock.com – StockNews

Peiter Zatko, former security chief of Twitter, Inc. (TWTR), has turned whistleblower and testified that the company misled users and federal regulators about gaps in its security. Zatko further claimed that TWTR underestimated how many fake and spam accounts are on its platform and is riddled with dangerous security problems.

Even before the former security chief’s allegations, shares of TWTR have been declining sharply since Tesla, Inc.’s (TSLA) CEO Elon Musk threatened to end his $44 billion deal to buy TWTR. Musk accused the social media company of hiding information about the number of bot and spam accounts on the platform. Musk’s attorney Mike Ringler claimed that TWTR has not complied with its contractual obligations.

Furthermore, TWTR pursued legal action to enforce the agreement. On July 12, the company filed a lawsuit against Elon Musk in the Delaware Court of Chancery. On the other hand, on July 29, Musk countersued Twitter, further escalating the legal battle. Moreover, the recent whistleblower allegations could potentially stir up the ongoing TWTR and Elon Musk trail.

Over the past year, TWTR has declined 36% to close the last trading session at $41.05. The stock is currently trading 40% below its 52-week high of $68.41, which it hit on October 20, 2021.

Here is what I think could influence TWTR’s performance in the upcoming months:

Deteriorating Financials

For the fiscal 2022 second quarter ended June 30, 2022, TWTR’s revenue declined 1.2% year-over-year to $1.18 billion. The company’s costs and expenses increased 31.1% from the year-ago value to $1.52 billion. Its loss from operations amounted to $343.76 million, compared to a gain of $30.25 million in the prior-year period.

Furthermore, TWTR’s net loss and loss per share came in at $270.01 million and $0.35, widening 511.3% and 537.5% year-over-year, respectively. Net cash provided by operating activities amounted to $29.70 million, down 92.2% year-over-year.

Bleak Growth Prospects

Analysts expect the company’s revenues to increase 3.9% year-over-year to $1.63 billion in the fiscal 2022 fourth quarter (ending December 2022). However, the consensus EPS estimate for the same quarter is expected to come at $0.26, worsening 20.9% from the same period in 2021.

Furthermore, the company’s EPS for the fiscal year 2023 (ending December 2023) is expected to decline 21.5% year-over-year to $0.82. Also, the company has missed the consensus revenue estimates in three of the trailing four quarters.

Low Profitability

In terms of trailing-12-month EBITDA margin, TWTR’s 4.04% is 79.4% lower than the 19.57% industry average. And its trailing-12-month net income margin of negative 2.14% is lower than the 5.73% industry average. Likewise, the stock’s trailing-12-month levered FCF margin of 0.50% is 93.8% lower than the industry average of 8.01%.

Furthermore, TWTR’s trailing-12-month ROCE, ROTC, and ROTA of negative 1.64%, 1.31%, and 0.62% compare with the industry’s 8.01%, 6.66%, and 3.58%, respectively.

High Valuation

In terms of forward non-GAAP P/E, TWTR’s 39.43x is 128.5% higher than the 17.26x industry average. Its 30.39x forward EV/EBITDA is 249.8% higher than the 8.69x industry average. Likewise, the stock’s 5.86x forward Price/Sales is 335.6% higher than the 1.35x industry average.

In addition, the stock’s 4.21x forward Price/Book is 105.4% higher than the 2.05x industry average.

POWR Ratings Reflect Bleak Prospects

TWTR has an overall rating of D, which translates to Sell in our proprietary POWR Ratings system. The POWR Ratings are calculated considering 118 distinct factors, with each factor weighted to an optimal degree.

TWTR has a grade of F for Sentiment, in sync with analysts’ weak revenue and earnings estimates. Also, it has a D grade for Stability. The stock’s beta of 1.21 justifies the Stability grade.

TWTR is ranked #46 out of 65 stocks in the F-rated Internet industry.

Beyond what I have stated above, we have also given TWTR grades for Value, Growth, Quality, and Momentum. Get all TWTR ratings here.

Bottom Line

The uncertainty around Elon Musk’s chaotic takeover bid for TWTR has dampened investor sentiment and led to a sharp decline in its stock price. In addition to battling with Musk over his decision to terminate the deal, the social media company reported poor second-quarter financials. Moreover, Ex-twitter employee Peiter Zatko recently blew the whistle, alleging the company’s reckless and negligent cybersecurity policies.

Given TWTR’s disappointing financials, bleak growth prospects, higher-than-industry valuation, low stability, and low profitability, we think it could be wise to avoid the stock now.

How Does Twitter, Inc. (TWTR) Stack Up Against its Peers?

TWTR has an overall POWR Rating of D. One could also check out these other stocks within the Internet industry with a B (Buy) rating: trivago N.V. (TRVG), Yelp Inc. (YELP), and Expedia Group Inc. (EXPE).


TWTR shares were trading at $40.43 per share on Friday afternoon, down $0.62 (-1.51%). Year-to-date, TWTR has declined -6.46%, versus a -12.98% rise in the benchmark S&P 500 index during the same period.


About the Author: Mangeet Kaur Bouns

Mangeet’s keen interest in the stock market led her to become an investment researcher and financial journalist. Using her fundamental approach to analyzing stocks, Mangeet’s looks to help retail investors understand the underlying factors before making investment decisions.

More…

The post Twitter Stock Was A “Sell” Even Before Whistleblower Revealed Security Issues appeared first on StockNews.com

https://www.entrepreneur.com/article/434212


Bill Gates Adding to Ecolab Position, but 3 of His Holdings Are Better Buys

Microsoft co-founder and philanthropist Bill Gates’ Bill & Melinda Gates Foundation has a substantial portfolio of investments, which several investors keenly follow. Bill Gates has been recently buying shares of Ecolab (ECL). Given ECL’s disappointing financials and bleak growth prospects, we think it could be wise to wait for a better entry point in the stock. Conversely, fundamentally sound Bill Gates holdings Walmart (WMT), Waste Management (WM), and Coca-Cola FEMSA could be ideal picks to ensure solid returns. Continue reading….

shutterstock.com – StockNews

William Henry Gates III, widely known as Bill Gates, is one of the world’s most influential and wealthiest people, with an estimated net worth of $129 billion as of June 2022. He is the co-founder and former CEO of software giant Microsoft Corporation (MSFT). He focuses mainly on philanthropy through his private charitable foundation, the Bill & Melinda Gates Foundation.

Bill Gates’ investment chief, Michael Larson, overseas family office Cascade Investment Group. And this asset management firm manages Gates’ Foundation and wealth. Based on the recent 13F filing, Bill & Melinda has a vast investment portfolio of more than $19 billion. The Gates Foundation owns several highly profitable companies with sustainable competitive advantages.

Bill Gates recently bought $32 million more of shares of Ecolab Inc. (ECL), the leading provider of water-treatment, hygiene, and infection-prevention goods and services. Bill Gates is ECL’s largest individual shareholder, owning 62 million shares and representing 21.8% of the company. Also, ECL currently represents nearly 3.9% of Bill Gates’ portfolio.

ECL reported a 13% improvement in net sales in the second quarter of 2022, beating Wall Street estimates. However, its top-line growth didn’t translate to bottom-line improvement. Moreover, the quarter’s sales growth was significantly offset by product cost inflation and unfavorable currency translation in a rapidly changing operating environment. The stock has slumped 26.5% year-to-date.

Thus, we think fundamentally sound Bill Gates holdings Walmart Inc. (WMT), Waste Management, Inc. (WM), and Coca-Cola FEMSA, S.A.B. de C.V. (KOF) could be better investments instead. The stocks are rated Strong Buy in our proprietary rating system.

Walmart Inc. (WMT)

WMT is a retail giant that operates supercenters, supermarkets, warehouse clubs, hypermarkets, discount stores, and e-commerce websites, including walmart.com, walmart.com.mx, walmart.ca, and samclub.com. The company operates through three segments: Walmart U.S.; Walmart International; and Sam’s Club.

WMT operates nearly 10,500 stores and various e-commerce websites under 46 banners in 24 countries. The company represents about 2.28% of Bill Gates’ investment portfolio.

On July 28, WMT and Getaway, a health and wellness hospitality company, announced a new retail partnership to make simple escapes to nature more effortless and accessible for guests. The new alliance will introduce innovative offerings starting this fall, including The General Store by Walmart, opening at select Getaway Outposts.

The partnership is expected to further the company’s mission to help people Live Better and boost its revenue streams.

In June, WMT and Memomi, an augmented reality (AR) optical tech company, entered an agreement for Walmart to acquire Memomi. The acquisition will reinforce WMT’s commitment to frictionless and omnichannel optical care.

“We’re excited to welcome the Memomi team to Walmart and add their capabilities to our leading virtual reality technology that is transforming the retail experience for our customers and members,” said Cheryl Ainoa, Senior Vice President, New Businesses & Emerging Tech, Walmart Global Tech.

In the fiscal 2023 second quarter ended July 31, 2022, WMT’s revenues increased 8.4% year-over-year to $152.86 billion. Its income before income taxes amounted to $6.64 billion, up 12.2% from the prior-year value. The company’s consolidated net income and net income per common share attributable to WMT came in at $5.15 billion and $1.88, registering increases of 17.9% and 23.7% year-over-year, respectively.

The consensus revenue estimate of $144.07 billion for the fiscal 2024 first quarter (ending April 2023) represents a 2.7% growth from the same period in 2021. The $1.48 consensus EPS estimate for the same quarter represents a 14% rise year-over-year. The company has surpassed the consensus revenue estimates in each of the trailing four quarters.

The stock has gained 2.2% over the past month to close the last trading session at $134.97.

WMT’s POWR Ratings reflect a strong outlook. The stock has an overall rating of A, which translates to a Strong Buy in our rating system. The POWR Ratings assess stocks by 118 different factors, each with its own weighting.

WMT has a B grade for Quality, Growth, Stability, and Sentiment. Within the A-rated Grocery/Big Box Retailers industry, it is ranked #7 of 38 stocks. To see additional POWR Ratings (Momentum and Value) for WMT, click here.

Waste Management, Inc. (WM)

WM provides waste management environmental services to North America’s residential, commercial, municipal, and industrial customers. The company offers collection, recycling, construction remediation, and specialized disposal services for oil and gas exploration and production operations.

WM owns and operates more than 255 solid waste landfills, five secure hazardous waste landfills, 96 MRFs, and 340 transfer stations. The company currently constitutes nearly 14.94% of Gates’ investment portfolio.

WM achieved two milestones during the second quarter that might boost the company’s sustainable growth and profitability.

Jim Fish, WM’s President and CEO, said, “We brought our fifth WM-owned and operated renewable natural gas plant into service in Oklahoma, which is expected to generate about 570,000 MMBtu of RNG and progresses us towards the 21 million MMBtu planned increase in RNG generation by 2026. We also completed technology and automation upgrades at our materials recovery facility in Houston.”

WM’s revenue increased 12.3% year-over-year to $5.03 billion in the fiscal 2022 second quarter ended June 30, 2022. The company’s adjusted operating income grew 11.1% year-over-year to $907 million. Its adjusted EBITDA stood at $1.42 billion, up 7.8% year-over-year.

Furthermore, the company’s adjusted net income increased 11.3% from the year-ago value to $599 million, while its adjusted EPS came in at $1.44, registering an increase of 13.4% year-over-year.

The $19.77 billion consensus revenue estimate for the fiscal year 2022, ending December 2022, represents a 10.3% improvement from the last year. Analysts expect WM’s EPS for the current year to increase 18.2% year-over-year to $5.72. The company has topped the consensus revenue estimates in each of the trailing four quarters.

The stock has gained 11.5% over the past month and 22.3% over the past six months to close the last trading session at $173.48.

WM’s POWR Ratings reflect a promising outlook. The stock has an overall grade of A, which equates to a Strong Buy in our proprietary rating system.

WM has a grade of A for Quality. It has a B grade for Stability and Sentiment. Within the B-rated Waste Disposal industry, it is ranked #2 of 16 stocks. Click here to access WM’s additional POWR Ratings (Momentum, Growth, and Value).

Coca-Cola FEMSA, S.A.B. de C.V. (KOF)

Headquartered in Mexico City, Mexico, KOF is a franchise bottler that produces, markets, and sells Coca-Cola trademark beverages. The company provides a portfolio of products through retail outlets, such as wholesale supermarkets, convenience stores, retailers, restaurants and bars, and home delivery. Additionally, it distributes and sells Heineken beer products in its Brazilian territories.

The company represents about 1.73% of Bill Gates’ portfolio.

On July 14, KOF announced that its subsidiary Spal Indústria Brasileira de Bebidas, S.A., signed a non-exclusive agreement to distribute products of Grupo Perfetti Van Melle, one of the world’s largest manufacturers of confectionery and chewing gum, with global brands such as Mentos and Fruit-tella in its Brazilian territories. This agreement might boost the company’s revenues.

In the fiscal second quarter of 2022, KOF’s total revenues increased 20.1% year-over-year to ₱57.31 billion ($2.87 billion), while its gross profit grew 12% from the year-ago value to ₱25.27 billion ($1.27 billion). Its operating income improved 5.6% year-over-year to ₱7.65 billion ($383.43 million). In addition, net income attributable to equity holders of the company amounted to ₱4.63 billion ($232.06 million), up 39.5% year-over-year.

Analysts expect KOF’s revenue for the third quarter (ending September 2022) to come in at $2.61 billion, representing a 9.1% rise from the prior-year period. Also, Street expects the company’s EPS for the ongoing year to come in at $0.89, representing a growth of 9.8% year-over-year.

Furthermore, the company has surpassed the consensus revenue and EPS estimates in three of the trailing four quarters.

KOF’s shares have gained 19.3% over the past six months and 15% year-to-date to close the last trading session at $62.72.

KOF’s strong fundamentals are reflected in its POWR Ratings. The stock has an overall grade of A, equating to a Strong Buy in our proprietary rating system.

KOF has a grade of A for Stability. The stock has a B grade for Sentiment, Value, and Quality. Within the A-rated Beverages industry, it is ranked #1 of 35 stocks. To see additional POWR Ratings (Momentum and Growth) for KOF, click here.


WMT shares were trading at $135.78 per share on Thursday afternoon, up $0.81 (+0.60%). Year-to-date, WMT has declined -5.04%, versus a -11.31% rise in the benchmark S&P 500 index during the same period.


About the Author: Mangeet Kaur Bouns

Mangeet’s keen interest in the stock market led her to become an investment researcher and financial journalist. Using her fundamental approach to analyzing stocks, Mangeet’s looks to help retail investors understand the underlying factors before making investment decisions.

More…

The post Bill Gates Adding to Ecolab Position, but 3 of His Holdings Are Better Buys appeared first on StockNews.com

https://www.entrepreneur.com/article/434155