Comcast Stock Is Only TV Entertainment “Buy,” These 2 Others Are Duds

Amid soaring prices, entertainment giants have failed to retain their optimal pandemic-era performances. However, demand for TV entertainment remains robust. Quality TV entertainment stock Comcast (CMCSA) could be worth buying now. However, fundamentally weak DISH Network (DISH) and WideOpenWest (WOW) might be best avoided. Keep reading….

shutterstock.com – StockNews

The TV entertainment industry suffered aplenty amid record high prices, with major entertainment giants failing to retain their pandemic-era subscription rates. However, watching TV remains the most preferred leisure activity.

According to reports, men spent 3 hours/day watching TV, while women spent 2.70 hours. Demand for daily TV content is robust and should bode well for the TV entertainment industry.

Moreover, investors’ interest in entertainment stocks is evident from the Invesco Dynamic Leisure and Entertainment ETF’s (PEJ) 4.8% gains over the past month. In addition, the global entertainment and media market size is projected to grow at a CAGR of 5.9% from 2022 to 2028.

Given the backdrop, top-rated TV entertainment stock Comcast Corporation (CMCSA) could be a solid addition to your portfolio. However, fundamentally weak DISH Network Corporation (DISH) and WideOpenWest, Inc. (WOW) might be best avoided now.

Stock to Buy:

Comcast Corporation (CMCSA)

CMCSA, America’s largest cable provider to small and mid-size businesses, operates as a media and technology company worldwide. It operates through Cable Communications; Media; Studios; Theme Parks; and Sky segments.

On August 22, 2022, CMCSA launched an additional multi-gig Internet speed tier for Xfinity and CMCSA Business customers in Colorado Springs. This launch makes up for the fastest upload speed to date and is a landmark addition to CMCSA’s portfolio.

In addition, on August 1, 2022, CMCSA announced its strategic partnership with Fortinet (FTNT), a global leader in broad, integrated, and automated cybersecurity solutions, to offer enterprises a new set of secure access service edge (SASE) and security service edge (SSE) solutions. This collaboration is expected to boost business prospects for both companies.

CMCSA’s revenue came in at $30.02 billion for the second quarter ended June 30, 2022, up 5.1% year-over-year. Its adjusted EBITDA increased 10.1% year-over-year to $9.83 billion. Moreover, the company’s adjusted net income came in at $4.51 billion, up 14.3% year-over-year.

Analysts expect CMCSA’s revenue to increase 4.6% year-over-year to $121.72 billion in the current year. Its EPS is estimated to increase 11.1% year-over-year to $3.59 in 2022. It has surpassed EPS estimates in all four trailing quarters. CMCSA’s shares have lost marginally intraday to close the last trading session at $37.24.

CMCSA’s POWR Ratings reflect this promising outlook. The company has an overall rating of B, which translates to a Buy in our proprietary rating system. The POWR Ratings assess stocks by 118 different factors, each with its own weighting.

CMCSA has a B grade in Stability and Quality. Within the Entertainment – TV & Internet Providers industry, it is ranked #1 among nine stocks. Click here to see the additional POWR Ratings for Sentiment, Value, Growth, and Momentum for CMCSA.

Stocks to Avoid:

DISH Network Corporation (DISH)

DISH and its subsidiaries offer Pay-TV services in the United States. The company operates in two segments, Pay-TV and Wireless. It has around 10.71 million pay-TV subscribers in the United States, including 8.22 million DISH TV subscribers and 2.49 million SLING TV subscribers.

On July 21, 2022, DISH announced the launch of ViX+ on DISH TV and SLING TV, enabling customers to subscribe to ViX+ directly through its platforms. However, declining subscribers might hamper optimal benefits from this launch. The company’s Sling TV subscribers came in at 2.20 million for its latest quarter, down 9.9% year-over-year.

DISH’s total revenue came in at $4.21 billion for the second quarter ended June 30, 2022, down 6.2% year-over-year. Its net income decreased 22.1% year-over-year to $522.83 million. Moreover, the company’s EPS decreased 22.6% year-over-year to $0.82.

Analysts expect DISH’s revenue to decrease 5.8% year-over-year to $16.85 billion in the current year. Its EPS is estimated to decrease 33% year-over-year to $2.54 in 2022. It missed EPS estimates in three of the four trailing quarters. Over the past year, the stock has lost 59.7% to close the last trading session at $17.40.

DISH’s POWR Ratings are consistent with this bleak outlook. It has an overall D rating, equating to a Sell in our rating system. DISH has an F grade for Quality and a D for Growth. It is ranked #8 in the same industry.

We have also rated DISH for Value, Momentum, Sentiment, and Stability. Get all DISH ratings here.

WideOpenWest, Inc. (WOW)

WOW provides high-speed data, cable television, and digital telephony services to residential and business customers in the United States. It currently serves approximately 1.90 million homes and businesses and 532,900 customers in the states of Alabama, Florida, Georgia, Michigan, South Carolina, and Tennessee.

WOW’s total revenue came in at $176.10 million for the second quarter ended June 30, 2022, down 3.2% year-over-year. Its telephony segment revenue decreased 11.6% year-over-year to $12.90 million. Also, the company’s video revenue decreased 13.7% year-over-year to $47.70 million.

Street expects WOW’s revenue to decrease 31.9% year-over-year to $704.31 million in 2022. It missed consensus EPS estimates in each of the trailing four quarters. Over the past three months, the stock has lost 15.1% to close the last trading session at $18.46.

WOW’s POWR Ratings reflect its poor prospects. The stock has an overall D rating, equating to Sell in our POWR Ratings system. WOW also has a D grade for Value and Sentiment. It is ranked last in the same industry.

Beyond what is stated above, we’ve also rated WOW for Quality, Growth, Momentum, and Stability. Get all WOW ratings here.


CMCSA shares were trading at $37.15 per share on Wednesday afternoon, down $0.09 (-0.24%). Year-to-date, CMCSA has declined -24.90%, versus a -12.42% rise in the benchmark S&P 500 index during the same period.


About the Author: Riddhima Chakraborty

Riddhima is a financial journalist with a passion for analyzing financial instruments. With a master’s degree in economics, she helps investors make informed investment decisions through her insightful commentaries.

More…

The post Comcast Stock Is Only TV Entertainment “Buy,” These 2 Others Are Duds appeared first on StockNews.com

https://www.entrepreneur.com/article/434062



How Option Prices Can Help Predict Future Stock Prices

Using an implied volatility based methodolgy to better time the best time to sell the QQQ.

shutterstock.com – StockNews

I highlighted last week some reasons why I thought stocks, and particularly QQQ, had finally formed a significant top in my latest commentary for POWR Options. One of the biggest reasons why the NASDAQ looks tired and toppy was complacency-which was reflected in the form of option prices.

Most of you are probably very familiar with the VIX-sometimes called the “Fear Index”. The VIX is a general measure of 30-day option prices on the S&P 500. It tends to spike when stock prices fall sharply and usually falls when stock prices rise.

VXN, or Vixen, is a similar measure of 30-day option prices using the NASDAQ 100 (QQQ) instead of the S&P 500 (SPY). Let’s take a look at how using the VXN as a market timing tool can help call significant short-term tops in the market. It is the equivalent of the Warren Buffett adage that says to “Be Fearful When Others Are Greedy.”

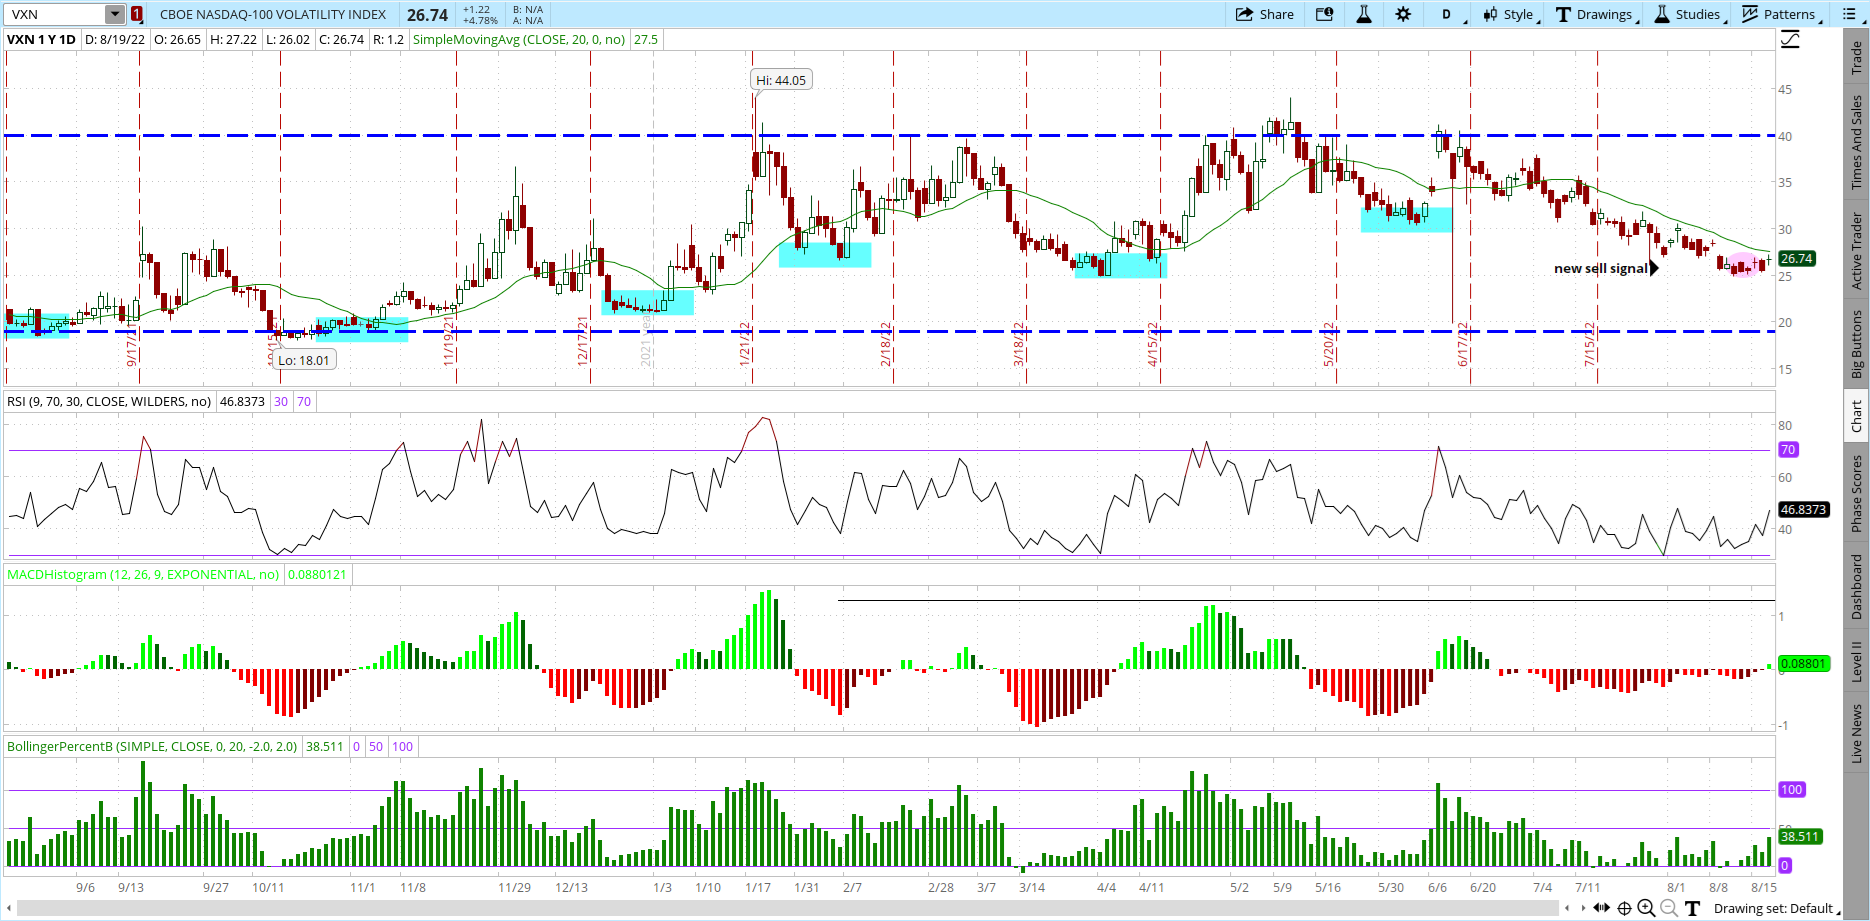
VXN sell signals are generated when VXN makes at least a 33% pullback from the previous high and then makes a reversal off the lows. Over the past 12 months there have been 6 such sell signals generated (highlighted in aqua on the chart below)

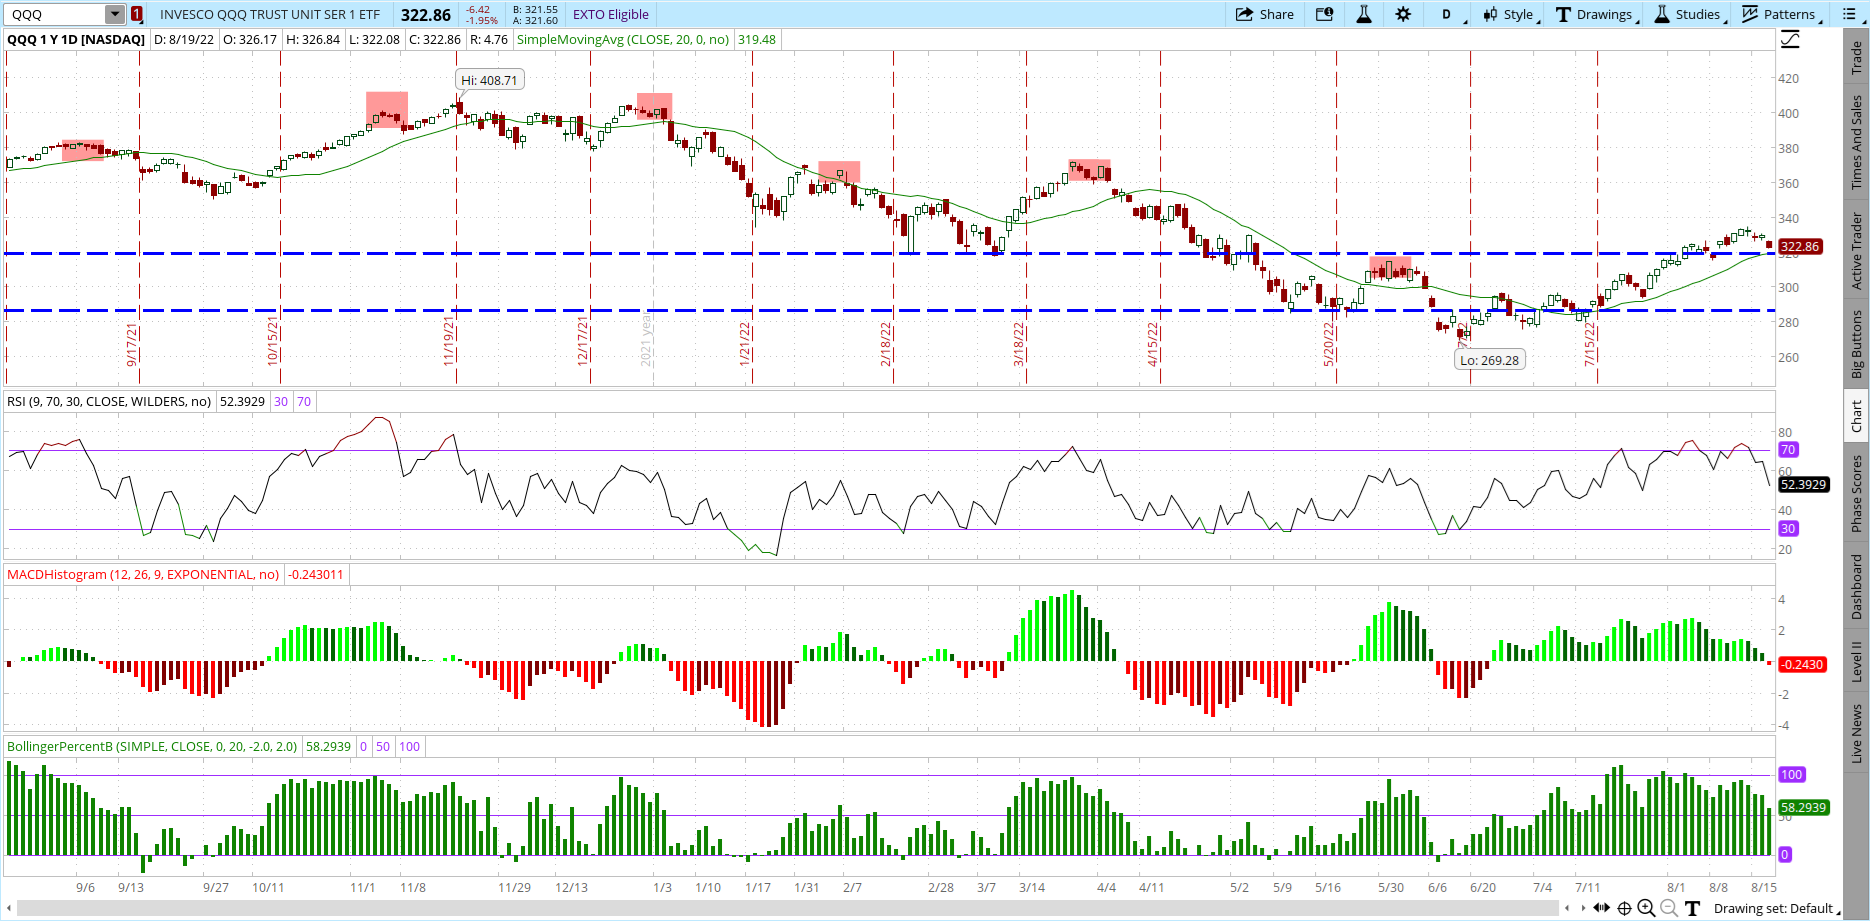
Below is the same time period 1 year chart of the QQQ. Note how the bottoms in VXN correspond precisely with the tops in QQQ (highlighted in red) .

I put together a quick snapshot summary of the VXN based sell signal methodology over the past year shown in the table below.

Price of sell Subsequent low Gain % gain Date of low Days to low
8/31/2021 379.95 352.62 27.33 7.19% 10/4/2021 34
11/5/2021 398.6 380.69 17.91 4.49% 12/20/2021 45
1/4/2022 396.47 341.4 55.07 13.89% 1/27/2022 23
2/10/2022 358.43 318.17 40.26 11.23% 3/14/2022 32
4/5/2022 361.1 291.15 69.95 19.37% 5/12/2022 37
6/8/2022 307.4 271.39 36.01 11.71% 6/16/2022 8
11.32% 29.83

The average pullback over the past six sell signals has been just over 11%. It has taken about a month (29.83 days on average) for stocks to find a subsequent bottom after the sell signal was generated.

Just as importantly, the sell signals never really were too early or wrong in calling a short-term top. None of the prior six signals would have caused any subsequent angst by using the VXN methodology as a market timing tool. Indeed, only one of the signals had a minor unrealized loss after taking a short position in the QQQ. The other five were pretty much spot on in calling the top.

Using the VXN methodology means the market will tell you when it is time to act. This can be important as many time fundamental analysis and technical analysis can be way too early…which in this market environment makes it difficult to hang on to a losing position for too long.

That’s not to say that fundamentals and other factors aren’t important as confirming indicators to take a bearish stance.

Both valuations and seasonality are also pointing to the probabilities favoring a pullback.

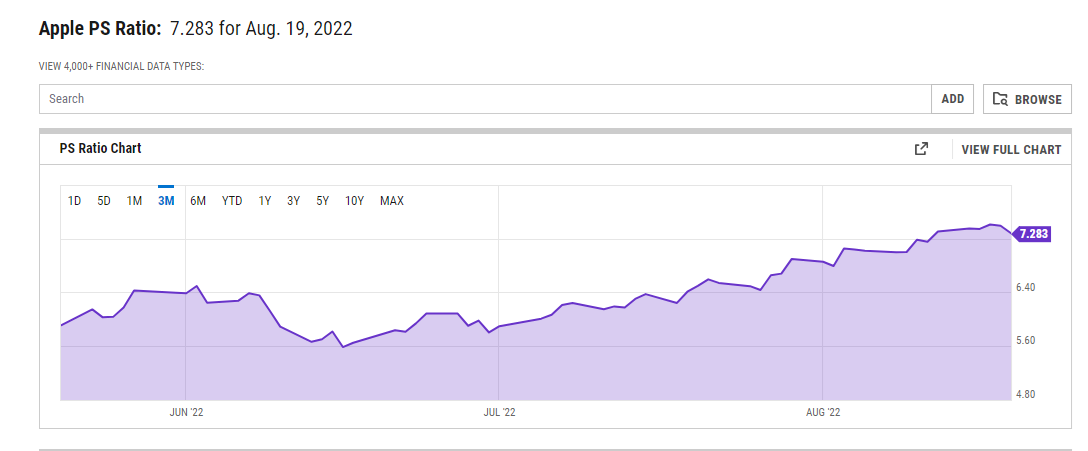
The two biggest market cap stocks in the NASDAQ 100 (QQQ) are Apple (AAPL) and Microsoft (MSFT). Both reached the highest multiples on a Price/Sales basis over the past three months before softening. Plus having 2 trillion-dollar plus market cap companies trading at such lofty valuations seems extreme unto itself. Further upside seems limited at best.

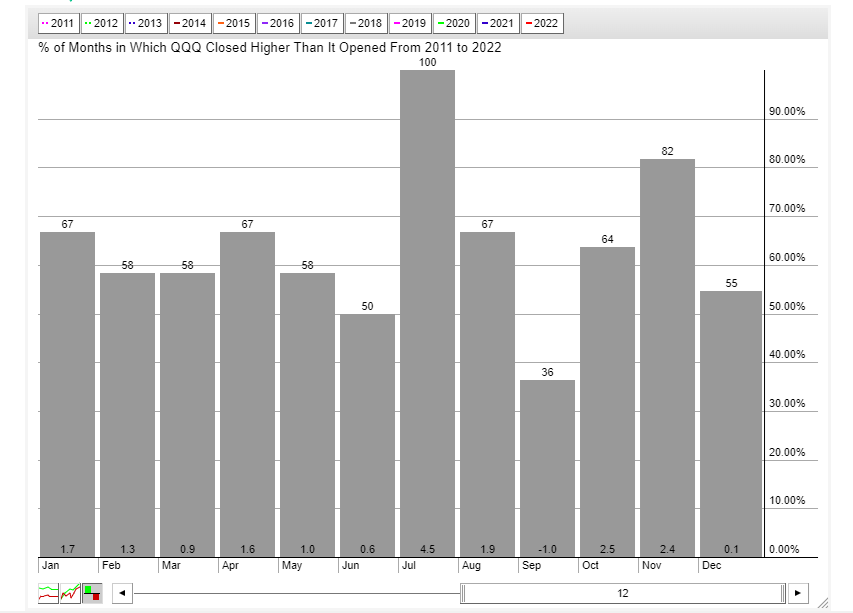
Seasonality supports the bearish argument as well.

Over the past twelve years September has been the only down month for QQQ. Shares have shown gains less than half the time with an average loss of 1%. Every other month is positive on both performance and number of up months versus down months.

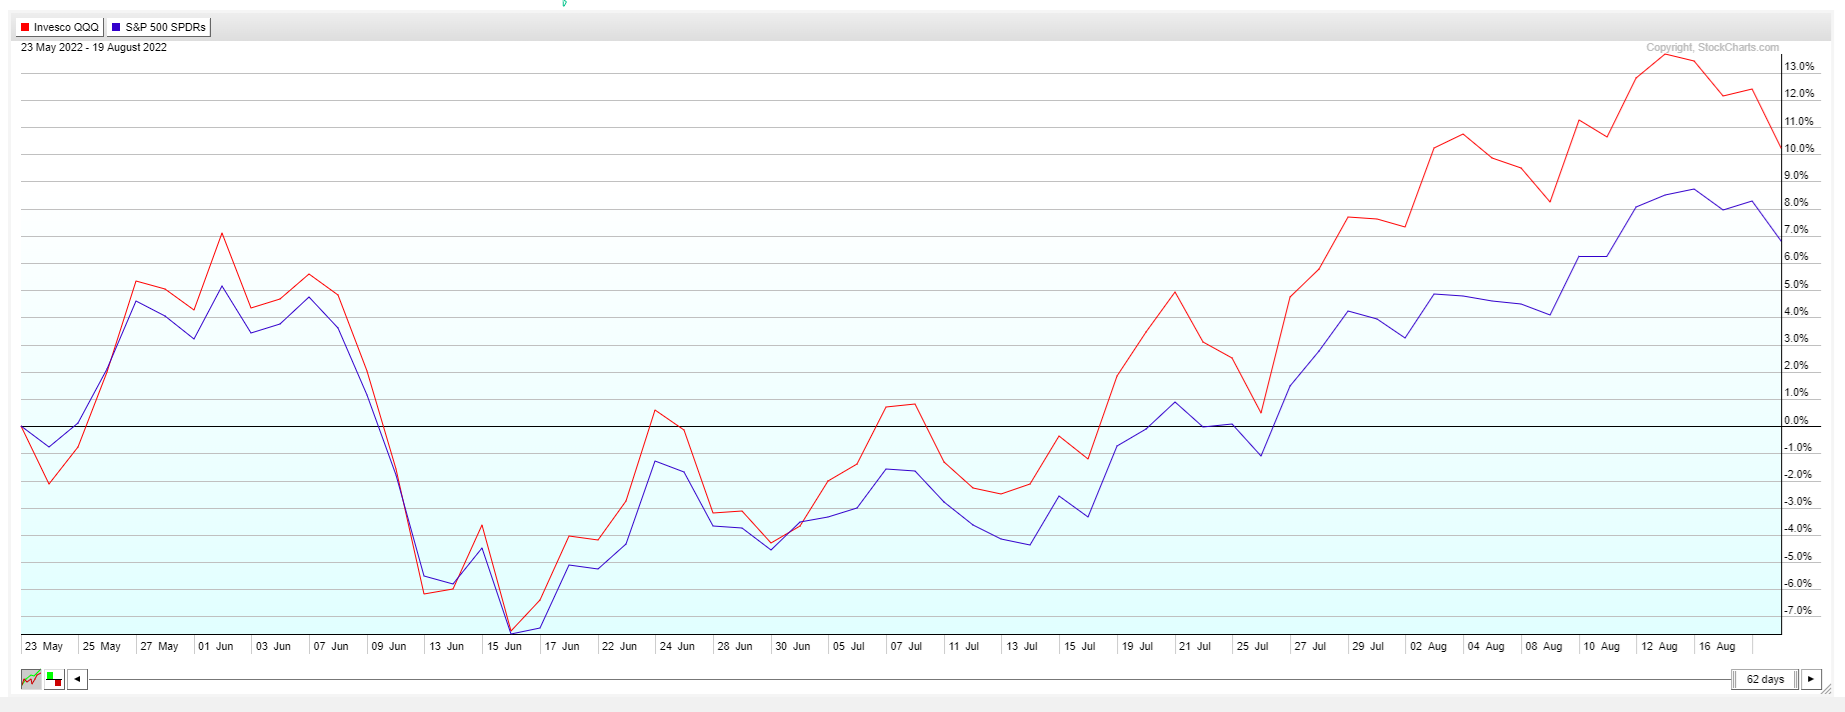
Comparative performance is also favoring a bigger pullback for QQQ versus SPY. Normally QQQ and SPY tend to be highly correlated. Over the past few months, however, QQQ has out-performed SPY to a large degree. Look for this correlation to revert back to the mean with QQQ beginning to under-perform to close that gap.

Comparative lows in the VXN also means option prices on the QQQ are comparatively cheap. This favors buying puts to take a defined risk short position. Exactly the type of strategy we use week-in and week-out in the POWR Options Portfolio.

So, traders looking to take a short position for the short-term would be best served buying puts versus shorting QQQ outright. Limited risk with potentially explosive returns. Plus an increase in implied volatility generally will be a benefit to the long put position as well.

POWR Options

What To Do Next?

If you’re looking for the best options trades for today’s market, you should check out our latest presentation How to Trade Options with the POWR Ratings. Here we show you how to consistently find the top options trades, while minimizing risk.

If that appeals to you, and you want to learn more about this powerful new options strategy, then click below to get access to this timely investment presentation now:

How to Trade Options with the POWR Ratings

All the Best!

Tim Biggam

Editor, POWR Options Newsletter


QQQ shares closed at $322.86 on Friday, down $-6.42 (-1.95%). Year-to-date, QQQ has declined -18.59%, versus a -10.46% rise in the benchmark S&P 500 index during the same period.


About the Author: Tim Biggam

Tim spent 13 years as Chief Options Strategist at Man Securities in Chicago, 4 years as Lead Options Strategist at ThinkorSwim and 3 years as a Market Maker for First Options in Chicago. He makes regular appearances on Bloomberg TV and is a weekly contributor to the TD Ameritrade Network “Morning Trade Live”. His overriding passion is to make the complex world of options more understandable and therefore more useful to the everyday trader. Tim is the editor of the POWR Options newsletter. Learn more about Tim’s background, along with links to his most recent articles.

More…

The post How Option Prices Can Help Predict Future Stock Prices appeared first on StockNews.com

https://www.entrepreneur.com/article/433824


Why the Stock Market Winning Streak Ended on a Sour Note…

The 4 week winning streak for stocks ended Friday on our sour note. Not only did the S&P 500 (SPY) tumble -1.29%, but the recent market leaders endured even worse results: -2.07% for Russell 2000 and -2.01% for tech laden Nasdaq. What does this mean for stock prices in the days ahead? And are we returning to bear market conditions? That will be the focus of this week’s commentary. Read on below for more….

shutterstock.com – StockNews

(Please enjoy this updated version of my weekly commentary from the POWR Value newsletter).

Stocks have been hot since going on an +18% run from the June lows. That’s really hot. Like standing on the sun hot.

So it is easy to look at this weeks sell off as nothing more than healthy profit taking as we go into a well deserved consolidation period.

This especially makes sense as you appreciate that Monday the S&P 500 (SPY) finally found resistance at the 200 day moving average (was 4,326, now a notch lower at 4,321).

This action led to a consolidation period and trading range as the next logical phase for this market. Yes, to digest recent gains. But also to await the next catalyst to determine if the market is truly in a long term bullish mood or if we sink back into bear market conditions.

As you will see from the title of my recent article it tips my hand as to what I see coming next. So be sure to read it now if you have not already as it covers a lot of important ground: 5 Reasons to Still Be Bearish.

One of the main themes in that article is that with inflation this high, and the Fed so hell-bent on raising rates, that its hard not to appreciate the damage that will be unleashed on the economy.

This is probably why the majority of participants in a recent Goldman Sachs survey of investment professionals saw a recession unfolding in the first half of 2023.

The release of the Fed Minutes on Wednesday further put an exclamation on the above as stocks did sell off sharply followed by much more pain on Friday.

Basically the Fed plans to keep raising rates until inflation eases substantially. And with inflation this high…it means a lot more rate hikes to follow.

This should be a shock to no one as they spent the better part of the last month on the speaking circuit telling anyone who would listen that they will continue to raise rates AGGRESSIVELY.

That is not a bullish idea. In fact, by its very nature it is meant to curb economic activity as a means to tame inflation.

So if not bullish is it bearish?

That is the key question investors are trying to answer. Meaning can the Fed raise rates this aggressively and not create a recession and extension of the bear market?

Possible…but not probable in my book which is why I remain bearish.

Bond investors clearly feel the same way given the inverted yield curve pointing out a recession likely to happen in next 1-2 years. And now we await stock investors seeing this with their own 2 eyes in areas like weakening of labor markets and lower corporate profits.

If and when those clues appear then we will retrace to the previous lows from June…and likely lower.

Let’s talk about the corporate earnings part as we are coming off the weakest earnings season since 2020. That may sound surprising given how much stocks rallied the past several weeks.

The best answer to that is that expectations were so horrifically low that it was easy to jump over the low hurdle.

What the image below shows is the erosion in the earnings outlook from when earnings season began on 7/1 til now. You will see that growth expectations have tapered for the next 3 quarters.

Most telling is how Q1-23 is teetering closer to no growth which coincides with the recession outlook noted above from the Goldman Sachs survey.

Now let me share with you the analysis that came along with this chart from my friend, Nick Raich over at EarningsScout.com. (note his points of emphasis in bold)

* Investors may be becoming too optimistic the Fed will win the battle against inflation without hurting future growth.

* They may also be too hopeful the Fed will start cutting interest rates in 2023.

* Our research indicates the worst of S&P 500 EPS estimate cuts are not over.

* A big reason we believe the worst of the estimate cuts are not over is because overall S&P 500 EPS expectations (i.e. multiple periods of quarterly and annual EPS estimates) are only falling at a rate of -2.26%.

* To put that in perspective, overall S&P 500 EPS expectations were falling at a rate of -25% in March 2020 and at rates of nearly -50% in 2000 and 2008.

* For this reason, we anticipate EPS estimate cuts greater than -3% to occur in upcoming 3Q 2022 earnings season, which peaks in mid-to-late October.

* Stay underweight stocks.

Nick and I both spent a lot of years together at Zacks Investment Research where we appreciated the connection between earnings trends and stock prices. So it is very hard for us to see the current estimate drops and not be cautious about our stock market (SPY) outlook.

Worse still is that more estimate declines are likely to come as the Fed puts the brakes on the economy with higher rates. And that is why its hard to agree to the growing bullish sentiment at this time.

For now, I see a consolidation period with trading range being formed. The highs were just found at the 200 day moving average (now at 4,321). And the low side is likely framed by the 100 day moving average (4,096).

All moves inside this range are meaningless noise. That includes the Friday sell off. Investors are awaiting clear and obvious indicators of whether we are truly ready to breakout into a new bull market. Or whether the bear market is still in charge with a likely return to June lows if not lower to follow.

My bet is on the bearish argument to emerge victorious. Yet prepared to objectively review the information as it rolls in and become bullish if need be.

Portfolio Update

Many new people are joining POWR Value this week. And thus no doubt you likely find the above commentary confusing given that we have a portfolio filled with many stocks. So let me spell it out like this…

Think of most every mutual fund or ETF you have ever purchased. All of them have written objectives, which is essentially a mission statement they live by.

In the fund world it would be something like “This fund focuses on small cap growth stocks to achieve long term share price appreciation.”

And rain or shine that fund will stick to the objective no matter if investors are rotating away from small caps. No matter if it is the worst bear market in the history of mankind.

I believe that newsletters should basically work the same way. And in the case of POWR Value I seek to find the very best value stocks regardless of market conditions.

The one difference from the fund example, is that I allow the portfolio to not always be 100% invested. In fact, right now we are only 43.5% invested…but that will go back up to 50.5% when I add the next pick on Monday morning.

The point is that this heavier allocation to cash is a nod to market conditions which I believe to still be quite bearish.

For those who want more of an active trading, market timing element to their portfolio, then be sure to check out how I am running my Reitmeister Total Return service.

There the objective includes market timing and ability to go short when necessary. Right now my solution for the emerging consolidation period and trading range is a hedged portfolio balanced with inverse ETFs and a handful of my favorite stock positions.

Actually it is working spectacularly well this past week as the market has come off recent highs.

Gladly the approach for POWR Value has also worked spectacularly well to date just by having a higher % of cash when the going was rough along with the continued outperformance of our picks packed with the advantages found in the POWR Ratings system.

As of the close tonight the S&P 500 has fallen -11.28% on the year while the POWR Value portfolio has gladly turned that frown upside down with a modest gain.

Long story short, there is more than one way to attack today’s market conditions. No doubt I am proud of what we are doing with POWR Value…but if the approach from Reitmeister Total Return has more appeal to you…then please be sure to get access here.

What To Do Next?

Discover my hedged portfolio of exactly 10 positions to help generate gains as the market descends back into a bear market territory.

This is not my first time employing this strategy. In fact, I did the same thing at the onset of the Coronavirus in March 2020 to generate a +5.13% return the same week the market tumbled nearly -15%.

If you are fully convinced this is a bull market…then please feel free to ignore.

However, if the bearish argument shared above does make you curious as to what happens next…then do consider getting my “Bear Market Game Plan” that includes specifics on the 10 positions in my hedged portfolio.

Click Here to Learn More >

Wishing you a world of investment success!

Steve Reitmeister…but everyone calls me Reity (pronounced “Righty”)
CEO, StockNews.com
Editor of Reitmeister Total Return & POWR Value


SPY shares closed at $422.14 on Friday, down $-5.75 (-1.34%). Year-to-date, SPY has declined -10.46%, versus a % rise in the benchmark S&P 500 index during the same period.


About the Author: Steve Reitmeister

Steve is better known to the StockNews audience as “Reity”. Not only is he the CEO of the firm, but he also shares his 40 years of investment experience in the Reitmeister Total Return portfolio. Learn more about Reity’s background, along with links to his most recent articles and stock picks.

More…

The post Why the Stock Market Winning Streak Ended on a Sour Note… appeared first on StockNews.com

https://www.entrepreneur.com/article/433807


Should You Buy the Dip in This Software Giant?

Shares of Renowned software company Adobe (ADBE) are trading way below their 52-week high despite the company delivering impressive second-quarter results and remarkable revenue and earnings growth estimates by analysts. Furthermore, the company is expected to suffer from macroeconomic and geopolitical headwinds. So, let’s find out if it is wise to buy this stock on the dip….

shutterstock.com – StockNews

Diversified software company Adobe Inc. (ADBE) operates through three segments: Digital Media; Digital Experience; and Publishing and Advertising. The company serves professionals, marketers, content creators, application developers, consumers, enterprises, advertisers, merchandisers, web analysts, and data scientists.

ADBE delivered strong financial results for the second quarter. The company achieved record revenue during the quarter, driven by solid demand across Creative Cloud, Document Cloud, and Experience Cloud. It reported more than $2 billion in operating cash flows, demonstrating its growing revenue streams and financial discipline.

“Our operating model continues to fuel consistent growth, enabling the company to invest in category-leading cloud solutions and emerging innovations that are gaining traction in the marketplace,” said Dan Durn, ADBE’s executive vice president, and CFO.

In June, ADBE unveiled innovations for its customer data platform (CDP), Adobe Real-Time CDP, to assist global brands in transitioning from third-party cookies to first-party data. To accelerate the first-part data strategy, Adobe introduced enriched customer profiles with commerce, AI-powered targeting, new privacy tools, and Segment Match across channels.

In the same month, ADBE announced significant updates to Adobe Substance 3D, a suite of tools and services that support 3D content creation. The updates include a 3D Materials SDK for developers, powerful new plugins, and native Apple M-series chips support for Painter, Designer, and Sampler. Substance 3D applications demonstrate strong demand by surpassing 100% year-over-year growth.

Despite strong financials and bright growth prospects, ADBE is expected to face several macroeconomic and geopolitical headwinds in the upcoming months, including the impact of the ongoing war in Russia-Ukraine and the company’s decision to cease all new sales in Russia and Belarus, the increase in effective tax rates, and an incremental FX headwind of $175 million the third quarter and fourth quarter revenue.

Shares of ADBE have declined 22.2% year-to-date and 30% over the past year to close the last trading session at $439.03. The stock is currently trading 37.2% below its 52-week high of $699.54, which it hit on November 22, 2021.

Here is what could influence ADBE’s performance in the upcoming months:

Robust Financials

ADBE’s revenue increased 14.4% year-over-year to $4.39 billion, and its gross profit grew 13.5% year-over-year to $3.85 billion in the fiscal 2022 second quarter ended June 3, 2022. The company’s non-GAAP operating income amounted to $1.97 billion, up 12% year-over-year.

Furthermore, the company’s non-GAAP net income and net income per share came in at $1.59 billion and $3.35, registering increases of 8.9% and 10.6% from the prior-year period, respectively.

Favorable Analyst Estimates

Analysts expect ADBE’s revenue for the fiscal 2022 third quarter (ending August 2022) to come in at $4.44 billion, representing an increase of 12.9% from the same period in 2021. The current quarter’s $3.35 consensus EPS estimate indicates a 7.6% year-over-year increase. The company has surpassed the consensus revenue and EPS estimates in each of the trailing four quarters.

In addition, ADBE’s revenue and EPS for the fiscal year 2022 (ending November 2022) are expected to rise 12% and 8.5% year-over-year, respectively. Also, analysts expect the company’s revenue and EPS for the next year to grow 14% and 17.6% year-over-year, respectively.

Stretched Valuation

In terms of forward non-GAAP P/E, ADBE is currently trading at 32.42x, 67.8% higher than the industry average of 19.32x. The stock’s forward EV/Sales multiple of 11.58 is 279.4% higher than the industry average of 3.05. Also, its forward EV/EBITDA and Price/Sales ratios of 23.31 and 11.62 compared with industry averages of 13.22 and 3.00, respectively.

Furthermore, in terms of forward Price/Cash Flow, ADBE is currently trading at 26.64x, 38.7% higher than the industry average of 19.21x.

High Profitability

ADBE’s trailing-12-month gross profit margin of 87.87% is 74.6% higher than the 50.33% industry average. Its trailing-12-month EBITDA margin of 39.91% is 205.9% higher than the 13.05% industry average. Likewise, the stock’s trailing-12-month net income margin of 29.29% compares with the industry average of 4.25%.

Furthermore, ADBE’s trailing-12-month ROCE, ROTC, and ROTA of 35.13%, 20.34%, and 18.57% are higher than the industry averages of 7.28%, 3.96%, and 2.74%, respectively.

POWR Ratings Do not Indicate Enough Upside

ADBE has an overall rating of C, which translates to Neutral in our proprietary POWR Ratings system. The POWR Ratings are calculated considering 118 distinct factors, with each factor weighted to an optimal degree.

ADBE has a grade of A for Quality, in sync with its higher-than-industry profitability multiples. In addition, ADBE has a D grade for Momentum. This is justified as the stock is currently trading below its 200-day moving average of $477.26.

Furthermore, ADBE has a grade of C for Stability. The stock’s beta of 1.39 justifies the Stability grade.

Of the 154 stocks in the Software-Application industry, ADBE is ranked #33.

Beyond what I have stated above, we have also given ADBE grades for Sentiment, Growth, and Value. Get access to all the ADBE ratings here.

Bottom Line

Despite reporting promising latest quarterly results, investors have been bearish about ADBE, owing to its sky-high valuation and relatively low stability. Moreover, the company is expected to remain under pressure in the coming months due to various macroeconomic and geopolitical headwinds. Thus, investors should wait for a better entry point in the stock.

How Does Adobe Inc. (ADBE) Stack Up Against its Peers?

While ADBE has a C rating in our proprietary rating system, one might want to consider looking at its industry peers, IBEX Ltd. (IBEX), American Software, Inc. (AMSWA), and Progress Software Corporation (PRGS), which have an A (Strong Buy) rating.


ADBE shares were trading at $425.97 per share on Friday afternoon, down $13.06 (-2.97%). Year-to-date, ADBE has declined -24.88%, versus a -10.31% rise in the benchmark S&P 500 index during the same period.


About the Author: Mangeet Kaur Bouns

Mangeet’s keen interest in the stock market led her to become an investment researcher and financial journalist. Using her fundamental approach to analyzing stocks, Mangeet’s looks to help retail investors understand the underlying factors before making investment decisions.

More…

The post Should You Buy the Dip in This Software Giant? appeared first on StockNews.com

https://www.entrepreneur.com/article/433791


4 High-Volume Stocks Investors Should Sell Right Now

The stock market has been witnessing a rally lately, with robust economic data and a decline in inflation in July boosting investors’ sentiment. However, as inflation remains elevated and geopolitical issues continue, the market could witness volatility in the months ahead. Therefore, fundamentally weak stocks AMC Entertainment (AMC), Carnival Corporation (CCL), SoFi Technologies (SOFI), and Shopify (SHOP), which are trading at high volume with the return of meme frenzy, could be best avoided now. Read on….

shutterstock.com – StockNews

The July CPI data showed a decline in inflation from the multi-decade high level. This, along with a robust job market and improved consumer sentiment, has driven the benchmark indexes higher over the past few days.

However, the current level of inflation could prompt further interest rate hikes as it remains elevated. According to Wharton professor Jeremy Siegel, the second half of 2022 seems favorable for the U.S. stock market, but it will drop to the lows set in June if the Federal Reserve decides to raise interest rates to 4% or higher.

Roubini, an Iranian American economist, said, “The recession is going to be long, protracted, severe, and associated with financial distress across the board.” Also, the tensions between China and Taiwan could further affect the market’s prospects.

Since the market is expected to remain volatile, it could be wise to avoid fundamentally weak stocks AMC Entertainment Holdings, Inc. (AMC), Carnival Corporation & plc (CCL), SoFi Technologies, Inc. (SOFI), and Shopify Inc. (SHOP), which are trading at high volume with the return of the meme craze.

AMC Entertainment Holdings, Inc. (AMC)

AMC, along with its subsidiaries, engages in the theatrical exhibition business. The company owns, operates, or has interests in theaters in the United States and Europe. As of March 1, 2022, it operated approximately 950 theaters and 10,600 screens. The company is headquartered in Leawood, Kansas. It has traded at an average volume of 46,726,345 over the past three months.

During the second quarter ending June 30, 2022, AMC’s operating loss amounted to $16.10 million. Its net loss came in at $121.60 million, while its adjusted loss per share amounted to $0.20. The company’s net cash used in operating activities amounted to $76.60 million for the quarter ending June 30, 2022.

AMC’s EPS is expected to remain negative in the third quarter ending September 2022. The stock has plunged 30.5% over the past year and 41.8% over the past nine months.

AMC’s POWR Ratings are consistent with this bleak outlook. The company’s overall D rating translates to Sell in our proprietary rating system. The POWR Ratings are calculated by considering 118 different factors, with each factor weighted to an optimal degree.

AMC has an F grade for Stability and a D for Value and Sentiment. Within the F-rated Entertainment – Movies/Studios industry, it is ranked #7 of 7 stocks.

To see additional POWR Ratings for Momentum, Growth, and Quality for AMC, click here.

Carnival Corporation & plc (CCL)

CCL functions as a leisure travel company. Its ships visit approximately 700 ports under the Carnival Cruise Line, Princess Cruises, Holland America Line, P&O Cruises (Australia), Seabourn, Costa Cruises, AIDA Cruises, P&O Cruises (UK), and Cunard brand names. It has traded at an average volume of 54,741,832 over the past three months.

Last month, CCL announced that it closed its previously announced underwritten public offering of 102,139,621 shares of common stock of the company at a public offering price of $9.95 per share.

The company expects to use the net proceeds from the offering for general corporate purposes, which could include addressing 2023 debt maturities. This will lead to dilution of shares, impacting the current shareholder ownership interest.

For the second quarter ending May 31, 2022, CCL’s operating loss came in at $1.47 billion. Its net loss amounted to $1.83 billion, while its loss per share stood at $1.61 for the quarter. Net cash used in operating activities stood at $1.21 billion for six months ended May 31, 2022.

Analysts expect CCL’s EPS to remain negative in the third quarter ending August 2022. The company’s shares have plunged 50.9% over the past year and 52% over the past month.

CCL’s POWR Ratings are consistent with this bleak outlook. The stock has an overall rating of D, which translates to Sell in our proprietary rating system. The POWR Ratings are calculated by considering 118 different factors, with each factor weighted to an optimal degree.

CCL has an F grade for Stability and Sentiment and a D for Value. Within the F-rated Travel – Cruises industry, it is ranked #2 of 4 stocks.

To see additional POWR Ratings for Growth, Quality, and Momentum for CCL, click here.

SoFi Technologies, Inc. (SOFI)

Headquartered in San Francisco, California, SOFI offers digital financial services. It has three operational segments: Lending, Technology Platform, and Financial Services. The company’s financial services and products permit its members to borrow, save, spend, invest, and protect their money. SOFI has traded at an average volume of 37,431,372 over the past three months.

For the second quarter ending June 30, 2022, SOFI’s total noninterest expenses increased 15.5% year-over-year to $458.24 million, while its net loss amounted to $95.84 million, while its loss per share came in at $0.14. The company’s net cash used in operating activities stood at $1.96 billion compared to net cash provided by operating activities of $82.61 million.

SOFI’s EPS is expected to remain negative in the third quarter ending September 2022. The company’s shares have declined 52.1% year-to-date and 65% over the past nine months.

SOFI’s poor prospects are also apparent in its POWR Ratings. The stock has an overall F grade, equating to a Strong Sell in our proprietary rating system. It also has an F grade for Stability and Quality and a D for Value. SOFI is ranked #104 of 106 stocks in the F-rated Financial Services (Enterprise) industry.

Click here to see the additional POWR Ratings for SOFI (Growth, Sentiment, and Momentum).

Shopify Inc. (SHOP)

Headquartered in Ottawa, Canada, SHOP provides an e-commerce platform and services in Canada, the United States, Europe, the Middle East, Africa, the Asia Pacific, and Latin America. The company’s platform permits merchants to display, manage, market, and sell its products through various sales channels. It has traded at an average volume of 36,733,400 over the past three months.

In the second quarter ending June 30, 2022, SHOP’s loss from operations came in at $190.21 million compared to an income of $139.44 million in the prior-year quarter. Its net loss came in at $1.20 billion compared to a net income of $879.09 billion in the year-ago period, while its loss per share came in at $0.95 compared to an EPS of $0.69 a year ago.

The company’s EPS is expected to remain negative in the third quarter ending September 2022. The stock has plunged 73.4% over the past year and 76.4% over the past nine months.

SHOP’s poor prospects are also apparent in its POWR Ratings. The stock has an overall F rating, which equates to a Strong Sell in our POWR Ratings system. It has a D grade for Sentiment, Stability, and Growth. SHOP is #29 of 30 stocks in the F-rated Internet – Services industry.

Click here to see the additional POWR Ratings for SHOP (Quality, Value, and Momentum).


AMC shares were trading at $23.98 per share on Wednesday morning, down $0.83 (-3.35%). Year-to-date, AMC has declined -11.84%, versus a -9.40% rise in the benchmark S&P 500 index during the same period.


About the Author: Spandan Khandelwal

Spandan’s is a financial journalist and investment analyst focused on the stock market. With her ability to interpret financial data, she aims to help investors evaluate the fundamentals of a company before investing.

More…

The post 4 High-Volume Stocks Investors Should Sell Right Now appeared first on StockNews.com

https://www.entrepreneur.com/article/433607


This 1 Stock Makes a Safe Bet for Income Investors

Vodafone (VOD) reported solid revenue growth in its last reported quarter despite the macroeconomic headwinds. Moreover, given its impressive history of shareholder returns in the form of dividends, we think this stock could be an ideal option for investors looking for a stable income stream. Continue reading….

shutterstock.com – StockNews

Vodafone Group Public Limited Company (VOD) provides telecommunication services in Europe and worldwide. The company offers mobile services that enable customers to call, text, and access data; fixed line services, including broadband, television (TV) offerings, and voice; and convergence services under the GigaKombi and Vodafone One brands to customers.

Since the telecom industry is defensive, VOD’s business has not been affected much by the high inflation and the other headwinds. The stock has gained 0.7% year-to-date.

Nick Read, Group Chief Executive of VOD, commented, “We have executed in line with our expectations, delivered another quarter of growth in both Europe and Africa, and seen an acceleration in business growth. Whilst we are not immune to the current macroeconomic challenges, we’re on track to deliver financial results for the year in line with our guidance.”

Here is what could influence VOD’s performance:

Robust Financials

VOD’s total revenue increased 1.6% year-over-year to €11.28 billion ($11.46 billion) for the first quarter ending June 2022. Europe Consumer contract mobile ARPU grew 0.7% year-over-year, supported by higher roaming and digital services revenue.

The group service revenue excluding turkey rose 2.2% year-over-year to €9.21 billion ($9.36 billion), while its Vodafone Business – Service revenue increased 0.6% from the year-ago value to €2.56 billion ($2.60 billion).

Discounted Valuation

The stock’s 14.72X forward non-GAAP P/E is 17.3% lower than its industry average of 17.79x. Also, its trailing-12-month EV/Sales of 2.02X is 6.5% lower than its industry average of 2.16x. Its 6.52x forward EV/EBITDA is 26.6% lower than its industry average of 8.89x.

Impressive Shareholder Returns

VOD paid a semiannual dividend of $0.46 on May 8, 2022. VOD’s $0.91 annual dividend yields 6.2% at the current share price. Also, it has a four-year average dividend yield of 6.8%.

POWR Ratings Show Promise

VOD has an overall B grade, which equates to a Buy in our proprietary POWR Ratings system. The POWR Ratings are calculated by considering 118 distinct factors, with each factor weighted to an optimal degree.

Our proprietary rating system also evaluates each stock based on eight distinct categories. VOD has an A grade for Growth and a B for Value and Stability. VOD’s impressive financials justify its Growth grade. The company’s lower-than-industry valuation is consistent with its Value grade. Its 0.63 beta is in sync with its Stability.

Among the 47 stocks in the A-rated Telecom – Foreign industry, VOD is ranked #22.

Beyond what I stated above, we have graded VOD for Sentiment, Quality, and Momentum. Get all VOD ratings here.

Bottom Line

VOD’s robust revenue growth reflects the company’s ability to remain resilient amid a slowing economy. The stock’s lower-than-industry valuation and dividend payments make it a solid buy for investors looking for a steady income stream.

How does Vodafone (VOD) Stack Up Against its Peers?

VOD has an overall POWR Rating of B, which equates to a Buy. Check out these other stocks within the Telecom – Foreign industry with A (Strong Buy) ratings: Telekom Austria AG (TKAGY), MTN Group Limited (MTNOY), and Internet Initiative Japan Inc. (IIJIY).


VOD shares were trading at $14.77 per share on Wednesday morning, down $0.27 (-1.80%). Year-to-date, VOD has gained 1.66%, versus a -9.48% rise in the benchmark S&P 500 index during the same period.


About the Author: Spandan Khandelwal

Spandan’s is a financial journalist and investment analyst focused on the stock market. With her ability to interpret financial data, she aims to help investors evaluate the fundamentals of a company before investing.

More…

The post This 1 Stock Makes a Safe Bet for Income Investors appeared first on StockNews.com

https://www.entrepreneur.com/article/433603


The 2 Worst Stocks to Sell During Economic Turmoil

The stock market remains highly volatile, with inflation still hovering near a 40-year high and the Fed’s consecutive rate hikes to combat it. Moreover, the rising tension between China and Taiwan is adding to the geopolitical issues. Given the uncertainties ahead, it might be best to avoid fundamentally bleak stocks, Wynn Resorts (WYNN) and Boot Barn Holdings (BOOT). Keep reading….

shutterstock.com – StockNews

The stock market has witnessed its worst first half in over 50 years in 2022 due to the Russia-Ukraine war, the multi-decade high inflation, and the Fed’s interest rate hikes to tame the rising prices. On the other hand, the conflict brewing between China and Taiwan could worsen the geopolitical crisis.

Additionally, a resilient job market could prompt the Fed to go ahead with another steep interest rate hike to thwart inflation, tempering recession fears. Moreover, Federal Reserve Chairman Jerome Powell has raised the possibility of a third-straight 0.75-percentage point rate hike. “Another unusually large increase could be appropriate” at the September meeting, he said.

Given the uncertain macro environment, we think it could be best to avoid fundamentally weak stocks Wynn Resorts, Limited (WYNN) and Boot Barn Holdings, Inc. (BOOT).

Wynn Resorts, Limited (WYNN)

WYNN designs, develops, and operates integrated resorts through its Wynn Palace, Wynn Macau, and Las Vegas Operations segments.

For the fiscal second quarter ended June 30, 2022, WYNN’s total operating revenues decreased 8.2% year-over-year to $908.83 million. Net loss increased 23.1% from the prior-year quarter to $213.42 million, while operating loss came in at $52.03 million, up 76.2% year-over-year. Net loss per share came in at $1.14.

The consensus revenue estimate of $870.69 million for the fiscal first quarter ending September 2022 indicates a 12.5% year-over-year decline. Analysts expect its EPS to come in at a negative $1.09 in the same period. The company also missed the consensus EPS estimates in all the trailing four quarters.

In terms of its forward Price/Sales, WYNN is currently trading at 1.98x, 98.1% higher than the industry average of 1x. Its forward EV/Sales multiple of 4.35 is 257.8% higher than the industry average of 1.22.

The stock has declined 30.3% over the past nine months to close the last trading session at $68.33.

WYNN’s POWR Ratings reflect this bleak outlook. The stock has an overall rating of D, equating to Sell in our proprietary rating system. The POWR Ratings are calculated by considering 118 different factors, with each factor weighted to an optimal degree.

WYNN has a Value, Sentiment, and Stability grade of D. In the 29-stock, D-rated Entertainment – Casinos/Gambling industry, it is ranked #23.

Click here to see the additional POWR Ratings for WYNN (Growth, Momentum, and Quality).

Boot Barn Holdings, Inc. (BOOT)

BOOT, a lifestyle retail chain, operates specialty retail stores in the United States.

For the fiscal first quarter ended June 25, 2022, BOOT’s income from operations decreased 2.3% year-over-year to $52.43 million. Net income decreased 3.3% from the prior-year period to $39.32 million. The company’s EPS came in at $1.29, down 4.4% from the prior-year period.

For the fiscal quarter ending September 2022, Street EPS estimate of $0.90 reflects a 27.8% year-over-year decrease. Also, the EPS estimate of $6.03 indicates a 4.7% year-over-year decline in the ongoing fiscal year.

In terms of its forward Price/Book, BOOT is currently trading at 2.97x, 7.6% higher than the industry average of 2.76x. Its forward EV/Sales multiple of 1.52 is 25% higher than the industry average of 1.22.

The stock has slumped 40.7% year-to-date and 19.3% over the past three months to close the last trading session at $73.01.

It’s no surprise that BOOT has an overall D rating, which translates to Sell in our POWR Rating system. The stock has a D grade for Stability and Sentiment. It is ranked #63 of 67 stocks in the Fashion & Luxury industry.

To see the additional POWR Ratings for Growth, Momentum, Quality, and Value for BOOT, click here.


WYNN shares were trading at $67.38 per share on Tuesday morning, down $0.95 (-1.39%). Year-to-date, WYNN has declined -20.77%, versus a -9.26% rise in the benchmark S&P 500 index during the same period.


About the Author: Komal Bhattar

Komal’s passion for the stock market and financial analysis led her to pursue investment research as a career. Her fundamental approach to analyzing stocks helps investors identify the best investment opportunities.

More…

The post The 2 Worst Stocks to Sell During Economic Turmoil appeared first on StockNews.com

https://www.entrepreneur.com/article/433515


3 Popular Nasdaq 100 Stocks to Avoid Right Now

The Fed is expected to maintain its hawkish stance despite easing inflation numbers, which might impede the performance of the Nasdaq 100. Moreover, given the rising recession fears, it could be wise to avoid popular yet fundamentally weak Nasdaq 100 stocks, Advanced Micro Devices (AMD), Blackstone (BX), and BlackRock (BLK) now. Read on to know more….

shutterstock.com – StockNews

The Fed launched two back-to-back 75 bps rate hikes in June and July and is likely to maintain its hawkish stance in the September meeting as well, despite easing inflation.

Victoria Fernandez, the chief market strategist at Crossmark Global Investments, said, “For me, there’s not enough evidence for the Fed to make a huge pivot from where they are. I still think they’re considering 50, 75 basis points at the September meeting.”

Such extended monetary tightening might mar the performance of the interest rate-sensitive Nasdaq 100, which has lost 16.3% year-to-date. Moreover, lingering macroeconomic headwinds are concerning. According to Statista, there is a 5.9% probability that the United States will fall into another recession by June 2023, up from a previous estimate of 4.1%.

Furthermore, JPMorgan Chase CEO Jamie Dimon recently projected that there is a 20% to 30% chance of a “harder recession” and a similar chance of “something worse.”

Given the near-term uncertainties, we think it might be best to avoid popular Nasdaq 100 stocks Advanced Micro Devices, Inc. (AMD), Blackstone Inc. (BX), and BlackRock, Inc. (BLK) at this hour, considering their declining financials.

Advanced Micro Devices, Inc. (AMD)

AMD operates as a semiconductor company worldwide. The company has two segments- Computing and Graphics; and Enterprise, Embedded, and Semi-Custom. It serves original equipment manufacturers, public cloud service providers, original design manufacturers, system integrators, independent distributors, online retailers, and add-in-board manufacturers.

AMD’s net revenue increased 70.1% year-over-year to $6.55 billion for the second quarter ended June 25, 2022. However, its operating income came in at $526 million, down 36.7% year-over-year. Also, its net income came in at $447 million, down 37% year-over-year, while its EPS decreased 53.4% year-over-year to $0.27.

AMD’s forward EV/S of 6.12x is 95.7% higher than the industry average of 3.12x, while its forward P/S of 6.22x is 100% higher than the industry average of 3.12x.

The stock has lost 29.8% year-to-date to close the last trading session at $101.01.

AMD’s POWR Ratings reflect its poor prospects. It has an overall grade of D, which indicates a Sell in our proprietary rating system. The POWR Ratings assess stocks by 118 different factors, each with its own weighting.

Also, the stock has a D grade for Stability. Click here to access the additional POWR Ratings for AMD (Growth, Value, Momentum, Sentiment, and Quality). AMD is ranked #85 out of 95 stocks in the Semiconductor & Wireless Chip industry.

Blackstone Inc. (BX)

BX is an alternative asset management firm specializing in real estate, private equity, hedge fund solutions, credit, secondary funds of funds, public debt and equity, and multi-asset class strategies. It invests in early-stage companies and also provides capital markets services.

On August 9, 2022, BX’s subsidiaries completed the acquisition of all of the outstanding shares of American Campus Communities, Inc., the largest developer, owner, and manager of high-quality student housing communities in the United States.

Also, on July 20, 2022, BX’s affiliates completed the acquisition of all of the outstanding shares of PS Business Parks, Inc. However, these acquisitions might strain its already deteriorating financials.

BX’s total revenues decreased 88.1% year-over-year to $629.22 million for the 2022 second quarter. Its net loss came in at $29.39 million, compared to a net income of $1.31 billion in the year-ago period. Moreover, its loss per share came in at $0.04 compared to an EPS of $1.82 in the prior-year period.

BX’s forward P/S of 5.73x is 89.9% higher than the industry average of 3.02x. Its forward P/Book of 14.91x is significantly higher than the industry average of 1.23x.

BX’s revenue is expected to decline 32.6% year-over-year to $3.01 billion for the quarter ended December 2022. Its EPS is expected to decrease 33.9% year-over-year to $1.13 for the same period. The stock has lost 16% year-to-date to close the last trading session at $108.68.

BX has an overall D grade, equating to Sell in our POWR Ratings system. Also, it has a D grade for Growth, Value, Stability, and Sentiment.

Click here to access the BX ratings for Momentum and Quality. It is ranked #29 out of 36 stocks in the F-rated Private Equity industry.

BlackRock, Inc. (BLK)

BLK is a publicly owned investment manager. The firm primarily provides services to institutional, intermediary, and individual investors. The firm employs liquidity, asset allocation, balanced, real estate, and alternative strategies to make its investments.

For the second quarter ended June 30, 2022, BLK’s total revenue decreased 6.1% year-over-year to $4.53 billion. Its net income came in at $1.08 billion, down 21.8% year-over-year. The company’s EPS came in at $7.06, down 20.9% year-over-year.

BLK’s forward EV/S of 6.42x is 122.5% higher than the industry average of 2.89x. Its forward P/S of 6.23x is 106.6% higher than the industry average of 3.02x.

Street expects BLK’s revenue to decrease 13.7% year-over-year to $4.36 billion for the quarter ended September 2022. Its EPS is expected to decline 26% year-over-year to $8.10 for the same period. The stock has lost 17.5% year-to-date to close the last trading session at $755.82.

BLK’s POWR Ratings are consistent with this bleak outlook. The stock has a D grade for Growth and Value.

We also have graded BLK for Momentum, Stability, Sentiment, and Quality. Click here to access all of BLK’s ratings. It is ranked #48 out of 60 stocks in the D-rated Asset Management industry.


AMD shares were trading at $100.91 per share on Tuesday morning, down $0.10 (-0.10%). Year-to-date, AMD has declined -29.87%, versus a -9.15% rise in the benchmark S&P 500 index during the same period.


About the Author: Riddhima Chakraborty

Riddhima is a financial journalist with a passion for analyzing financial instruments. With a master’s degree in economics, she helps investors make informed investment decisions through her insightful commentaries.

More…

The post 3 Popular Nasdaq 100 Stocks to Avoid Right Now appeared first on StockNews.com

https://www.entrepreneur.com/article/433506


The 2 Best Stocks to Buy in August 2022

While a strong job market and a slight year-over-year decline in inflation last month have stroked renewed optimism on Wall Street, the market volatility may not lessen anytime soon on concerns over the possibility of the Fed maintaining its hawkish stance to bring prices down further. Therefore, undervalued and highly profitable stocks Acuity Brands (AYI) and Semtech (SMTC), could be great investments now. Read more….

shutterstock.com – StockNews

The slightly moderated and lower-than-expected inflation in July 2022 and a red-hot job market have renewed investors’ optimism about the stock market, as evident from the recent gains of the benchmark indexes. Moreover, the higher-than-expected U.S. consumer sentiment in August added to the optimism.

However, the series of better-than-expected economic data could make the Fed maintain its hawkish stance as inflation remains elevated. This and the tensions between the U.S. and China over Taiwan might keep up the market volatility in the near term.

Given this backdrop, it could be wise to invest in profitable stocks Acuity Brands, Inc. (AYI) and Semtech Corporation (SMTC) now, which are currently trading at discounts to their peers.

Acuity Brands, Inc. (AYI)

AYI provides lighting and building management solutions internationally that operate through Acuity Brands Lighting and Lighting Controls (ABL); and the Intelligent Spaces Group (ISG) segments. It serves electrical distributors, retail home improvement centers, electric utilities, national accounts, digital retailers, lighting showrooms, energy service companies, and system integrators.

On January 12, 2022, AYI expanded its collaboration with Microsoft Corporation (MSFT) to bring new capabilities to Acuity Brands’ smart lighting, lighting controls, and building automation solutions.

Combining MSFT’s Cloud for Sustainability and Microsoft Azure IoT with AYI’s customer solutions will enable their end customers to operate many facilities and buildings and forecast and calculate the environmental and financial impacts these new capabilities deliver.

For the fiscal 2022 third quarter ended May 31, 2022, AYI’s net sales increased 17.9% year-over-year to $1.06 billion. The company’s gross profit came in at $445.10 million, representing a 15.1% rise from the year-ago period. Its adjusted operating profit came in at $162.80 million for the quarter, up 19% from the prior-year period.

While its adjusted net income increased 20.8% year-over-year to $121.30 million, its adjusted EPS rose 27.1% to $3.52. As of May 31, 2022, the company had $318.20 million in cash and cash equivalents.

Analysts expect the company’s EPS to be $12.61 for fiscal 2022 ending August 30, 2022, representing a 24% rise from the prior-year period. AYI surpassed Street EPS estimates in each of the trailing four quarters, which is impressive.

The consensus revenue estimate of $3.99 billion for the same fiscal year indicates a 15.2% year-over-year improvement. Its EPS is expected to grow at a rate of 12.8% per annum over the next five years.

Its 10.14% trailing-12-month ROA is 97.3% higher than the 5.14% industry average. The company’s trailing-12-month EBITDA margin of 15.12% is 16.9% higher than the industry average of 12.94%.

The stock’s 14.51x non-GAAP forward P/E is 13.3% lower than the 16.74x industry average. In terms of forward EV/EBIT, AYI’s 9.7x, 13.9% lower than the 11.27x industry average. Over the past month, the stock has gained 14% to close the last trading session at $183.24.

AYI’s POWR Ratings reflect this promising outlook. It has an overall A rating, which equates to Strong Buy in our proprietary rating system. The POWR Ratings are calculated by considering 118 distinct factors, with each factor weighted to an optimal degree.

The stock has an A grade for Quality and a B for Growth and Value. Click here to see the additional ratings for AYI’s Momentum, Sentiment, and Stability.

AYI is ranked #2 of 62 stocks in the C-rated Home Improvement & Goods industry.

Semtech Corporation (SMTC)

SMTC designs, develops, manufactures, and markets analog and mixed-signal semiconductor products and advanced algorithms internationally. It serves OEMs and their suppliers in the enterprise computing, communications, and consumer and industrial end-markets.

It sells its products directly, as well as through independent sales representative firms and independent distributors.

On August 2, 2022, SMTC announced a definitive agreement to acquire all outstanding shares of Sierra Wireless, Inc. (SWIR), a leading Internet of Things (IoT) solutions provider, for approximately $1.20 billion.

SMTC’s revenue for its fiscal 2022 second quarter ended June 30, 2022, increased 47.5% year-over-year to $74.69 million. The company’s pre-tax income came in at $41.51 million, up 211.5% from the prior-year period.

Its net earnings came in at $32.13 million, representing a 316.1% rise from the prior-year period. SMTC’s EPS increased 300% year-over-year to $0.44. It had $61.18 million in cash and equivalents as of June 30, 2022.

Analysts expect an EPS estimate of $2.62 for fiscal 2023 ending January 31, 2023, indicating a rise of 36.7% from the prior-year period. The consensus revenue estimate of $834.38 million for the same fiscal year represents a 12.6% year-over-year improvement. Its EPS is expected to grow at a rate of 11.5% per annum over the next five years.

Its 12.56% trailing-12-month ROA is 344.4% higher than the 2.82% industry average. The company’s trailing-12-month EBITDA margin of 25.27% is 94.6% higher than the industry average of 12.99%.

The stock’s 16.05x non-GAAP forward P/E is 17.3% lower than the 19.41x industry average. In terms of forward EV/EBIT, SMTC’s 13.31x is 21.9% lower than the 17.03x industry average. Over the past month, the stock has gained 3.7% to close the last trading session at $54.41.

SMTC’s POWR Ratings reflect its solid prospects. The stock has an overall A rating, equating to Strong Buy in our proprietary rating system.

It has an A grade for Quality and a B for Growth and Value. In addition to the POWR Ratings grades we have just highlighted, one can see SMTC’s Sentiment, Momentum, and Stability ratings here.

SMTC is ranked #3 of 95 stocks in the B-rated Semiconductor & Wireless Chip industry.


AYI shares were unchanged in premarket trading Monday. Year-to-date, AYI has declined -13.26%, versus a -10.07% rise in the benchmark S&P 500 index during the same period.


About the Author: Sweta Vijayan

Sweta is an investment analyst and journalist with a special interest in finding market inefficiencies. She’s passionate about educating investors, so that they may find success in the stock market.

More…

The post The 2 Best Stocks to Buy in August 2022 appeared first on StockNews.com

https://www.entrepreneur.com/article/433414


Bulls in Charge…for Now at Least

Every since the S&P 500 (SPY) made new lows in mid June the bulls have been back in charge. At first it looked like your typical bear market rally. However, there are more and more signals going off that this may be the real deal. As in the new bull market may have arrived. That topic is a big deal as one’s outlook, bullish or bearish, weighs heavily on how they construct their portfolio for the days and weeks ahead. That is why we will focus on that topic in today’s commentary. Read on below for more….

shutterstock.com – StockNews

(Please enjoy this updated version of my weekly commentary from the POWR Value newsletter).

Just like George Washington…I can not tell a lie.

I have been downright bearish since mid May. At first that strategy paid off gangbusters as stocks tumbled to new lows by mid June. And since then being a bear has been…unbearable!

In fact, earlier this week presenting at the MoneyShow I doubled down on my bearish view with this new presentation entitled: Bull or Bear…Which Is It?

My goal was to give a balanced view of the bull case versus the bear case. Indeed there are some reasons to be bullish. Beyond the obvious price action taking place you have signs that…

Inflation could be peaking
No serious dents in employment market
Q2 earnings season better than expected
ISM Services showed a surprising surge last week.

Note I could spend the next hour poking holes in the above bullish arguments. Instead I will just simply say that the for me the preponderance of the evidence still points bearish.

Because yes it could be true that we may have skirted a recession to date, but that doesn’t mean that we will avoid one in the near future with lower prices on the way.

Meaning that inflation may be peaking…but coming down from 8.7% to only 8.5% should not lead anyone to breathe a major sigh of relief.

Especially as that data is as of the end of July. Since then the commodity index has spiked higher as you will see below which means that inflationary pressures are far from gone.

Add on top a non-stop parade of Fed officials singing from the same song sheet that goes like this:

We are going to seriously raise rates…yeah, yeah, yeah

We don’t care how much it makes your teeth grate…yeah, yeah, yeah

We just need to stop prices from so much inflate…yeah, yeah, yeah

(All rights reserved by Reitmeister Economic Sing-A-Long Productions ;-)

As those rates go higher it makes borrowing less attractive. This leads to less investment by companies. Which equates to lower spending.

Typically that cycle extends to lower profits, job loss and wider economic pain. And yes, these would all be tell-tale signs of recession and bear markets.

For now, it is clear the bulls are in charge. The next real test is at the 200 day moving average currently at 4,328 (about 1% above Friday’s close). No doubt there should be serious resistance at that level that will test the conviction of investors.

The more they see the potential negatives blowing away…the more buyers there will be in the stock market (SPY)…the more likely we break above 4,328 and get back to resumption of a new bull market.

However, if that foreshadowing of future recession grows larger, then investors at first will pause this rally higher to await further signals. And the more ominous the signals…the more share prices would recede.

You could almost liken it to a tug of war. Whichever side has stronger evidence will pull investors in their direction.

Again, I see the potential for the next bull market to start now. Just think that the bearish outcome is more likely. Now we just need to objectively review each new round of economic data as it comes out to be on the right side of the tug of war with our investment strategy.

Portfolio Update

We haven’t talked about performance in a while. Gladly today’s surge pushed POWR Value portfolio back into positive territory on the year which is much better than the still 10% loss for the S&P 500 (SPY) in 2022.

Helping matters is the strong earnings season by our portfolio with most seeing estimates and target prices rolling higher after their announcements.

Our strategy for POWR Value at this time remains 50% long. It will be hard for me to agree to a more aggressive posture until we have cleared the hurdle of the 200 day moving average at 4,328.

If that does unfold, then we will get back to adding more stocks scoring highly on POWR Ratings and value metrics.

Closing Comments

The last several weeks has reinforced the lesson of how difficult it is to time the market. That is why so few professionals will not attempt it as it is so easy to get twisted up in knots.

And I sense that the market is not done serving up mixed messages to keep people dazed and confused.

Likely the pathway becomes clearer after the battle over the 200 day moving average. Lets watch that closely and adjust our portfolio depending on what that tells us.

What To Do Next?

If you’d like to see more top value stocks, then you should check out our free special report:

7 SEVERELY Undervalued Stocks

What makes these stocks great additions to any portfolio?

First, because they are all undervalued companies with exciting upside potential.

But even more important, is that they are all Strong Buys according to our coveted POWR Ratings system. Yes, that same system where top-rated stocks have averaged a +31.10% annual return.

Click below now to see these 7 stellar value stocks with the right stuff to outperform in the coming months.

7 SEVERELY Undervalued Stocks

All the Best!

Steve Reitmeister
CEO StockNews.com & Editor of POWR Value trading service


SPY shares closed at $427.10 on Friday, up $7.11 (+1.69%). Year-to-date, SPY has declined -9.41%, versus a % rise in the benchmark S&P 500 index during the same period.


About the Author: Steve Reitmeister

Steve is better known to the StockNews audience as “Reity”. Not only is he the CEO of the firm, but he also shares his 40 years of investment experience in the Reitmeister Total Return portfolio. Learn more about Reity’s background, along with links to his most recent articles and stock picks.

More…

The post Bulls in Charge…for Now at Least appeared first on StockNews.com

https://www.entrepreneur.com/article/433369