Recession or Not Recession…That Is the Question

Every investor appreciates that recessions and bear markets go hand in hand. But the definition of a recession often seems more difficult to pin down. So are we in a recession? And if not, then does that mean that disaster has been averted or that the pain train is still rolling towards investors? This is an important debate because it helps us appreciate what lies ahead for the stock market (SPY). We will tackle this vital topic in this week’s commentary. Read on below.

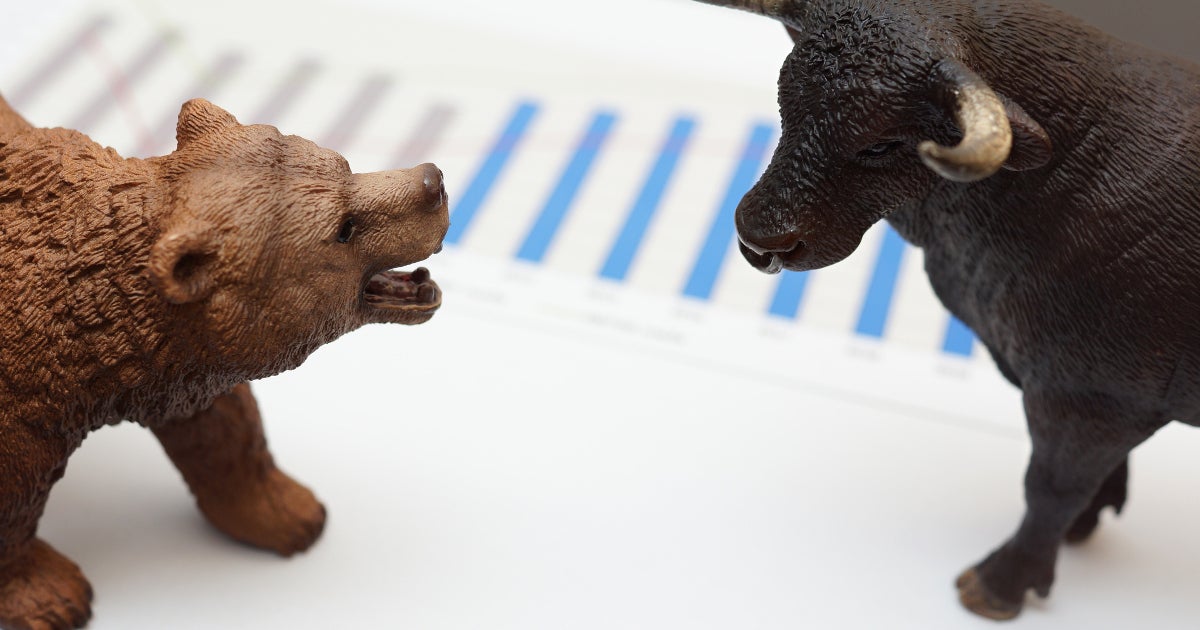
shutterstock.com – StockNews

In previous commentaries I have overly simplified the definition of a recession to the common belief that 2 quarters of GDP contraction spells recession. If it were that easy…then case closed as Q1 and Q2 were both negative.

Yet with most things with investing…it is never really that easy. And not everyone adheres to this definition.

Or perhaps we could use this old economist joke that tries to define recession as well:

What’s the difference between a recession and a depression?

A recession is when your neighbor loses his job…a depression is when you lose your job.

Yes, this joke may explain why most economists are not on the standup comedy circuit ;-)

At the end of the day, the official arbiter of what defines a recession is the National Bureau of Economic Research who normally weighs in months after the fact. Meaning they have not dubbed this a recession yet…and likely won’t when you appreciate the following definition on FAQ section of their site:

“The NBER’s traditional definition of a recession is that it is a significant decline in economic activity that is spread across the economy and that lasts more than a few months. The committee’s view is that while each of the three criteria—depth, diffusion, and duration—needs to be met individually to some degree, extreme conditions revealed by one criterion may partially offset weaker indications from another. For example, in the case of the February 2020 peak in economic activity, we concluded that the drop in activity had been so great and so widely diffused throughout the economy that the downturn should be classified as a recession even if it proved to be quite brief. The committee subsequently determined that the trough occurred two months after the peak, in April 2020.”

For as much as they tried to make that accessible to the layman it still leaves something to be desired. The main thing they need to see is PAIN. And the main measure of pain is job loss which is a main indicator that remains positive as we saw in today’s surprisingly robust Government Employment report.

On the other hand, I stand behind what I said in my Reitmeister Total Return commentary earlier this week in the section below:

Employment is Still Strong: This is everyone’s favorite point to bring up. However, most people are not economists…because if they were they would know that employment is a lagging indicator. Often still looking good as things are going straight down the toilet.

That is where we stand now. But the more inflation stays in place…the more damage is being created…the more likely that job loss is what comes next and that leads to:

Lower income > lower spending > lower corporate profits > lower share prices.

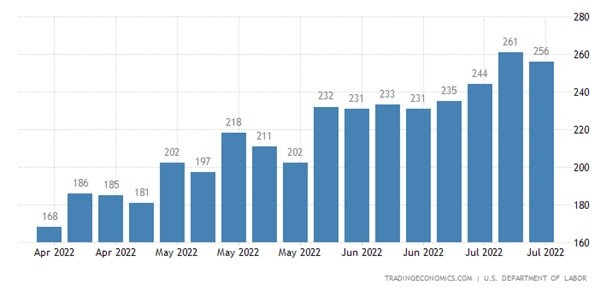
Note that weekly Jobless Claims is the most telling indicator of where monthly job gains and unemployment rate will be in the future and that is getting worse week by week as you will see in the chart below.

So I believe this is the next shoe to drop to put a sword in this faux bull rally leading back to return of the bear.
If job gains were so strong today, then it would seem to negate the recessionary premise. If true…then why did stocks head lower on Friday?

Whereas we may not CURRENTLY be in recession, then unfortunately the Fed will feel all the more emboldened to aggressively raise rates which increases the odds of economic damage down the road.

Meaning the odds of a recession in the future still looms large especially when you appreciate this cornucopia of hawkish comments made by Fed members and assembled by SeekingAlpha.com:

St. Louis’ James Bullard: “I think that inflation has come in hotter than what I would have expected during the second quarter. Now that that has happened, I think we’re going to have to go a little bit higher than what I said before.”

San Francisco’s Mary Daly: “[The Fed is] nowhere near almost done. We have made a good start and I feel really pleased with where we’ve gotten to at this point, [but] people are still struggling with the higher prices. My modal outlook, or the outlook I think is most likely, is really that we raise interest rates and then we hold them there for a while at whatever level we think is appropriate.”

Chicago’s Charles Evans: “If we don’t see improvement before too long, we might have to rethink the path a little bit higher. We want to see if the real side effects are going to start coming back in line… or if we have a lot more ahead of us.”

Cleveland’s Loretta Mester: “We have more work to do because we have not seen that turn in inflation. It’s got to be a sustained, several months of evidence that inflation has first peaked – we haven’t even seen that yet – and that it’s moving down.”

Point being we are not technically in recession. BUT certainly still have a strong chance it could be on the way in the months ahead. Especially true with a Fed dead set on crushing inflation…which yes will likely dampen the economy including job loss.

And yes, dear friend, the Fed’s track record on creating recessions is higher than the odds of creating a soft landing. That is why it is hard to truly get behind the thesis that the new bull market is at hand.

Could there be more upside to recent stock price action?

Yes. That’s because stock prices swing from fear to greed. And at each extreme prices go too far. So very common to overshoot before prices come back to a more rational standpoint.

However, as I look out to the end of the year and into 2023 I still believe we have not seen the lows of this bear market. Just remember that the Covid bear market lasting just a few weeks is the extreme oddity. Much more common to be a 12-18 month endeavor with see-sawing price action before final capitulation bottom is found.

Very little about the June 2022 lows feels like that to me. However, am open to the possibility that this time is different and that a new bull market has begun. Crazier things have happened. But again, the odds are against that outcome with more pain on the way.

What To Do Next?

Right now there are 5 positions in my hand picked portfolio that will not only protect you from the bear market, but also lead to ample gains as stocks head lower.

This strategy perfectly fits the mission of my Reitmeister Total Return service. That being to provide positive returns…even in the face of a roaring bear market.

Yes, it’s easy to make money when the bull market is in full swing. Anyone can do that.

Unfortunately most investors do not know how to generate gains as the market heads lower.

So let me show you the way with 5 trades perfectly suited for today’s bear market conditions.

And then down the road we will take our profits on these positions and start bottom fishing for the best stocks to rally as the bull market makes it rightful return.

Come discover what my 40 years of investing experience can do you for you.

Plus get immediate access to my full portfolio of 5 timely trades that are primed to excel in this difficult market environment.

Click Here to Learn More >

Wishing you a world of investment success!

Steve Reitmeister…but everyone calls me Reity (pronounced “Righty”)
CEO, StockNews.com
Editor, Reitmeister Total Return & POWR Value


SPY shares closed at $413.47 on Friday, down $-0.70 (-0.17%). Year-to-date, SPY has declined -12.30%, versus a % rise in the benchmark S&P 500 index during the same period.


About the Author: Steve Reitmeister

Steve is better known to the StockNews audience as “Reity”. Not only is he the CEO of the firm, but he also shares his 40 years of investment experience in the Reitmeister Total Return portfolio. Learn more about Reity’s background, along with links to his most recent articles and stock picks.

More…

The post Recession or Not Recession…That Is the Question appeared first on StockNews.com

https://www.entrepreneur.com/article/432893



The 4 Best Nasdaq 100 Stocks to Buy

The Nasdaq 100 surged after the Fed announced a 75 basis-point rate hike for the second straight month and hinted at pausing the policy tightening depending on economic data. This, along with better-than-expected corporate earnings, should help the index stay resilient in the near term. Therefore, it could be wise to invest in fundamentally sound Nasdaq 100 stocks Adobe (ADBE), Autodesk (ADSK), Dollar Tree (DLTR), and Gilead Sciences (GILD). Read on….

shutterstock.com – StockNews

The Nasdaq 100 gained more than 4% after the Federal Reserve announced a 75 basis-point interest rate hike in response to the multi-decade high inflation for the second straight month. This marked Nasdaq’s biggest rally since November 2020.

The stock market rallied yesterday despite the U.S. GDP contracting 0.9% for the second straight quarter. Better-than-expected corporate earnings could help Nasdaq 100 stay resilient near term.

So, we think it could be wise to invest in fundamentally sound Nasdaq 100 stocks Adobe Inc. (ADBE), Autodesk, Inc. (ADSK), Dollar Tree, Inc. (DLTR), and Gilead Sciences, Inc. (GILD).

Adobe Inc. (ADBE)

ADBE functions as a diversified software company internationally. It operates through three segments: Digital Media, Digital Experience, and Publishing and Advertising.

Last month, ADBE announced innovations for its customer data platform (CDP), Adobe Real-Time CDP, to help brands transition from third-party cookies to first-party data. As businesses across all industries adopt Adobe Real-Time CDP, ADBE introduces enriched customer profiles with commerce, AI-powered targeting, new privacy and security tools, and Segment Match across channels.

Also, last month ADBE expanded its partnership with The Home Depot to improve the customer experience. As part of the company’s interconnected retail strategy, a smooth experience extends across e-commerce, an award-winning mobile app, and in-store services such as pickup lockers and an in-app product locator. With so many touchpoints, the ADBE partnership will provide comprehensive insights into the customer journey.

ADBE’s total revenue increased 14.4% year-over-year to $4.39 billion for the second quarter ended June 3, 2022. Its non-GAAP operating income grew 12% from its year-ago value to $1.97 billion, while its non-GAAP net income amounted to $1.59 billion, up 8.9% from the prior-year quarter. The company’s non-GAAP EPS rose 10.6% year-over-year to $3.35.

Analysts expect ADBE’s revenue to increase 12.9% year-over-year to $4.44 billion for the third quarter ending August 2022. The consensus EPS estimate of $3.35 represents a 7.7% improvement year-over-year for the third quarter ending August 2022. The stock has gained 10.2% over the past month.

ADBE’s POWR Ratings reflect this promising outlook. The company has an overall rating of B, which translates to Buy in our proprietary rating system. The POWR Ratings assess stocks by 118 different factors, each with its own weighting.

The stock also has an A grade for Quality and a B for Sentiment. Within the F-rated Software – Application industry, ADBE is ranked #31 of 154 stocks

Click here to see additional POWR Ratings for Growth, Value, Stability, and Momentum for ADBE.

Autodesk, Inc. (ADSK)

ADSK provides 3D design, engineering, and entertainment software and services worldwide. The company offers AutoCAD Civil 3D, surveying, design, analysis, and documentation solutions for civil engineering, including land development, transportation, and environmental projects.

In April, ADSK announced that it is adopting Autodesk Construction Cloud and establishing a powerful construction management platform into its standard operating procedures (SOP). Teams across Evans will use Autodesk Construction Cloud to quickly onboard new employees, maximize coordination across project stakeholders, and minimize project errors.

In March, ADSK signed a conclusive agreement to acquire The Wild, a cloud-connected, extended reality (XR) platform, which includes its namesake solutions, The Wild, and IrisVR. This acquisition enables Autodesk to meet increasing needs for augmented reality (AR) and virtual reality (VR) technology advancements within the AEC industry and further support AEC customers throughout the project delivery lifecycle.

During the first quarter ending April 30, 2022, ADSK’s total net revenue increased 18.3% year-over-year to $1.17 billion. Its income from operations grew 59.7% year-over-year to $214.00 million, while its net income came in at $146.00 million. The company’s EPS stood at $0.67 for the quarter.

ADSK’s strong fundamentals are reflected in its POWR Ratings. The stock has an overall B rating, which equates to Buy in our POWR Ratings system. The stock also has an A grade for Quality and a B for Growth. Within the Software – Application industry, it is ranked #28.

In total, we rate ADSK on eight different levels. Beyond what we’ve stated above, we have also given ADSK grades for Stability, Value, Sentiment, and Momentum. Get all the ADSK ratings here.

Dollar Tree, Inc. (DLTR)

DLTR operates a discount variety of retail stores. It has two operational segments, Dollar Tree and Family Dollar. Dollar Tree segment provides consumable merchandise, including candy and food, health and personal care, as well as everyday consumables. The Family Dollar segment operates general merchandise retail discount stores that offer consumable merchandise.

In the first quarter ending April 30, 2022, DLTR’s total revenue increased 6.5% year-over-year to $6.90 billion. Its operating income grew 40.7% from its year-ago value to $731.50 million, while its net income amounted to $536.40 million, up 43.2% from its year-ago value. The company’s EPS improved 48.2% year-over-year to $2.37.

The $1.59 consensus EPS estimate for the second quarter ending July 2022 represents a 29.7% improvement year-over-year. Analysts expect DLTR’s revenue to increase 7% year-over-year to $6.78 billion for the second quarter ending July 2022. The stock has gained 16.2% year-to-date.

It is no surprise that DLTR has an overall B rating, equating to Buy in our POWR Ratings system. DLTR has a B grade for Growth and Sentiment. In the A-rated Grocery/Big Box Retailers industry, it is ranked #26 of 38 stocks.

Click here to see the additional POWR Ratings for DLTR (Stability, Momentum, Value, and Quality).

Gilead Sciences, Inc. (GILD)

GILD, a biopharmaceutical company discovers, develops, and commercializes medicines in the areas of unmet medical need in the United States, Europe, and internationally. The company provides Biktarvy, Genvoya, Descovy, Odefsey, Truvada, Complera/ Eviplera, Stribild, and Atripla products.

This month, GILD, and the European Commission signed a new joint procurement agreement (JPA) that will ensure continued rapid and equitable access to Veklury for participating Member States across the European Union (EU) and European Economic Area (EEA). The agreement covers the acquisition of Veklury over the next twelve months and has the option to be extended for an additional six months.

For the first quarter ending March 31, 2022, GILD’s total revenue increased 2.6% year-over-year to $6.59 billion. Its income from operations amounted to $197.00 million, while its net income came in at $12.00 million. The company’s EPS stood at $0.02 for the quarter.

The consensus EPS estimate of $1.41 for the fourth quarter ended December 2022 represents a 104.9% year-over-year growth.

GILD’s strong fundamentals are reflected in its POWR Ratings. The stock has an overall A rating, which equates to Strong Buy in our POWR Ratings system. The stock also has an A grade for Value and a B for Sentiment and Quality. Within the F-rated Biotech industry, it is ranked #7 of 400 stocks.

In total, we rate GILD on eight different levels. Beyond what we’ve stated above, we have also given GILD grades for Stability, Growth, and Momentum. Get all the GILD ratings here.


ADBE shares were trading at $409.06 per share on Friday afternoon, up $5.56 (+1.38%). Year-to-date, ADBE has declined -27.86%, versus a -12.68% rise in the benchmark S&P 500 index during the same period.


About the Author: Spandan Khandelwal

Spandan’s is a financial journalist and investment analyst focused on the stock market. With her ability to interpret financial data, she aims to help investors evaluate the fundamentals of a company before investing.

More…

The post The 4 Best Nasdaq 100 Stocks to Buy appeared first on StockNews.com

https://www.entrepreneur.com/article/432411


Gap CEO Steps Down. Should We Take Advantage of the Stock’s Downward Move?

Apparel retailer Gap’s (GPS) CEO recently stepped down, which seems to have weighed down its stock price. With the stock in a downward trend, will it be wise to invest in it now? Read on to find out….

shutterstock.com – StockNews

Apparel retail company The Gap, Inc. (GPS) offers apparel, accessories, and personal care products under the Old Navy, Gap, Banana Republic, and Athleta brands.

On July 11, GPS announced that Chief Executive Officer Sonia Syngal would step down from her position on the company’s board. Bob Martin, the company’s current executive chairman of the Board, was appointed interim and chief executive officer effective immediately. GPS also announced that Horacio “Haio” Barbeito would join as president and chief executive officer of Old Navy.

Since then, the stock has declined 2.2% to close its last trading session at $8.71. GPS has declined 71% over the past year and 50.7% year-to-date. Moreover, it is currently trading lower than its 50-day and 200-day Moving Averages of $9.71 and $15.39, signaling a downtrend.

Here are the factors that could affect GPS’ performance in the near term:

Bleak Bottom Line

For the fiscal first quarter ended April 30, GPS’ net sales decreased 12.9% year-over-year to $3.48 billion. Net income declined 197.6% from the prior-year quarter to a negative $162 million. EPS came in at a negative $0.44, down 202.3% from the same period the prior year.

Analysts Expect Downsides

The consensus EPS estimate of a negative $0.03 for the quarter ending July 2022 indicates a 104.3% year-over-year decrease. Street EPS estimate for the current year (fiscal 2023) of $0.05 reflects a decline of 96.5% from the prior year. Likewise, Street revenue estimate for the same year of $15.71 billion indicates a 5.8% year-over-year decrease.

Lean Profit Margins

GPS’ trailing-12-month EBIT margin and EBITDA margin of 1.99% and 5.17% are 77.7% and 56.7% lower than their respective industry averages of 8.92% and 11.94%. Its trailing-12-month ROTC of 2.09% is 70.8% lower than the industry average of 7.16%.

The stock’s trailing-12-month ROE and ROA of a negative 2.74% and 0.59% are significantly lower than their respective industry averages of 16.73% and 5.55%.

POWR Ratings Reflect Bleak Prospects

GPS’ POWR Ratings reflect this bleak outlook. The stock has an overall rating of D, equating to Sell in our proprietary rating system. The POWR Ratings are calculated by considering 118 different factors, with each factor weighted to an optimal degree.

GPS has a Growth and Sentiment grade of F in sync with its bleak bottom line growth in the last reported quarter and bleak analysts’ growth expectations.

The stock also has a Stability grade of D, consistent with its five-year monthly beta of 1.73.

In the 68-stock Fashion & Luxury industry, it is ranked #65.

Click here to see the additional POWR Ratings for GPS (Value, Momentum, and Quality).

View all the top stocks in the Fashion & Luxury industry here.

Bottom Line

The company’s CEO stepping down seems to have weighed in on its stock. On top of it, GPS is struggling with bottom-line losses, and its low profitability is concerning. Moreover, with analysts expecting GPS’ EPS for the current year to decline, I think the stock might be best avoided now.

How Does The Gap, Inc. (GPS) Stack Up Against its Peers?

While GPS has an overall POWR Rating of D, one might consider looking at its industry peers, J.Jill, Inc. (JILL) and Hugo Boss AG (BOSSY), which have an overall A (Strong Buy) rating, and Chico’s FAS, Inc. (CHS) and Weyco Group, Inc. (WEYS), which have an overall B (Buy) rating.


GPS shares were trading at $8.75 per share on Wednesday afternoon, up $0.04 (+0.46%). Year-to-date, GPS has declined -48.66%, versus a -15.99% rise in the benchmark S&P 500 index during the same period.


About the Author: Anushka Dutta

Anushka is an analyst whose interest in understanding the impact of broader economic changes on financial markets motivated her to pursue a career in investment research.

More…

The post Gap CEO Steps Down. Should We Take Advantage of the Stock’s Downward Move? appeared first on StockNews.com

https://www.entrepreneur.com/article/432251


This Sector Will Lead the Next Bull Market…

Every bear market is followed by a bull market…just like how spring inevitably arrives after every winter. Sure, it’s easy to lose sight of this fact in the middle of a brutal bear market, but investors need to realize that amazing opportunities are just around the corner. And, NOW is the time to start preparing. I expand on these thoughts below and reveal the sector that I believe will deilver the highest profits to investors when the bull begins to run again. Read on below for details.

shutterstock.com – StockNews

One of the most reliable ways to find the best opportunities for the next bull market run, is by focusing on the sectors that have the best combination of growth, value, and catalysts. Utilizing this strategy in the previous decade would have led investors to focus on SaaS or Internet stocks.

Many of the top names in these sectors gained more than 1,000% during the previous bull market. Of course, investors will need to find new stocks in new areas to achieve such returns during the next bull market.

Today, I want to talk about the biotech sector, and discuss 3 reasons why every investor needs to pay attention.

#1: Valuation

While so many parts of the market became egregiously overvalued, biotechs are an exception as the entire sector was flat between 2015 and 2022.

BUT, only the stocks were flat. Earnings actually EXPLODED.

The best way to see this is the weighted average P/E for the biotech ETF, IBB which went from 83 in 2015 to 12.5 now.

From a more qualitative perspective, we can see that the IPO market has dried up along with inflows from retail investors and institutions. In fact, nearly 25% of small and mid-cap biotechs have more cash on hand than their actual market caps.

#2: Growth

Usually, investors can only find attractive valuations in boring industries with limited growth prospects.

Biotechs are a rare and notable exception.

Populations in the developing world are aging at a rapid pace. There is the famous stat that Japan sells more adult diapers than baby diapers. Well, this is going to be the reality for the US and Europe in a few decades as well.

An aging population also means that demand for new drugs will also be increasing. There are always new innovations in the space that are leading to better outcomes in terms of diagnosis and treatment.

Healthcare spending also continues to grow at a faster rate than the overall economy.

This is another trend that won’t abate anytime soon given that a large share of this is subsidized by the government. And, there is no political appetite on either side of the aisle to change this arrangement.

#3: Catalysts

An appealing growth and value backdrop will pique any investors’ interest. But learning about the powerful catalysts in play will turn this interest into an obsession.

The most potent is that we are now in an environment of slowing growth. At the start of the year, inflation was the biggest threat to the economic outlook.

This has now been replaced by a recession. The best evidence of this is longer-term rates turning lower along with forward-looking inflation indicators.

This is a brutal environment for most stocks but manna for biotechs. These companies’ bottom and top lines are disconnected from economic or monetary conditions. As the economic outlook erodes, money will flow from cyclicals into sectors that are more insulated from the business cycle.

Another catalyst for the sector are the barren pipelines and flush balance sheets of major pharmaceutical companies.

This puts a bid under the biotech sector as these companies are dependent on the biotech sector for the innovation that will deliver the next generation of blockbuster drugs.

Finally, the most exciting catalyst is this exact innovation. Over the past decade, the cost of drug-development has declined due to computer modeling and better understanding of diseases and the human body. This is leading to better margins and outcomes.

These technologies are also serving as a bridge to a future of personalized medicine. The first step is in improving diagnosis in terms of accuracy and speed. This is where we are today.

The most exciting part of the biotech space is in the micro-cap and small-cap areas as these are the companies with the most potential. As noted above, many are trading at valuations that are below the cash on their books.

Most investors simply don’t have the time or inclination to dedicate serious amounts of time and energy to learn about the nuances of various biotech companies.

That’s why we do the heavy lifting (and thinking) to identify the highest-quality companies in the biotech space.

What To Do Next?

Our POWR Stocks Under $10 service is dedicated to this “niche’ that is being ignored by Wall Street and the majority of investors. It is specifically designed to consistently find these types of companies and other winning low-priced stocks.

This unique portfolio service harnesses the quantitative power of our “Top 10 Stocks Under $10” strategy which has generated a +59.43% average annual return since 1999—and is significantly outperforming the S&P 500 this year while most investors are mired in losses.

Beyond great picks I also explain the all important “WHY” behind each move we make. Why to buy now…and when to sell for maximum gains.

You can experience these market shattering returns for yourself, by taking a risk-free 30 day trial for just $1.

And now is the perfect time to do so because of the current market environment. Plus I am putting out 2 exciting new trades this Monday morning 7/25.

To get these timely trades, plus full access to the rest of the stocks in the POWR Stocks Under $10 portfolio…and all the winning trades to come in the future, then simply click the link below:

About Stocks Under $10 with 30 Day Trial >>

All the Best!

Jaimini Desai
Chief Growth Strategist, StockNews
Editor, POWR Stocks Under $10 Newsletter


SPY shares closed at $395.09 on Friday, down $-3.70 (-0.93%). Year-to-date, SPY has declined -16.20%, versus a % rise in the benchmark S&P 500 index during the same period.


About the Author: Jaimini Desai

Jaimini Desai has been a financial writer and reporter for nearly a decade. His goal is to help readers identify risks and opportunities in the markets. He is the Chief Growth Strategist for StockNews.com and the editor of the POWR Growth and POWR Stocks Under $10 newsletters. Learn more about Jaimini’s background, along with links to his most recent articles.

More…

The post This Sector Will Lead the Next Bull Market… appeared first on StockNews.com

https://www.entrepreneur.com/article/432017


How Long Can This Bear Market Rally Last?

The S&P 500 (SPY) has managed to pull off a fantastic bear market rally and now, we are off the mid-June lows by nearly 10%. In last week’s commentary, we noted the bullish reactions to negative news like the CPI report which did get our spidey senses tingling. We also had a low-risk setup vs the June lows. Overall, our decision to increase exposure over the past couple of weeks was validated and rewarded by the market. Of course, there is a caveat. Next week, we have an FOMC meeting and earnings reports for the mega-cap, tech stocks which means that the fireworks are just getting started. In today’s commentary, I want to provide a brief market update, before we explore this bear market in terms of possibilities in more detail. Read on below to find out more….

shutterstock.com – StockNews

(Please enjoy this updated version of my weekly commentary published July 22nd, 2022 from the POWR Stocks Under $10 newsletter).

Over the last week, the S&P 500 (SPY) is up by 5.5% with even bigger advances for the Nasdaq and the Russell 2000. Gains were pretty strong across the board as well.

This is another change in character for the market as previous advances in 2022 have featured weak participation.

Some reasons for the market rallying are Q2 earnings that are pretty resilient, while inflation continues to move lower. And, this comes about in an environment that featured record levels of bearish sentiment by many measures.

Bear Market Rally Thoughts

[I shared these thoughts about a bear market rally in my Monday commentary for POWR Growth subscribers. This is an excerpt with some modifications for stocks under $10. ]

Today, I want to put on my bull hat and argue the other side. First, I don’t think another bull market, beginning from here, is possible.

Instead, I do think a bear market rally could happen and is something that we should consider a possibility. Although, it does require a series of positive catalysts.

First of all, sentiment is extremely bearish. This means that any positive news could spark a big rally. As noted, inflation falling is a bullish force that has been providing support to long-duration assets. China is easing. Earnings haven’t been as bad as expected.

If we look back at previous bear market episodes, we find powerful bear market rallies between 15 and 25% that lead to sentiment becoming bullish or at least neutral. We haven’t had one yet, which means that we are due.

Now, let’s throw some harsh reality on that pretty picture…

A lot of ifs are necessary for a big bear market rally to come to fruition. And, each of the bullish catalysts could fizzle as they have for much of this year. Let’s go through it:

Bearish sentiment in a bear market is a useless indicator. Inflation has failed to decline despite many forecasts of it declining. Anyways, it’s not falling because we added new capacity to the economy, it’s going down due to an impending recession.

Chinese stimulus hasn’t flowed into the economy because of Zero-COVID policies. And, earnings season is only beginning, and analysts continue to forecast positive EPS growth in Q3 and Q4.

Targets + Applications for Our Portfolio

In terms of how far we could go, I believe a reasonable target would be around 4,200 on the S&P 500 (SPY) which is about the midpoint of the decline.

More important is what I’m looking for qualitatively. I’m looking for sentiment to get very bullish, especially on a short-term basis. I’m looking for more and more people to declare that a bottom was in.

This would be a perfect time to get to a more neutral allocation given the backdrop and likelihood of a deeper, earnings contraction.

Final Thoughts

To sum up my thinking: We are in a bear market. The economy is slowing which means more pain is coming. However, I believe that the “window is open’ for a bear market rally.

In terms of the portfolio, we have marginally increased exposure but are ready to get back to a more neutral position if we break below the mid-June lows.

What To Do Next?

If you’d like to see more top stocks under $10, then you should check out our free special report:

3 Stocks to DOUBLE This Year

What gives these stocks the right stuff to become big winners, even in the brutal 2022 stock market?

First, because they are all low priced companies with the most upside potential in today’s volatile markets.

But even more important, is that they are all top Buy rated stocks according to our coveted POWR Ratings system and they excel in key areas of growth, sentiment and momentum.

Click below now to see these 3 exciting stocks which could double (or more!) in the year ahead.

3 Stocks to DOUBLE This Year

All the Best!

Jaimini Desai
Chief Growth Strategist, StockNews
Editor, POWR Stocks Under $10 Newsletter


SPY shares fell $398.79 (-100.00%) in premarket trading Friday. Year-to-date, SPY has declined -15.41%, versus a % rise in the benchmark S&P 500 index during the same period.


About the Author: Jaimini Desai

Jaimini Desai has been a financial writer and reporter for nearly a decade. His goal is to help readers identify risks and opportunities in the markets. He is the Chief Growth Strategist for StockNews.com and the editor of the POWR Growth and POWR Stocks Under $10 newsletters. Learn more about Jaimini’s background, along with links to his most recent articles.

More…

The post How Long Can This Bear Market Rally Last? appeared first on StockNews.com

https://www.entrepreneur.com/article/431965


Is Wells Fargo Stock a Buy, Sell or Hold After Its Earnings Miss?

Despite missing second-quarter earnings estimates, Wells Fargo’s (WFC) shares surged 6.2% in early trading last week. So, let’s evaluate if it is worth buying the stock now. Read on.

shutterstock.com – StockNews

Wells Fargo & Corporation (WFC) is a leading financial services company with about $1.9 trillion in assets, serving one in every three U.S. families and more than 10% of small companies in the United States, and is a leading middle market banking provider in the United States. The company’s shares have gained 11% over the past month.

However, WFC’s earnings and revenue fell far short of Wall Street expectations. WFC reported earnings per share of 74 cents, a 46% decline year over year. Its revenue came in at $17.03 billion, down from $20.27 billion in 2021. Analysts expected WFC to earn 83 cents per share on $17.5 billion in sales.

CEO Charlie Scharf said, “While our net income declined in the second quarter, our underlying results reflected our improving earnings capacity with expenses declining and rising interest rates driving strong net interest income growth.” He further added high-interest rates and weaker financial markets caused VC, mortgage banking, and investment banking revenue to decline.

Also, the stock is down 9.8% year-to-date and 19.4% over the past six months to close its last trading session at $43.28.

Here’s what could shape WFC’s performance in the near term:

Mixed Financials

WFC’s net interest income increased 15.9% year-over-year to $10.19 billion for the first quarter ended June 30, 2022. However, its total revenue decreased 15.9% from the year-ago value to $17.03 billion. The company’s net income declined 48.4% from the prior-year quarter to $3.11 billion, while its EPS decreased 46.4% year-over-year to $0.74.

Negative Profit Margins

WFC’s trailing-12-month net income margin of 23% is 20.3% lower than the industry average of 28.9%. Also, its trailing-12-month ROA and ROE are negative 0.94% and 10%, respectively.

Mixed Valuation

In terms of forward non-GAAP P/E, the stock is currently trading at 10.73x, 7.4% higher than the industry average of 9.99x. However, its forward Price/Sales of 2.22x is 22.2% lower than the industry average of 2.85x. Also, WFC’s forward Price/Book of 0.98x is 12.9% lower than the industry average of 1.13x.

Consensus Rating and Price Target Indicate Potential Upside

Each of the 13 Wall Street analysts that rated WFC, ten rated it Buy, and three rated it Hold. The 12-month median price target of $52.38 indicates a 21.03% potential upside. The price targets range from a low of $45.00 to a high of $62.00.

POWR Ratings Reflect Stable Prospects

WFC has an overall C rating, which equates to a Neutral in our proprietary POWR Ratings system. The POWR ratings are calculated considering 118 different factors, with each factor weighted to an optimal degree.

Our proprietary rating system also evaluates each stock based on eight different categories. WFC has a C grade for Quality and Value. The company’s mixed profitability is consistent with the Quality grade. In addition, its mixed valuations are in sync with the Value grade.

In the 11-stock, F-rated Money Center Banks industry, WFC is ranked #8.

Beyond what I’ve stated above, you can view WFC ratings for Growth, Stability, Sentiment, and Momentum here.

Bottom Line

As the U.S. economy recovers, the company expects significant improvement in all its business segments. However, WFC’s weak financial results in the last quarter and negative profit margins have raised investors’ concerns over its prospects.

Furthermore, analysts expect its revenue and EPS to decline 6.7% and 16.8% year-over-year to $73.21 billion and $4.01 in the current year. So, we think investors should wait before scooping up its shares.


WFC shares fell $0.15 (-0.35%) in premarket trading Friday. Year-to-date, WFC has declined -8.90%, versus a -15.41% rise in the benchmark S&P 500 index during the same period.


About the Author: Pragya Pandey

Pragya is an equity research analyst and financial journalist with a passion for investing. In college she majored in finance and is currently pursuing the CFA program and is a Level II candidate.

More…

The post Is Wells Fargo Stock a Buy, Sell or Hold After Its Earnings Miss? appeared first on StockNews.com

https://www.entrepreneur.com/article/431964


Is This High-Volume Stock Worth Buying or Selling?

Shares of green hydrogen producer Plug Power (PLUG) has gained 10.5% over the past months and is currently among the most active equities on Wall Street. However, given the company failed to meet analyst estimates in the last reported quarter, can it continue to maintain its current trajectory? Let’s find out.

shutterstock.com – StockNews

Plug Power, Inc. (PLUG) provides end-to-end clean hydrogen and zero-emissions fuel cell solutions in North America and globally for supply chain and logistics applications, on-road electric vehicles, the stationary power sector, and others. It works to create an end-to-end green hydrogen ecosystem, which includes green hydrogen production, storage, distribution, and energy generation via mobile or stationary applications.

The stock has traded at an average volume of 21,726,229 over the past three months. However, its shares are down 34.7% over the past year and 45.6% over the past nine months to close its last trading session at $18.32.

While the company’s fourth-quarter 2021 earnings release piqued investors’ interest in early March, its first earnings report in 2022 could not produce the same results. It reported $140.8 million in sales and a loss per share of $0.27, falling short of analysts’ projections of $144.5 million in sales and a loss per share of $0.16.

However, the company’s exorbitant cash burn was perhaps of more concern. PLUG reported a negative $209 million in operational cash flow in the first quarter, much higher than the negative $117 million in the prior year.

Here’s what could shape PLUG’s performance in the near term:

Inadequate Financials

PLUG’s revenue increased 95.7% year-over-year to $140.80 million for the first quarter ended March 31, 2022. However, its operating loss grew 188.3% from the year-ago value to $139.16 million. The company’s net loss surged 157.6% from the prior-year quarter to $156.49 million.

Negative Profit Margins

PLUG’s trailing-12-month asset turnover ratio of 0.1% is 87.5% lower than the industry average of 0.79%. Also, its trailing-12-month ROA, ROC, and net income margin are negative 9.6%, 5.8%, and 97.3%, respectively. Moreover, its trailing-12-month negative gross profit margin of 21.4% compares to its industry average of 29.6%.

Premium Valuation

In terms of its forward EV/Sales, PLUG is currently trading at 8.56x, which is 434.8% higher than the industry average of 1.60x. Moreover, PLUG’s forward Price/Sales of 11.43x is 805.7% higher than the industry average of 1.26x.

POWR Ratings Reflect Bleak Outlook

PLUG has an overall F rating, which equates to a Strong Sell in our proprietary POWR Ratings system. The POWR ratings are calculated considering 118 different factors, with each factor weighted to an optimal degree.

Our proprietary rating system also evaluates each stock based on eight different categories. PLUG has an F for Stability and Quality. The stock beta of 1.74 is consistent with the Stability grade. In addition, the company’s poor profitability is in sync with the Quality grade.

Of the 91 stocks in the B-rated Industrial – Equipment industry, PLUG is ranked #90.

Beyond what I’ve stated above, you can view PLUG ratings for Value, Growth, Momentum, and Sentiment here.

Bottom Line

The company’s widening losses and failure to meet analysts’ projects have raised investors’ concerns. Analysts expect its EPS to decline by 11.1% and remain negative in the current quarter ending June 2022. In addition, the stock is expected to decline at the rate of 40% per annum over the past five years. So, we think the stock is best avoided now.

How Does Plug Power, Inc. (PLUG) Stack Up Against its Peers?

While PLUG has an overall F rating, one might want to consider its industry peers, Preformed Line Products Company (PLPC), Standex International Corporation (SXI), and Belden Inc. (BDC), which have an overall A (Strong Buy) rating.


PLUG shares fell $0.10 (-0.55%) in premarket trading Friday. Year-to-date, PLUG has declined -35.10%, versus a -15.41% rise in the benchmark S&P 500 index during the same period.


About the Author: Pragya Pandey

Pragya is an equity research analyst and financial journalist with a passion for investing. In college she majored in finance and is currently pursuing the CFA program and is a Level II candidate.

More…

The post Is This High-Volume Stock Worth Buying or Selling? appeared first on StockNews.com

https://www.entrepreneur.com/article/431963


Is This Industrial Stock Still a Buy Amid Recent Selling Pressure?

Industrial stock Fastenal (FAST) has witnessed significant selling pressure lately despite reporting a year-over-year increase in its revenue and earnings for the last quarter. Although the company managed to offset the rising costs by undertaking price increases, will it be able to manage the inflationary pressures in the upcoming months? Read on to learn more.

shutterstock.com – StockNews

Fastenal Company (FAST) is engaged in the wholesale distribution of industrial and construction supplies. The company offers fasteners, including threaded fasteners, bolts, nuts, screws, studs, and others.

It also offers miscellaneous supplies and hardware, including pins, machinery keys, concrete anchors, metal framing systems, wire ropes, strut products, and other accessories. It serves the original equipment manufacturers; the maintenance, repair, operations, and non-residential construction market.

Given the strong demand for manufacturing and construction equipment and supplies, FAST’s revenue and earnings grew year-over-year in the second quarter ended June 30, 2022. The company had to undertake price increases in order to offset the rising costs. The price increases for fasteners and transportation services helped drive a 6.6% to 6.9% growth in sales, respectively.

The company said it had not undertaken broad price increases in the second quarter but benefitted from the price increases during the first quarter. FAST’s CEO Dan Florness said, “Demand remained generally healthy, but there were certain signs of softening that emerged in May and June.”

FAST is facing product and transportation cost inflation, but the company said it would take action to mitigate the effects of the rising costs.

However, the stock has declined 23.8% in price year-to-date and 10.1% over the past year to close the last trading session at $48.76. It is currently trading 24.7% below its 52-week high of $64.75, which it hit on December 30, 2021.

Here’s what could influence FAST’s performance in the upcoming months:

Robust Financials

FAST net sales increased 18% year-over-year to $1.77 billion for the second quarter ended June 30, 2022. The company’s gross profit increased 18.1% year-over-year to $827.60 million. Also, its net earnings increased 19.8% year-over-year to $287.10 million. In addition, its EPS came in at $0.50, representing an increase of 19.7% year-over-year.

Favorable Analyst Estimates

Analysts expect FAST’s EPS for fiscal 2022 and 2023 to increase 16.5% and 4.1% year-over-year to $1.86 and $1.94, respectively. Its revenue for fiscal 2022 and 2023 is expected to increase 14.8% and 4.8% year-over-year to $6.91 billion and $7.24 billion, respectively. It surpassed consensus EPS estimates in each of the trailing four quarters.

Higher-than-industry Profitability

In terms of trailing-12-month gross profit margin, FAST’s 46.49% is 57.1% higher than the 29.59% industry average. Likewise, its 1.50% trailing-12-month asset turnover ratio is 89.7% higher than the industry average of 0.79%. Furthermore, the stock’s trailing-12-month levered FCF margin and EBITDA margin came in at 5.72% and 23.37%, compared to the industry averages of 3.18% and 13.04%, respectively.

Stretched Valuation

In terms of forward EV/S, FAST’s 4.13x is 157.5% higher than the 1.60x industry average. Likewise, its 17.81x forward EV/EBITDA is 75.9% higher than the 10.13x industry average. And the stock’s 8.41x forward P/B is 240% higher than the 2.47x industry average.

POWR Ratings Reflect Uncertainty

FAST has an overall rating of C, equating to a Neutral in our POWR Ratings system. The POWR Ratings are calculated by taking into account 118 different factors, with each factor weighted to an optimal degree.

Our proprietary rating system also evaluates each stock based on eight different categories. FAST has a D grade for Value, consistent with its stretched valuation.

It has a B grade for Quality, in sync with its 15.70% trailing-12-month net income margin, 134.7% higher than the 6.69% industry average.

FAST is ranked #46 out of 91 stocks in the B-rated Industrial – Equipment industry. Click here to access FAST’s Growth, Momentum, Stability, and Sentiment ratings.

Bottom Line

FAST had managed to offset the rising costs by undertaking price increases during the first quarter. With inflation at a 41-year high, demand is expected to take a hit, and costs are expected to surge further.

The stock is trading below its 50-day and 200-day moving average of $50.96 and $55.81, respectively, indicating a downtrend. Also, the stock is trading at a stretched valuation. So, it could be wise to wait for a better entry point in the stock.

How Does Fastenal Company (FAST) Stack Up Against its Peers?

While FAST has an overall POWR Rating of C, you might want to consider investing in the following Industrial – Equipment stocks with an A (Strong Buy) or B (Buy) rating: Preformed Line Products Company (PLPC), Standex International Corporation (SXI), and Applied Industrial Technologies, Inc. (AIT).


FAST shares were unchanged in premarket trading Friday. Year-to-date, FAST has declined -23.05%, versus a -15.41% rise in the benchmark S&P 500 index during the same period.


About the Author: Dipanjan Banchur

Since he was in grade school, Dipanjan was interested in the stock market. This led to him obtaining a master’s degree in Finance and Accounting. Currently, as an investment analyst and financial journalist, Dipanjan has a strong interest in reading and analyzing emerging trends in financial markets.

More…

The post Is This Industrial Stock Still a Buy Amid Recent Selling Pressure? appeared first on StockNews.com

https://www.entrepreneur.com/article/431944


3 Reasons Why Big Oil Is A Buy After A Punishing Pullback

Previously a sell, the recent big drop in crude has made Big Oil a buy. How to position to profit from continued consolidation in XOM stock.

shutterstock.com – StockNews

A little over a month ago, I wrote about why I thought oil and oil stocks were a short in “5 Reasons Why It’s Finally The Time To Sell Big Oil“. The fundamentals, technicals, and implied volatility were all getting to extremes. Probabilities favored a pullback.

Now that oil and oils stocks have fallen over 15% in the past 30 days, my opinion has changed as well. Price does matter. My prior bearish outlook has turned to a more neutral to slightly bullish viewpoint. Let’s look at three reasons why the worst may be over for the recent carnage in crude. Once again, I will be using ExxonMobil (XOM) as the poster child for Big Oil.

Fundamentals

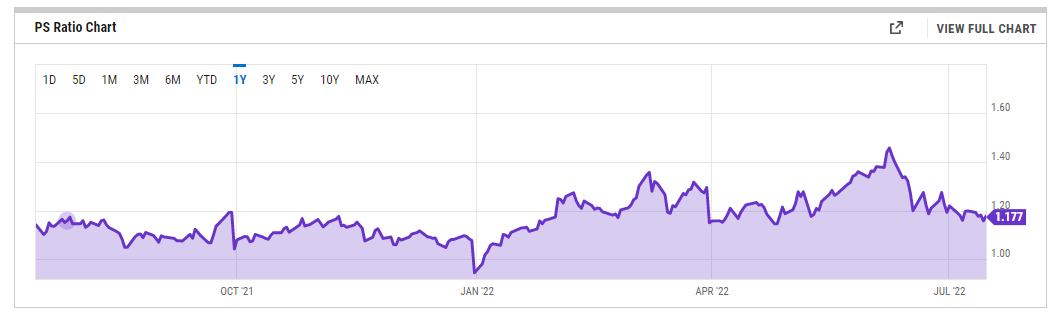
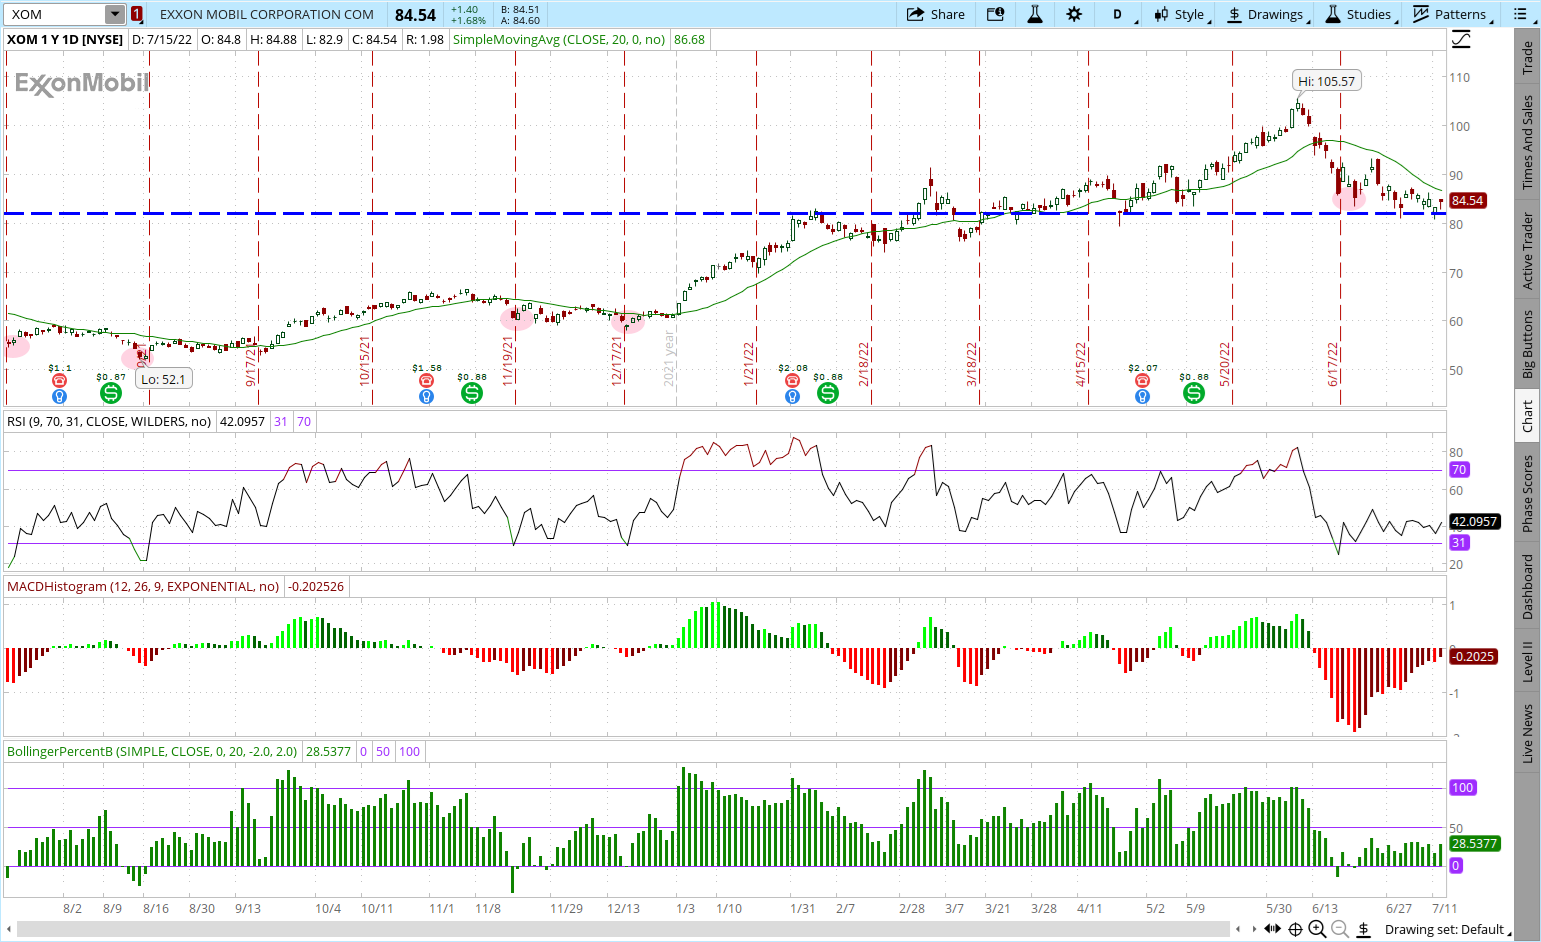
ExxonMobil stock was trading near historically rich valuations last month. P/S was over 1.4x back then and at by far the richest multiple of the prior 12 months. Now that XOM has cratered from the highs, valuations are much more attractive. Current P/S ratio stands at under 1.18x and nearing the lowest multiple in the past 5 months.

Other traditional fundamental metrics such as P/E and P/FCF show a similar drop. The current P/E stands at just over 14x and is at a discount to the 10-year average of 15.23X. Analysts are expecting ExxonMobil to benefit greatly from the increased refining margins and upped the FY 2022 earnings estimates to over $11.50 per share. This equates to a forward P/E of under 8-which should begin to attract value investors.

Technicals

ExxonMobil reached oversold readings before finally bouncing. 9-day RSI breached 30 then turned higher. MACD hit a yearly lower before strengthening considerably. Bollinger Percent B went negative but has since returned to positive territory. XOM stock was trading at a big discount to the 20-day moving average. Shares bounced off major longer-term support at $82 once again.

Previous times all these indicators aligned in a similar fashion marked significant lows in ExxonMobil stock. The fact that it occurred at a major support level makes it an even more powerful indicator.

Implied Volatility

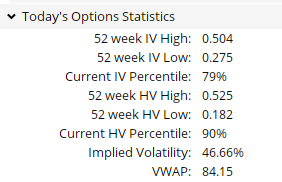
Last month XOM stock option prices were rather cheap. Implied volatility (IV) was trading at just the 34th percentile. The punishing pullback, however, has driven IV up sharply. Current IV now stands at the 79th percentile. This means options prices have gone from fairly cheap to pretty expensive-favoring option selling over option buying when constructing trades.

Spikes in IV are also many times a reliable bullish contrary indicator. Think about how big pops in the VIX have many times been a sign that the fear is at an extreme and the lows are right around the corner.

How To Trade It Now

A month ago, I recommended looking at buying puts on XOM as an effective way to position for a pullback. Shares were overvalued, overbought and IV was cheap. That trade would have worked out nicely given the subsequent big drop in ExxonMobil shares.

Now, however, ExxonMobil is looking way better from a valuation perspective. Shares are getting oversold. Option prices have gotten much more expensive. So instead of buying puts to position for a pullback, selling puts (or put spreads for lower risk traders) is the optimal way to cash in from continued consolidation around the major support area at $82.

Legendary trader Paul Tudor Jones has a saying: “Adapt, evolve, compete, or die”. In this market environment the ability to adapt to quickly changing market conditions and evolve your trading strategy is even more crucial.

POWR Options

What To Do Next?

If you’re looking for the best options trades for today’s market, you should check out our latest presentation How to Trade Options with the POWR Ratings. Here we show you how to consistently find the top options trades, while minimizing risk.

If that appeals to you, and you want to learn more about this powerful new options strategy, then click below to get access to this timely investment presentation now:

How to Trade Options with the POWR Ratings

All the Best!

Tim Biggam

Editor, POWR Options Newsletter


XOM shares closed at $84.54 on Friday, up $1.40 (+1.68%). Year-to-date, XOM has gained 41.12%, versus a -18.31% rise in the benchmark S&P 500 index during the same period.


About the Author: Tim Biggam

Tim spent 13 years as Chief Options Strategist at Man Securities in Chicago, 4 years as Lead Options Strategist at ThinkorSwim and 3 years as a Market Maker for First Options in Chicago. He makes regular appearances on Bloomberg TV and is a weekly contributor to the TD Ameritrade Network “Morning Trade Live”. His overriding passion is to make the complex world of options more understandable and therefore more useful to the everyday trader. Tim is the editor of the POWR Options newsletter. Learn more about Tim’s background, along with links to his most recent articles.

More…

The post 3 Reasons Why Big Oil Is A Buy After A Punishing Pullback appeared first on StockNews.com

https://www.entrepreneur.com/article/431576


Don’t Be a Sucker…the Worst Is Still to Come

Inflation news provides more signs the worst in the stock market (SPY) is not behind us. Earnings season is providing more signs the worst is not behind us. Economic reports are providing more signs the worst is not yet behind us. The only confusion is all the silly little “suckers rallies” that pop up between the next leg lower. My advice…don’t be a sucker. Read on below for this week’s commentary to explain why the bear is not done mauling stocks. That will be at the heart of our discussion in this week’s commentary.….

shutterstock.com – StockNews

The headline reads that the S&P 500 (SPY) rallied today because the Retail Sales report was so impressive. Well if that is true, then why did the GDP estimates fall to -1.5% after the report according to the Atlanta Fed???

So again, almost all trends point to things getting worse. And that many of the bounces are nothing more than “suckers rallies” which are so common during bear markets.

Further proof of why the bear market is still in charge is the early painful results this earnings season.

The major banks, JP Morgan, Morgan Stanley and Wells Fargo, all disappointed which is odd because a rising rate environment is supposed to be pure heaven for bank earnings. And yet, they see results stalling.

Here is what Jamie Dimon, CEO of JPMorgan had to say about that:

“But geopolitical tension, high inflation, waning consumer confidence, the uncertainty about how high rates have to go and the never-before-seen quantitative tightening and their effects on global liquidity … are very likely to have negative consequences on the global economy sometime down the road,”

It’s not just banks souring the mood this earnings season. The food industry giant, Conagra Brands, tumbled -8.5% on their quarterly results as inflation is taking a serious bite out of their results.

Speaking of inflation, you probably already know the bad news from this past week that both CPI (+9.1%) and PPI (+8.2%) remain too hot to handle.

There is an oddity to this because there are other measures showing that commodity prices have declined about 17% since the peak in early June. This includes an obvious reduction in prices at the gas pump this past month.

These improvements in commodity prices should at least be showing up in the Producer Price Index which is the leading indicator of where Consumer Price Index winds up in the future.

Here again, + 8.2% for PPI this month is no relief after a very similar +8.3% the previous month. And thus no evident relief for consumers in weeks ahead…and thus more reason to believe this damage will show up in a deepening recession and bear market.

If you are unclear as to why this high inflation is a problem, then remember that the Fed very much believes in maintaining a more palatable 2% inflation rate.

The recent “off the chart” inflation readings means that the Fed will stay ever vigilant to crush this runaway inflation. With likely many more rounds of rate hikes to come.

This increases the odds of harming the economy, which also harms the stock market (SPY).

And if you are unclear why the Fed hates inflation…its because it is so harmful to the consumer who makes up nearly 2/3rds of the economy.

Plain and simple consumers are not keeping up with inflation when you consider that average annual wages have only increased 5.1% in the past year.

Yes, technically speaking the US consumer is 3% poorer right now than a year ago even though their pay check is larger. This pain is showing up more and more in places like Consumer Sentiment which came in at 51.1.

Note that normal conditions should read 100. So we are talking about the lowest readings in this important survey since 1980.

What does 2022 have in common with 1980?

You guessed it…runaway inflation which the Fed finally tamed a couple years later thanks to Fed Chair Volker finally putting an end to that nonsense. Unfortunately, this led to a recession and bear market. Indeed this Fed regime has the very same plans.

They “hope” to not create a recession. But we are well past the point of no return. Remember that a recession is most likely already here thanks to -1.6% GDP in Q1 and all things pointing to another negative read for Q2.

Add to that the next rate hike coming on 7/27…and a lot more rate hikes to come…then it only spells more damage to the economy…lower corporate earnings…lower share prices.

Do NOT get suckered into any of these ill advised and ill fated rallies. That is just computer based traders playing video games with the stock market (SPY) for short term gains. Not real long term investors making thoughtful decisions based upon what comes next.

That reasoning only leads to one conclusion. Prepare for the bear to maul stocks a good while longer.

What To Do Next?

Right now there are 6 positions in my hand picked portfolio that will not only protect you from the bear market, but also lead to ample gains as stocks head lower.

This strategy perfectly fits the mission of my Reitmeister Total Return service. That being to provide positive returns…even in the face of a roaring bear market.

Yes, it’s easy to make money when the bull market is in full swing. Anyone can do that.

Unfortunately most investors do not know how to generate gains as the market heads lower.

So let me show you the way with 6 trades perfectly suited for today’s bear market conditions.

And then down the road we will take our profits on these positions and start bottom fishing for the best stocks to rally as the bull market makes it rightful return.

Come discover what my 40 years of investing experience can do you for you.

Plus get immediate access to my full portfolio of 6 timely trades that are primed to excel in this difficult market environment.

Click Here to Learn More >

Wishing you a world of investment success!


Steve Reitmeister…but everyone calls me Reity (pronounced “Righty”)
CEO, StockNews.com
Editor, Reitmeister Total Return & POWR Value


SPY shares closed at $385.13 on Friday, up $7.22 (+1.91%). Year-to-date, SPY has declined -18.31%, versus a % rise in the benchmark S&P 500 index during the same period.


About the Author: Steve Reitmeister

Steve is better known to the StockNews audience as “Reity”. Not only is he the CEO of the firm, but he also shares his 40 years of investment experience in the Reitmeister Total Return portfolio. Learn more about Reity’s background, along with links to his most recent articles and stock picks.

More…

The post Don’t Be a Sucker…the Worst Is Still to Come appeared first on StockNews.com

https://www.entrepreneur.com/article/431560