Recession is Here…Watch Out Below!

More and more it looks like recession is here. This includes a dramatic decline for ISM Manufacturing discovered this morning. As you likely know, most economist call manufacturing the “canary in the coal mine” for the US economy as it often shows weakness before other areas. In fact, GDP Now from the Atlanta Fed reads it loud and clear with a negative revision for the US economy down to -2.1% for Q2. Ouch! We are going to discuss these new economic facts…what it means for the stock market outlook…and an interesting view on why the S&P 500 (SPY) does not decline in orderly fashion. All that and more is coming your way in this week’s commentary….

shutterstock.com – StockNews

Please enjoy this updated version of my weekly commentary.

Recessions and bear markets go together like peanut butter and jelly. And that is why we investors need to be on proactive lookout for a recession at this time to confirm why the bear is in place and likely to maul stocks further.

Unfortunately the clues on Friday nearly guarantee that recession is here for which investors should “watch out below” for more downside activity.

As stated in the intro, ISM Manufacturing was a grave disappointment today coming in well under expectations at 53.0. Worst of all the forward looking New Orders component rolled over into negative territory at 49.2.

All this bad news was factored into today’s -2.1% reading from the Atlanta Fed’s GDP Now estimate for Q2. That is a noteworthy decline from just -1.0% yesterday. Let’s not forget that back in mid-May this model was pointing to +2.5 growth.

This clearly states that report by report the economy has been heading in the wrong direction for a while.

Now consider that the definition of recession is 2 straight quarters of negative GDP. Thus, with Q1 being an anemic -1.6% means that investors were right to head for the hills early in the year.

So now we have a pretty much confirmed recession to go hand in hand with a confirmed bear market since 6/13 when we crossed below the 20% decline line @ 3,855.

I suspect bottom will be found somewhere between -30% (3,372) to -40% (2,891) given that the average bear market leads to 34% decline. Which means we have not seen the lows quite yet.

Now let’s transition to another interesting conversation brought up to be my many customers. If it is so obvious that we are in a recession and bear market…then why does the S&P 500 (SPY) not descend in a more orderly fashion?

For example, today with even more recessionary evidence in hand the market actually ended higher. That just doesn’t make any darn sense on the surface. But as we dig down a bit more we will appreciate the circuitous path stocks take to their final destination.

First and foremost we know that nothing with the market (SPY) is smooth. Ever since the rise of computer based trading it has greatly amplified volatility with many more sessions in the plus or minus 1% camp.

However, the real issue is that there are so many different types of investors with so many different styles and view points that smooth alignment of purpose is never in the cards. For example, consider all these varying investment aspects:

Long term buy and hold investors vs. swing traders with 1-3 month time horizon vs. day traders dealing in seconds and minutes.

Aggressive vs. conservative investors

Growth vs. value vs. income vs. momentum investors

Computer driven quant models vs. human decision making

Fundamental investors vs. technical investors.

Even just in the realm of fundamental investors, you appreciate that economics is an inexact science. So if got 10 economists in the room you are likely to have 10 different opinions.

Heck, over the decades on average only 40% of economist predict a recession before it arrives. This is why economists are often the butt of stock market jokes.

And the list of differing points of view goes on. And this is why the S&P 500 (SPY) rarely goes up or down in smooth fashion.

Back to the main point. This is a recession. And thus a bear market. Stocks going down in coming weeks and months is the most likely outcome.

HOW, WHEN & WHERE we find bottom is the great mystery. But as long as you appreciate the big picture on these things you can align yourself to the prevailing trends and find a way to outperform.

What To Do Next?

Right now there are 6 positions in my hand picked portfolio that will not only protect you from a forthcoming bear market, but also lead to ample gains as stocks head lower.

This strategy perfectly fits the mission of my Reitmeister Total Return service. That being to provide positive returns…even in the face of a roaring bear market.

Yes, it’s easy to make money when the bull market is in full swing. Anyone can do that.

Unfortunately most investors do not know how to generate gains as the market heads lower. So let me show you the way with 6 trades perfectly suited for today’s bear market conditions.

And then down the road we will take our profits on these positions and start bottom fishing for the best stocks to rally as the bull market makes it rightful return.

Come discover what my 40 years of investing experience can do you for you.

Plus get immediate access to my full portfolio of 6 timely trades that are primed to excel in this difficult market environment.

Click Here to Learn More >

Wishing you a world of investment success!

Steve Reitmeister…but everyone calls me Reity (pronounced “Righty”)
CEO, StockNews.com
Editor, Reitmeister Total Return & POWR Value


SPY shares closed at $381.24 on Friday, up $3.99 (+1.06%). Year-to-date, SPY has declined -19.14%, versus a % rise in the benchmark S&P 500 index during the same period.


About the Author: Steve Reitmeister

Steve is better known to the StockNews audience as “Reity”. Not only is he the CEO of the firm, but he also shares his 40 years of investment experience in the Reitmeister Total Return portfolio. Learn more about Reity’s background, along with links to his most recent articles and stock picks.

More…

The post Recession is Here…Watch Out Below! appeared first on StockNews.com

https://www.entrepreneur.com/article/430699


1 Retail Stock to Pick Up and 1 to Avoid

Soaring Inflation and supply chain disruptions have significantly dampened the retail sector’s growth this year. Amid slowing consumer demand, we think investors should invest in Walmart (WMT) since it possesses enough fundamental strength to withstand an economic downturn. On the contrary, Honest Company (HNST) should be avoided now, given its bleak growth prospects. Read on to learn more….

shutterstock.com – StockNews

Internet retail stocks were impacted severely after the Federal Reserve’s 75 basis-point interest earlier this month, which was the largest increase since 1994. Inflation came as a significant headwind in the retail sector in May since industry leaders reported the impact of higher costs on their operations.

This also created anxieties among the investors, and as a result, some of America’s largest retailers saw the biggest declines in their stock prices since the market crash of 1987. The Federal Reserve’s predictions for higher unemployment and gas prices have also contributed to the industry’s weak stock market performance.

Nevertheless, consistent consumer spending on non-discretionary items could help the sector rebound quickly. Walmart Inc.’s (WMT) robust financials, various collaborations, and impressive growth attributes should help it survive the industry challenges. It could be wise to buy the stock now.

However, not all retail stocks possess the requisite fundamentals to withstand the current turbulent market scenario. We think The Honest Company, Inc. (HNST) is best avoided now, given its weak financials and poor growth prospects.

Stock to Buy:

Walmart Inc. (WMT)

WMT is engaged in the operation of retail, wholesale, and other units worldwide. The company has three operational segments: Walmart U.S.; Walmart International; and Sam’s Club. It operates supercenters, supermarkets, hypermarkets, warehouse clubs, cash and carry stores, and discount stores.

WMT and Memomi, an augmented reality (AR) optical tech company, recently announced that they have agreed for WMT to acquire Memomi. This strengthens WMT’s commitment to frictionless and omnichannel optical care. Since 2019, Memomi has enabled digital measurements for all Walmart and Sam’s Optical customers across more than 2,800 Walmart Vision Centers and 550 Sam’s Clubs and also powers the Optical eCommerce experience on SamsClub.com.

This month, WMT and Roku, Inc. (ROKU) announced a one-of-its-kind partnership to make TV streaming the next e-commerce shopping destination. WMT will be the exclusive retailer to enable streamers to purchase featured products fulfilled by Walmart directly on Roku, America’s #1 TV streaming platform

Also, last month, Symbotic LLC, a profound A.I.-powered supply chain technology company, WMT announced an expanded commercial agreement to integrate Symbotic’s robotics and software automation platform in all 42 of WMT’s regional distribution centers over the years ahead.

In the first quarter ending March 31, 2022, WMT’s total revenues increased 2.4% year-over-year to $141.57 billion. Its operating income amounted to $5.32 billion, while its net income amounted to $2.05 million. The company’s non-GAAP EPS came in at $0.74. The stock has declined 4.7% over the past month.

The $1.82 consensus EPS estimate represents a 2.1% improvement year-over-year for the second quarter ending July 2022. Analysts expect WMT’s revenue to increase 5.5% year-over-year to $147.57 billion for the quarter. Moreover, the company has an impressive earnings surprise history, as it surpassed the consensus EPS estimates in three of the trailing four quarters.

WMT’s POWR Ratings reflect this promising outlook. The company has an overall B rating, which translates to Buy in our proprietary rating system. The POWR Ratings assess stocks by 118 different factors, each with its own weighting.

The stock also has a B grade for Growth. Within the A-rated Grocery/Big Box Retailers industry, it is ranked #17 of 38 stocks.

To see additional POWR Ratings for Sentiment, Value, Momentum, Quality, and Stability for WMT, click here.

Stock to Avoid:

The Honest Company, Inc. (HNST)

HNST manufactures and sells diapers, wipes, skin and personal care, and household and wellness products. The company also provides baby clothing and nursery bedding products. It sells its products through digital and retail sales channels, such as its website, third-party e-commerce sites, and brick-and-mortar retailers.

During the first quarter ending March 31, 2022, HNST’s revenue declined 15.2% year-over-year to $68.72 million. Its operating loss grew 251.8% from its year-ago value to $14.55, while its net loss increased 226.2% from its prior-year quarter to $14.63 million. The company’s loss per share increased 23.1% year-over-year to $0.16.

The consensus EPS estimate is expected to decline in the second quarter ending June 2022. The company’s shares have fallen 82.2% over the past year and 72.1% over the past nine months.

HNST’s weak fundamentals are reflected in its POWR ratings. The stock has an overall D rating, which equates to Sell in our POWR Ratings system. The stock also has an F grade for Sentiment and a D for Stability. In the C-rated Consumer Goods industry, it is ranked 54 of 61 stocks.

In addition to the POWR Ratings grades I have just highlighted, you can see the HNST’s rating for Quality, Value, Growth, and Momentum here.


WMT shares were trading at $121.95 per share on Thursday afternoon, up $0.03 (+0.02%). Year-to-date, WMT has declined -15.08%, versus a -19.44% rise in the benchmark S&P 500 index during the same period.


About the Author: Spandan Khandelwal

Spandan’s is a financial journalist and investment analyst focused on the stock market. With her ability to interpret financial data, she aims to help investors evaluate the fundamentals of a company before investing.

More…

The post 1 Retail Stock to Pick Up and 1 to Avoid appeared first on StockNews.com

https://www.entrepreneur.com/article/430592


3 Bargains Yielding 7% Or More

In the face of rising inflationary pressures, aggressive interest rate hikes, and increasing recession fears, the major stock market indices have witnessed major sell-offs over the past couple of months. Given the current market volatility, we think fundamentally sound dividend stocks ARC Document Solutions (ARC), Nippon Steel (NPSCY), and A.P. Møller – Mærsk (AMKBY), which yield more than 7%, could be ideal investments to ensure a steady income stream. These stocks are also trading at significant discounts to their peers. Read on to learn more.

shutterstock.com – StockNews

The multi-decade high inflation and the Fed’s constant efforts to fight it by raising the interest rates have led to massive sell-offs on Wall Street over the past couple of months. The S&P 500 is still down more than 18% year-to-date. Earlier this month, the Fed raised interest rates by 75 basis points, the largest increase in nearly three decades, and also hinted at more aggressive tightening ahead.

Many analysts expect the Fed’s hawkish moves could eventually tip the U.S. economy into a recession. However, Jack Ablin, chief investment officer at Cresset Capital, said, “We’re calling for a small “r’ recession. It means it’s not going to be protracted, and things aren’t going to fall apart.”

Given the market fluctuations, we think fundamentally sound dividend stocks ARC Document Solutions, Inc. (ARC), Nippon Steel Corporation (NPSCY), and A.P. Møller – Mærsk A/S (AMKBY), which are yielding more than 7%, could be safe additions to one’s portfolio. These stocks are currently trading at significant discounts to their peers.

ARC Document Solutions, Inc. (ARC)

ARC is a digital printing company that provides digital printing and document-related services in the United States. It provides managed print services that place, manage, and optimize print and imaging equipment in customers’ offices, job sites, and other facilities; and cloud-based document management software and other digital hosting services.

ARC declared a quarterly dividend of $0.05 on April 29, 2021, payable on August 31, 2022. Its $0.20 annual dividend yields 7.49% on the current share price.

During the first quarter ending March 31, 2022, ARC’s net sales increased 12.6% year-over-year to $69.50 million. Its income from operations grew 78.2% from its year-ago value to $3.06 million, while its adjusted net income improved 150% from its prior-year quarter to $2.00 million. The company’s adjusted EPS rose 150% year-over-year to $0.05.

ARC’s 14.83x trailing-12-months non-GAAP P/E is 5.7% lower than the 15.72x industry average. Its 0.64x trailing-12-months EV/Sales is also 62.3% lower than the 1.70x industry average.

It has an impressive earnings surprise history, as it surpassed the consensus EPS estimates in all of the trailing four quarters.

ARC’s POWR Ratings reflect this promising outlook. The company has an overall rating of A, which translates to Strong Buy in our proprietary rating system. The POWR Ratings assess stocks by 118 different factors, each with its own weighting.

The stock also has an A grade for Quality and Value and a B for Sentiment. Within the B-rated Outsourcing – Business Services industry, it is ranked #2 of 44 stocks.

To see additional POWR Ratings for Growth, Stability, and Momentum for ARC, click here.

Nippon Steel Corporation (NPSCY)

Headquartered in Tokyo, Japan, NPSCY is engaged in steelmaking and steel fabrication, engineering and construction, chemicals and materials, and system solutions businesses in Japan and internationally. The company’s steelmaking and steel fabrication business provides steel plates, sheets, and slags; bar and rod materials; structural steel; pipes and tubes, and other related products.

NPSCY paid a semiannual dividend of $0.62 on December 8, 2021. Its $1.31 annual dividend yields 9.7% on the current share price. It has a four-year average dividend yield of 2.84%. In addition, the company’s dividend payouts have increased at a 26.7% CAGR over the past five years.

For the fiscal year ending March 31, 2022, NPSCY’s net sales increased 41% year-over-year to ¥6808.89 billion ($5.04 billion). Its operating profit grew significantly from its year-ago value to ¥840.90 billion ($6.22 billion), while its profit for the year amounted to ¥637.32 billion ($4.72 billion) compared to a loss of ¥32.43 billion ($142.99 million). The company’s EPS came in at ¥657.48 compared to a loss per share of ¥35.22 in the prior-year period.

NPSCY’s 0.87x forward EV/Sales is 37.1% lower than the 1.38x industry average. Its 5.00x forward EV/EBITDA is also 19.9% lower than the 6.24x industry average.

Analysts expect NPSCY’s revenue to increase 5% year-over-year to $14.47 billion for the first quarter ending June 2022.

NPSCY’s strong fundamentals are reflected in its POWR Ratings. The stock has an overall B rating, which equates to Buy in our POWR Ratings system. The stock also has an A grade for Value and a B for Stability. Within the A-rated Steel industry, it is ranked #10 of 32 stocks.

In total, we rate NPSC in eight different levels. Beyond what we’ve stated above, we have also given NPSCY grades for Growth, Sentiment, Momentum, and Quality. Get all the NPSCY ratings here.

A.P. Møller – Mærsk A/S (AMKBY)

Headquartered in Copenhagen, Denmark, AMKBY functions as an integrated transport and logistics company worldwide. The company’s Ocean segment engages in container shipping activities, including demurrage and detention, terminal handling, documentation and container services, and container storage, as well as transshipment services under Maersk Line, Safmarine, Sealand – A Maersk Company, Hamburg Süd, and APM Terminal brands; and sale of bunker oil.

Recently, AMKBY announced a share buy-back program of up to DKK 32 billion (around $5 billion) to be executed over a period of two years. As announced on 4 May 2022, during the second phase of the program running from 5 May 2022 to 1 November 2022, the company will buy back A and B shares for an amount of up to DKK 8bn.

AMKBY’s annual dividend of $1.85 yields 15.27% on the current share price. It has a four-year average dividend yield of 6.11%. In addition, the company’s dividend payouts have increased at a 76.6% CAGR over the past five years.

In the first quarter of fiscal 2022, ending March 31, 2022, AMKBY’s total revenue increased 55.1% year-over-year to $19.29 billion. Its profit for the period grew 150.1% from its year-ago value to $6.81 billion. The company’s cash and bank balances increased 88.6% from its prior-year quarter to $12.11 billion for the 12 months ending March 31, 2022.

AMKBY’s 2.02x forward Non-GAAP P/E is 86.7% lower than the 15.19x industry average. Its 0.63x forward EV/Sales is also 84.9% lower than the 11.79x industry average.

Analysts expect AMKBY’s revenue to increase 38.4% year-over-year to $19.69 billion for the second quarter ending June 2022.

It is no surprise that AMKBY has an overall A rating, which equates to Strong Buy in our POWR Ratings system. AMKBY has an A grade for Value and a B grade for Momentum and Quality. Among the 44 stocks in the A-rated Shipping industry, it is ranked #1.

Click here to see the additional POWR Ratings for AMKBY (Growth, Sentiment, and Stability).


ARC shares were unchanged in premarket trading Tuesday. Year-to-date, ARC has declined -20.60%, versus a -17.30% rise in the benchmark S&P 500 index during the same period.


About the Author: Spandan Khandelwal

Spandan’s is a financial journalist and investment analyst focused on the stock market. With her ability to interpret financial data, she aims to help investors evaluate the fundamentals of a company before investing.

More…

The post 3 Bargains Yielding 7% Or More appeared first on StockNews.com

https://www.entrepreneur.com/article/430400


Better Buy: Reliance Steel & Aluminum Vs. Olympic Steel

Despite inflationary pressures, steel demand is expected to remain positive this year and the next. With favorable prospects across market segments, steel industry players Reliance Steel & Aluminum (RS) and Olympic Steel (ZEUS) might benefit. However, which stock is a better buy? Read on to find out.

shutterstock.com – StockNews

Reliance Steel & Aluminum Co. (RS) is a diversified metal solutions provider and metal service center company. The company distributes several metal products and provides metal processing services to different industries.

On the other hand, Olympic Steel, Inc. (ZEUS) operates as a storage metals products processing and distribution company. It operates through the three broad segments of Carbon Flat Products; Specialty Metals Flat Products; and Tubular and Pipe Products.

Steel demand forecasts remain robust despite the inflationary pressures and the geopolitical situation in Ukraine. The World Steel Association projected steel demand to grow by 0.4% in 2022 to reach 1,840.2 Mt and to surge 2.2% to reach 1,881.4 Mt in 2023.

With the expected deployment of private and public infrastructure projects, the global stainless steel market is expected to grow at an 8.9% CAGR between 2022 to 2030. In addition, the international flat carbon steel market is expected to reach $701 billion, growing at a CAGR of 6.1%.

Both RS and ZEUS are known players in the steel industry and are poised to cash in on the solid demand.

Over the past year, RS’ stock has gained 13.5%, while ZEUS declined 9.9%. Over the past five days, RS has gained 2%, while ZEUS declined 3.6%. However, ZEUS has gained 14.5% year-to-date, while RS has gained 7.2%.

But which stock is a better buy now? Let’s find out.

Latest Developments

In April, RS announced that the company remains optimistic about the underlying demand and expects tons sold to be flat to up 2% in the second quarter compared to the first. RS forecasted non-GAAP EPS to come in the range of $9.00 to $9.10 for the second quarter of 2022.

In May, Richard T. Marabito, Chief Executive Officer of ZEUS, said, “We remain optimistic and expect to have a strong second quarter, as we see consistent demand across our end markets and a balanced inventory position in the service center industry.” The company also approved a quarterly dividend of $0.09 per share, which was payable to shareholders on June 15.

Recent Financial Results

For the fiscal first quarter ended March 31, RS’ net sales increased 58% year-over-year to $4.49 billion. Non-GAAP net income attributable to Reliance and non-GAAP EPS improved 99.1% and 105.4% from the same period the prior year to $528.70 million and $8.42.

ZEUS’ net sales increased 50.4% year-over-year to $696.33 million in the fiscal first quarter ended March 31. Adjusted EBITDA rose 48.1% from the prior-year quarter to $56.02 million. Adjusted net income per share improved 57.4% from the same period the prior year to $3.10.

Past and Expected Financial Performance

RS’s revenue, net income, and EPS have grown at CAGRs of 10.3%, 36.6%, and 41.6%, respectively, over the past three years. The consensus EPS estimates for the quarters ending June and September 2022, and the fiscal year 2022 indicate a 77.7%, 12%, and 33.9% year-over-year increase, respectively. Revenue for the same periods is expected to improve by 45.4%, 2%, and 18.8% from their respective prior-year periods.

ZEUS’ revenue, net income, and EPS have grown at CAGRs of 12.6%, 69.1%, and 68.9%, respectively, over the past three years. Street EPS estimates for the quarter ending June 2022 indicate a 5.4% year-over-year increase. However, its EPS for the quarter ending September 2022 and fiscal 2022 is expected to decrease 60.5% and 21% from their respective prior-year periods. Street revenue estimates for the current quarter and the current year indicate a 17.6% and 4.9% year-over-year improvement. However, the consensus revenue estimate for the next quarter reflects a decline of 12.2% from the prior-year quarter.

Profitability

RS’ trailing 12-month revenue is 6.2 times what ZEUS generates. RS’ trailing-12-month gross profit margin, EBITDA margin, and net income margin of 31.42%, 16.16%, and 10.61% compare with ZEUS’ 21.33%, 8.41%, and 5.36%, respectively.

RS’ trailing-12-month ROE, ROTC, and ROA of 18.53% and 16.51% compared to ZEUS’ 17.96% and 13.06%, respectively.

Thus, RS is the more profitable stock here.

Valuation

In terms of its forward EV/EBITDA, ZEUS is trading at 4.80x, 8.4% higher than RS’ 4.43x. On the other hand, RS’ forward EV/EBIT multiple of 4.77 is 15.2% higher than ZEUS’ multiple of 4.14.

POWR Ratings

RS has an overall A rating, equating to Strong Buy in our proprietary POWR Ratings system. On the other hand, ZEUS has an overall rating of B, translating to Buy. The POWR Ratings are calculated considering 118 different factors, with each factor weighted to an optimal degree.

RS has a B grade for Sentiment, consistent with the favorable analyst expectations regarding its revenue and EPS. On the other hand, ZEUS has a Sentiment grade of C, in sync with its mixed consensus EPS and revenue estimates.

RS has a B grade for Quality in sync with its net income margin and ROTC of 10.61% and 18.53%, 22.5%, and 151.7%, higher than their respective industry averages of 8.66% and 7.36%. ZEUS has a C grade for Quality, which is justified by its net income margin of 5.36%, 38.2% lower than the industry average. Its ROTC of 17.96% is 144% higher than the industry average.

In the 32-stock Steel industry, RS is ranked #9, while ZEUS is ranked #22. The industry is rated A.

Beyond what we’ve stated above, we have also rated the stocks for Growth, Value Momentum, and Stability. Click here to see the additional POWR Ratings for RS. To see the additional POWR Ratings for ZEUS, click here.

Winner

Both RS and ZEUS might benefit from the favorable prospects of the steel market with an expected rise in demand in the coming years. However, given better growth estimates for RS and its relatively wider profit margins, the stock looks like a better buy now.

Our research shows that odds of success increase when one invests in stocks with an overall rating of Strong Buy or Buy. View all the top-rated stocks in the Steel industry here.


RS shares were unchanged in premarket trading Tuesday. Year-to-date, RS has gained 8.23%, versus a -17.39% rise in the benchmark S&P 500 index during the same period.


About the Author: Anushka Dutta

Anushka is an analyst whose interest in understanding the impact of broader economic changes on financial markets motivated her to pursue a career in investment research.

More…

The post Better Buy: Reliance Steel & Aluminum Vs. Olympic Steel appeared first on StockNews.com

https://www.entrepreneur.com/article/430399


Buy These Stock Splits as Analysts See Upside

The market has witnessed several stocks-splits this year. Analysts see upside in Fortinet (FTNT), Alphabet (GOOGL), and Nintendo (NTDOY), which have either undergone a stock split or will do so in the near term. The availability of these stocks at affordable prices after their splits could be an excellent opportunity to invest in them. Continue reading….

shutterstock.com – StockNews

Many companies have undergone stock splits this year. Stock splits are usually undertaken when the share price has reached very high levels. The bull run last year led to a massive spike in the stock prices of many companies.

Stock splits occur when a company decides to increase the number of its shares to boost the stock’s liquidity and make it affordable for investors. A stock split does not change the company’s market value. However, post a stock split, the price often rises as many investors consider this action as conveying the company’s unrealized value and growth prospects.

Stocks Fortinet, Inc. (FTNT), Alphabet Inc. (GOOGL), and Nintendo Co., Ltd. (NTDOY) have already undergone or are about to undergo a stock split. Analysts expect these stocks to rally in the upcoming months, given their fundamental strength. Therefore, it could be wise to add these stocks to your watchlist.

Fortinet, Inc. (FTNT)

FTNT offers cybersecurity and networking solutions. The company provides cyber security solutions to various organizations, including enterprises, communication service providers, government organizations, and small businesses.

Its FortiOS network operating system manages its network security appliances. Its cloud security portfolio also includes securing applications, including email and web. Its cloud security offerings are available for deployment in public and private cloud environments.

FTNT had undergone a five-for-one stock split on June 22, 2022. The stock started trading on a split-adjusted basis on June 23, 2022.

On April 4, 2022, FTNT announced the release of FortiOS 7.2, the latest upgrade to its flagship operating system and the foundation of the Fortinet Security Fabric. The enhancements to FortiOS enable organizations to dodge the threat landscape while helping achieve digital acceleration.

FTNT’s revenue increased 34.4% year-over-year to $954.80 million for the first quarter ended March 31, 2022. The company’s non-GAAP net income increased 14.3% year-over-year to $155.10 million. Also, its non-GAAP EPS came in at $0.94, representing an increase of 16% year-over-year.

Analysts expect FTNT’s EPS and revenue for the quarter ending September 30, 2022, to increase 35% and 38.7% year-over-year to $0.27 and $1.13 billion, respectively. It surpassed Street EPS estimates in each of the trailing four quarters.

Over the past year, the stock has gained 21.5% to close the last trading session at $58.85. Wall Street analysts expect the stock to hit $71.32 in the upcoming months, indicating a potential upside of 21.2%.

Alphabet Inc. (GOOGL)

GOOGL is the holding company behind Google and other bets. The Google segments include Google Services and Google Cloud. Its products and platforms include Android, Chrome, Gmail, Google Drive, Google Maps, Search, and Youtube.

GOOGL has announced a 20-for-1 stock split, which will take effect on July 15.

On March 8, 2022, GOOGL announced that it had signed a definitive agreement to acquire Mandiant, Inc. The acquisition is expected to bolster Google Cloud’s security strength.

For the fiscal first quarter ended March 31, 2022, GOOGL’s revenues increased 23% year-over-year to $68.01 billion. The company’s operating income increased 22.2% year-over-year to $20.09 billion. Also, its Total Acquisition Cost (TAC) increased 23.4% year-over-year.

For fiscal 2023, GOOGL’s EPS and revenue are expected to increase 18.6% and 15.1% year-over-year to $131.62 and $342.35 billion, respectively. It surpassed consensus EPS estimates in three of the trailing four quarters.

Over the past month, the stock has gained 3.1% to close the last trading session at $2,316.67. Wall Street analysts expect the stock to hit $3,138.17 in the upcoming months, indicating a potential upside of 35.4%.

Nintendo Co., Ltd. (NTDOY)

NTDOY is mainly engaged in developing, manufacturing, and selling entertainment products in the home entertainment field. The company’s main products include game machines such as portable and console game machines and software, as well as trump and Carta.

On May 10, 2022, NTDOY announced a 10-1 stock split, which will become effective on October 1, 2022.

NTDOY’s total current assets increased 5.2% year-over-year to ¥2,126.21 billion ($15.73 billion) for the fiscal year ended March 31, 2022. The company’s total assets increased 8.8% year-over-year to ¥2,662.38 billion ($19.69 billion). Also, its non-operating income increased 98.3% year-over-year to ¥78.78 billion ($582.83 million).

Analysts expect NTDOY’s revenue for fiscal 2023 to increase 15.9% year-over-year to $12.78 billion. Over the past year, the stock has lost 25.5% to close the last trading session at $53.87. However, Wall Street analysts expect the stock to hit $72.67 in the upcoming months, indicating a potential upside of 34.9%.


FTNT shares rose $1.70 (+2.89%) in premarket trading Tuesday. Year-to-date, FTNT has declined -18.13%, versus a -17.58% rise in the benchmark S&P 500 index during the same period.


About the Author: Dipanjan Banchur

Since he was in grade school, Dipanjan was interested in the stock market. This led to him obtaining a master’s degree in Finance and Accounting. Currently, as an investment analyst and financial journalist, Dipanjan has a strong interest in reading and analyzing emerging trends in financial markets.

More…

The post Buy These Stock Splits as Analysts See Upside appeared first on StockNews.com

https://www.entrepreneur.com/article/430391


Buy The Dip in This High-Rated Dividend Leader

With analysts forecasting a recession later this year, investors should consider investing in dividend-paying stocks to generate a solid passive income. Canadian Natural Resources (CNQ) is a high-rated dividend leader, trading much below its 52-week high. Given its robust financials and higher-than-industry profitability, it could be ideal to buy the dip in the stock. Read on….

shutterstock.com – StockNews

Canadian Natural Resources Limited (CNQ) acquires, explores for, develops, produces, markets, and sells crude oil, natural gas, and natural gas liquids. The company offers synthetic crude oil, light, and medium crude oil, bitumen, primary heavy crude oil, and Pelican Lake heavy crude oil.

CNQ beat its EPS estimate by 10.6% in the last reported quarter. The company also beat the Street revenue estimates by 13.2%. It has surpassed consensus EPS estimates in each of the trailing four quarters.

CNQ’s four-year average dividend yield is 4.41%, and its forward annual dividend of $2.23 translates to a 4.59% yield. The company has increased its dividend for six consecutive years. Its dividend has grown at a 23.3% CAGR over the past three years.

CNQ’s shares have gained 19.5% in price year-to-date and 38.6% over the past year to close the last trading session at $50.52. The stock is currently trading 28.4% below its 52-week high of $70.60, which it hit on April 21, 2022.

Here’s what could influence CNQ’s performance in the upcoming months:

Robust Financials

CNQ’s revenue has increased 61.5% year-over-year to C$10.67 billion ($8.27 billion) for the first quarter ended March 31, 2022. The company’s net earnings increased 125.2% year-over-year to C$3.10 billion ($2.40 billion). Also, its EPS came in at C$2.63, representing an increase of 126.7% year-over-year. In addition, its cash from operating activities increased 12.5% year-over-year to C$2.85 billion ($2.21 billion).

Mixed Analyst Estimates

Analysts expect CNQ’s EPS and revenue for fiscal 2022 to increase 73% and 39% year-over-year to $8.41 and $32.34 billion, respectively. However, its EPS and revenue for fiscal 2023 are expected to decline 13.6% and 13.5% year-over-year to $7.27 and $27.97 billion, respectively.

Mixed Valuation

In terms of forward non-GAAP P/E, CNQs 5.56x is 20.6% lower than the 7.01x industry average. Likewise, its 4.80x forward EV/EBIT is 48% lower than the 9.24x industry average. However, the stock’s 1.84x forward P/B is 3.9% higher than the 1.78x industry average. Also, its 2.35x forward P/S is 68.4% higher than the 1.39x industry average.

High Profitability

In terms of trailing-12-month net income margin, CNQ’s 27.51% is 345.4% higher than the 6.18% industry average. Likewise, its 15.06% trailing-12-month Capex/S is 44.7% higher than the industry average of 10.40%. Furthermore, the stock’s 56.16% trailing-12-month gross profit margin is 39.9% higher than the industry average of 40.13%.

In addition, the stock’s trailing-12-month ROCE, ROTC, and ROA came in at 26.18%, 13.66%, and 12.03%, compared to the industry averages of 10.62%, 5.07%, and 3.58%, respectively.

POWR Ratings Show Promise

CNQ has an overall rating of B, equating to a Buy in our POWR Ratings system. The POWR Ratings are calculated by taking into account 118 different factors, with each factor weighted to an optimal degree.

Our proprietary rating system also evaluates each stock based on eight distinct categories. CNQ has a B grade for Quality, in sync with its 51.36% trailing-12-month EBITDA margin, which is 133.1% higher than the industry average of 22.03%.

CNQ is ranked #22 out of 42 stocks in the A-rated Foreign Oil & Gas industry. Click here to access CNQ’s Growth, Value, Momentum, Stability, and Sentiment ratings.

Bottom Line

With the increasing odds of a recession, investors can look to add dividend-paying stocks to their portfolios to generate stable income. CNQ has a strong track record of increasing dividends. The company has beaten its consensus EPS estimates in each of the trailing four quarters, but the stock is currently trading below its 50-day and 200-day moving averages. Moreover, its robust financials and higher-than-industry profitability make the investment case stronger.

How Does Canadian Natural Resources Limited (CNQ) Stack Up Against its Peers?

CNQ has an overall POWR Rating of B, equating to a Buy rating. You might want to consider investing in the following Foreign Oil & Gas stocks with an A (Strong Buy) and B (Buy) rating: Eni S.p.A. (E), Parex Resources Inc. (PARXF), and Gran Tierra Energy Inc. (GTE).


CNQ shares were unchanged in premarket trading Monday. Year-to-date, CNQ has gained 22.00%, versus a -17.26% rise in the benchmark S&P 500 index during the same period.


About the Author: Dipanjan Banchur

Since he was in grade school, Dipanjan was interested in the stock market. This led to him obtaining a master’s degree in Finance and Accounting. Currently, as an investment analyst and financial journalist, Dipanjan has a strong interest in reading and analyzing emerging trends in financial markets.

More…

The post Buy The Dip in This High-Rated Dividend Leader appeared first on StockNews.com

https://www.entrepreneur.com/article/430293


3 Tech Stocks to Buy as Inflation Expectations Ease

With the economy slowing and oil prices down by about 20% over the last couple of weeks, odds are increasing that inflation could be turning lower. This could be a catalyst for high-quality tech stocks such as Microsoft (MSFT), Veeva (VEEV), and Expedia (EXPE).

shutterstock.com – StockNews

Over the past month, there has been a major change in the market under the surface. In essence, inflation risk is dropping, while recession risk is increasing.

This has major implications for investors, especially as this looks to be a meaningful trend that could persist for many months. Although we’ve yet to see a major impact in terms of earnings and employment, it’s increasingly clear that the economy is slowing which is being exacerbated by the Fed’s hawkish stance.

This slowing is inevitably going to affect inflation. Leading indicators are showing a dramatic drop in transportation costs, while retailers are cutting prices in order to move inventory off shelves. The one component that continued to move higher – food and energy – has also turned lower and in some cases, is below their pre-invasion levels.

Prior to these latest developments, we had an economy with low recession risk and rising inflation risk. This led to outperformance for cyclical stocks, while growth and tech languished. Now, we should expect growth and tech stocks to outperform amid these circumstances. Below are 3 tech stocks that investors should consider buying on weakness:

Veeva Systems (VEEV)

VEEV is at the intersection of several, bullish booming trends. These include enterprise software, cloud computing, healthcare, and pharmaceuticals.

The healthcare sector’s growth is fueled by demographics due to an aging population in developed countries all over the world, increased government spending, and the constant stream of innovations that lead to new treatments. Healthcare spending as a share of GDP has risen to 18% in 2020, from under 12% in 1990.

However, VEEV is actually a software and cloud computing company which come with more growth and higher margins. Unlike many stocks in the software and cloud space, there are high barriers to entry which means limited competition. For investors, it translates into a deep and wide moat, and leads to high rates of recurring revenue.

From peak to trough, VEEV’s stock price declined by 56%. Yet, the earnings outlook remains solid as evidenced by its latest report which showed the company beating on the top and bottom-line and issuing better than expected guidance.

Given these positives, it’s not surprising that VEEV has an overall B rating, which translates to a Buy in our POWR Ratings system. It also has an A for Quality as it’s one of the leading stocks in a large total addressable market with only a handful of competitors.

VEEV also has a B for growth makes sense given its double-digit earnings and revenue growth and positioning at the intersection of two large and growing markets – healthcare and cloud computing. Click here to see more of VEEV’s POWR Ratings including grades for Value, Momentum, and Stability.

Expedia (EXPE)

EXPE is one of the largest online booking companies in the world. It operates through multiple segments including Expedia, Vrbo, Hotels.com, Orbitz, Travelocity, and Wotif. In addition, it offers a range of travel and non-travel verticals, including for corporate travel management, airlines, travel agents, online retailers, and financial institutions.

Like many travel stocks, EXPE is seeing a huge surge in revenues and bookings due to people’s pent-up demand for travel. However, the stock price has languished due to the market’s concern of a slowdown and potential recession.

Thus, EXPE’s stock is down 57% from its all-time high in Februay of this year. Despite this, the stock’s earnings outlook remains strong. This year, analysts expect the company to earn $7 per share which will climb to $9 per share in 2023.

This combination fo growth and value makes the stock quite attractive. It’s a major reason why EXPE is rated a B which equates to a Buy rating. The POWR Ratings are calculated by considering 118 distinct factors, with each factor weighted to an optimal degree. B-rated stocks have posted an average annual performance of 21.1% which compares favorably to the S&P 500’s average annual 8.0% gain.

Click here to see EXPE’s complete POWR Ratings.

Microsoft (MSFT)

MSFT needs no introduction given its dominance in multiple categories such as PC software, enterprise software, and cloud computing. It’s also the best-performing stock in the S&P 500 over the last decade.

However, the stock did suffer a pullback amid the selloff in the market and rise in rates. As inflation expectations decline, we are seeing longer-term rates pull back. This is a positive catalyst for stocks like MSFT.

One reason is Microsoft’s fortress of a balance sheet which means it’s insulated from economic weakness. Further, its dividends become more attractive in a lower-rate environment, and share buybacks become more attractive.

Although, Microsoft’s dividend is quite modest at just over 1%, it is one of the leaders in terms of dividend growth. Over the last 3 years, it’s increased its payout by more than 10%. And, the payout has increased by 259% over the last decade. This is also in addition to hefty buybacks.

Many stocks with attractive dividends and a strong balance sheet are lacking when it comes to earnings and revenue growth. Not so in MSFT’s case which continues to see double-digit earnings growth in 2022.

MSFT’s POWR Ratings reflect this promising outlook. The stock has an overall B rating, which equates to Buy in our proprietary rating system. The stock has a B for Quality due to its leadership in many large markets and a track record of growth and execution. It also has a B for Sentiment as 22 out of 23 analysts covering the stock have a Buy rating with a consensus price target of $363, implying a 31% upside. Click here to see the complete POWR ratings for MSFT.

Want more stocks like these?

Our POWR Growth portfolio was launched in April last year and since then has greatly outperformed just about every comparable index…including the S&P 500, Russell 2000 and Cathie Wood’s Ark Innovation ETF.

What is the secret to success?

The portfolio gets most of its fresh picks from the Top 10 Growth Stocks strategy which has stellar +49.10% annual returns. I then take the very best stocks from this strategy and tell you exactly what to buy & when to sell, so you can maximize your gains.

If you would like to see the current portfolio of growth stocks, and be alerted to our next timely trades, then consider starting a 30 day trial by clicking the link below.

About POWR Growth newsletter & 30 Day Trial

All the Best!

Jaimini Desai
Chief Growth Strategist, StockNews.com
Editor, POWR Growth Newsletter


MSFT shares were unchanged in after-hours trading Friday. Year-to-date, MSFT has declined -20.05%, versus a -17.26% rise in the benchmark S&P 500 index during the same period.


About the Author: Jaimini Desai

Jaimini Desai has been a financial writer and reporter for nearly a decade. His goal is to help readers identify risks and opportunities in the markets. He is the Chief Growth Strategist for StockNews.com and the editor of the POWR Growth and POWR Stocks Under $10 newsletters. Learn more about Jaimini’s background, along with links to his most recent articles.

More…

The post 3 Tech Stocks to Buy as Inflation Expectations Ease appeared first on StockNews.com

https://www.entrepreneur.com/article/430267


How To Find A Steel Stock That Is A Real Steal

Using The Power Of The POWR Stock Screener along with technical and volatility analysis to find a low risk trade with edge in ArcellorMittal (MT).

shutterstock.com – StockNews

One of my favorite tools in the POWR Stocks toolbox is the Stock Screener. It does much of the heavy lifting that is crucial in my daily trade selection and construction process. As an option trader and analyst, I look to combine the elements of fundamental, technical and volatility analysis along with the POWR Screener to try and identify trade ideas with a probabilistic edge.

A walk through of one of the most recent potential trade ideas will shed some light on how to better harness the power of the POWR Stock Ratings.

I set up the POWR Stock Screener to identify only A Rated – Strong Buy- stocks in A Rated -Strong Buy- industries. Additionally, the screen included just those stocks that carried a Value component grade of A. Finally, I wanted to see just those stocks trading below their 20-day moving average.

The thought process was to lower risk by focusing more on Value and stocks that haven’t rallied too hard given the recent pop in the overall market the past several days. Chasing performance is usually not a good idea, especially in this market environment.

This narrowed my list of potential trade candidates down to 18. Since we are looking for potential option trades, low-priced stocks aren’t nearly as viable for option strategies. $20 is the minimum level I would consider for a bona-fide beneficial option strategy versus buying the stock outright.

That left only six candidates. Five of those six really didn’t have enough option volume to justify trading options on that stock. Always important to consider liquidity in option trading. For example, Veritiv (VRTV) traded just 8 option contracts on Friday and had enormously wide bid-ask spreads.

That left us one potential candidate – our old friend ArcelorMittal (MT). The POWR Options Portfolio has traded MT options four times in the past with solid success.

After identifying this A Rated stock in an A rated industry with a Value Grade of A that is trading below the 20-day moving average, it is always a good idea to layer in some technical analysis.

MT stock is the most oversold it has been in the past two years. 9-day RSI went below 20 but has improved. MACD reached an extreme as well before turning higher. Bollinger Percent B printed negative then regained positive territory. Shares are trading at a massive discount to the 20-day moving average. There is looming support at $22.50.

Previous times all these indicators aligned in a similar fashion marked significant short-term lows in MT stock (highlighted in aqua). I also added in the prior four times the POWR Options Portfolio took a position in MT calls.

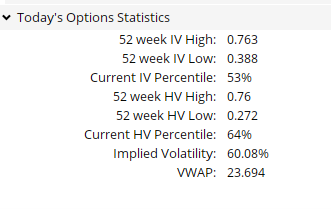
Interesting to note on the chart that Implied Volatility (IV) is now well below the highs over the past several months. This means option prices are comparatively less expensive, a good thing when looking to buy options.

IV stands at the 53rd percentile, meaning option prices are about average in price. They are cheap, however, when compared to the actual, or Historic Volatility (HV), at 64%.

It is useful to do some peer group analysis as well. The POWR Stock Industry Ratings are another very useful tool for traders and investors alike. The Steel Industry is ranked number 5 overall and is at the 96th percentile. MT stands near the top of the list at number 11.

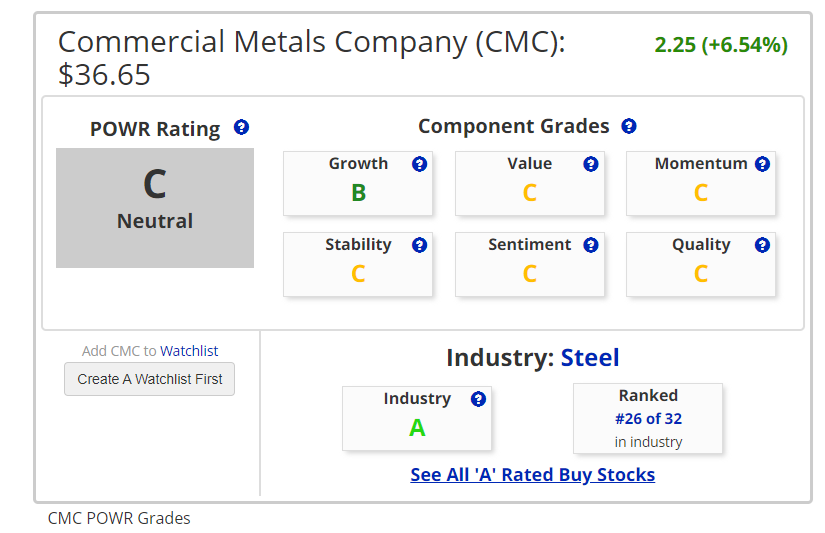
By comparison, Commercial Metals (CMC) is just a C Rated – Neutral -stock. It ranks near the low end at number 26 within steel stocks.

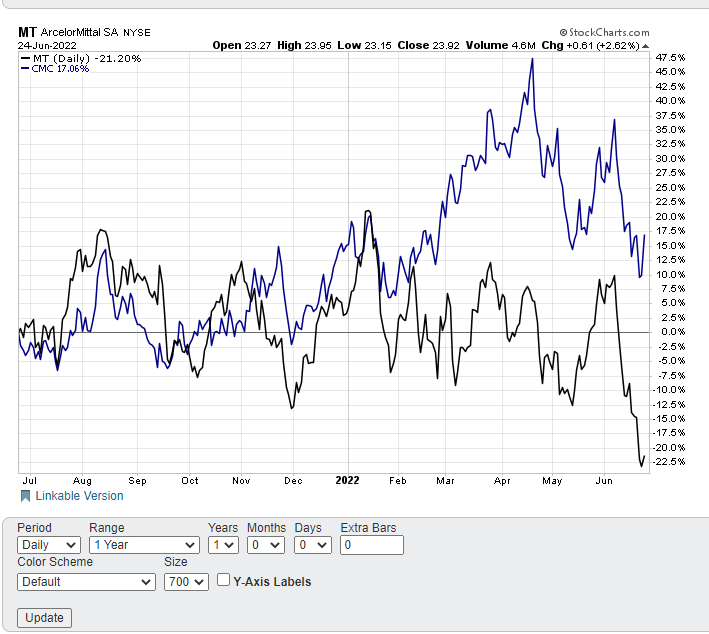
Yet CMC has been a big out-performer to MT over the past few months. Over the past year CMC is up 17% while MT is down just over 21%. Prior to February both stocks where highly correlated. Makes sense since they are both steel stocks. Since then, however, CMC has moved higher by about 5% while MT has fallen over 32%.

Look for this divergence to begin to converge with the Strong Buy MT being a relative out-performer to the Neutral CMC over the coming weeks. We very well may be adding some MT calls to the POWR Options Portfolio very soon.

Combining the POWR Stock Screener along with additional analysis can create a comprehensive trade identification system to help find the edge and put the odds in your favor. That’s what we look to do everyday with the POWR Options Portfolio. Remember, trading is about probability and not certainty.

POWR Options

What To Do Next?

If you’re looking for the best options trades for today’s market, you should check out our latest presentation How to Trade Options with the POWR Ratings. Here we show you how to consistently find the top options trades, while minimizing risk.

If that appeals to you, and you want to learn more about this powerful new options strategy, then click below to get access to this timely investment presentation now:

How to Trade Options with the POWR Ratings

All the Best!

Tim Biggam

Editor, POWR Options Newsletter


MT shares closed at $23.92 on Friday, up $0.61 (+2.62%). Year-to-date, MT has declined -23.94%, versus a -17.26% rise in the benchmark S&P 500 index during the same period.


About the Author: Tim Biggam

Tim spent 13 years as Chief Options Strategist at Man Securities in Chicago, 4 years as Lead Options Strategist at ThinkorSwim and 3 years as a Market Maker for First Options in Chicago. He makes regular appearances on Bloomberg TV and is a weekly contributor to the TD Ameritrade Network “Morning Trade Live”. His overriding passion is to make the complex world of options more understandable and therefore more useful to the everyday trader. Tim is the editor of the POWR Options newsletter. Learn more about Tim’s background, along with links to his most recent articles.

More…

The post How To Find A Steel Stock That Is A Real Steal appeared first on StockNews.com

https://www.entrepreneur.com/article/430261


Don’t Get Fooled by the Recent Market Rally

The S&P 500 (SPY) has bounced with gusto this week. Maybe the bear market is not here to stay? Ha! Don’t make me laugh. This is just one in a long line of “suckers rallies” before the next leg lower. The reasons why are spelled out below in this week’s market commentary.

shutterstock.com – StockNews

Please enjoy this updated version of my weekly commentary.

Earlier this week I presented my updated stock market (SPY) outlook and game plan for investors at the Financial Answers Wealth Summit.

This is the best way to get the full picture of why I am bearish…how low stocks will go…and how to tame the bear now…and how to prepare for the emergence of the next bull market.

Watch it here now >>

Reity, I appreciate your presentation. Great stuff. And damn you are handsome. But how do you explain the 250 point rally in the S&P this week?

Does a bull market go straight up?

Heck no. In fact, over the past 60 years, with the vast majority of that time being inside bull markets, stocks only had positive days 53.7% of the time. Yes, that means that 46.3% of the time the market ended lower on the day.

This also means there are weeks or even months that end firmly in the red even during the most glorious of times. Yet as we look back over months and years we appreciate how the positive days stack up more and more in our favor.

The same exact thing is true during the bear market…just the inverse. Meaning that there will be many positive days or even weeks during a bear market. Yet over time the downward trajectory is undeniable.

(Please read the above again so it sinks in).

In this specific case the bear market officially formed on Monday 6/13 when the S&P 500 (SPY) crossed below 3,855 into bear market territory (20%+ drop from all time highs of 4,818). This breakout was confirmed by not 1, not 2, but 8 closes below helping to etch the bear market in stone.

However, it is quite common to retest key resistance levels (in this case 3,855). That is as common as night following day in the investing world. And thus should be no surprise to anyone that we retested that level Friday. Even closing above for a day or two before getting back on the bear market trajectory to lower lows is not out of the ordinary.

Why should stocks head lower again?

Again, spelled it all out in this presentation: Watch it here now >>

Reity, but maybe you haven’t noticed the ferocity of this bounce. Like the 3% rally Friday that has stocks back ABOVE bear market territory. Doesn’t it make you question your bear market thesis…even a little???

As an investor it is wise to be open minded. To take in all new information as it rolls in and to appreciate how often you can be wrong in investing…that foreknowledge helps to mitigate risk in not leaning too far in one direction or the other.

So yes, I appreciate that I could be wrong. Bear markets are a much more difficult environment to work in than bull markets.

For instance during a bull market I will be 100% invested almost all the time as the landscape is so much easier to navigate and confidence levels in a positive outcome are high. But as you will note in POWR Value I am only 50% long.

This is a nod to the downside probabilities yet not so defensive as to miss out on some upside if the bull market does re-emerge.

In my Reitmeister Total Return service, where I am much more aggressive on market timing, there I am 70% short the stock market using a blend of 4 different inverse ETFs. Note that I am not 100% short. Meaning my level of confidence is not as high as I am during a long term bull market environment.

Putting it altogether, right now I believe we are maybe at half time of this game with another 15-20% downside to go. That will come with some nasty runs to lower lows followed by wicked bounces that look alluring only to head back lower again.

These are what we commonly call “suckers rallies” because they suck you in before spitting you out.

Since my S&P 500 (SPY) outlook presentation on Tuesday, the economic data has NOT gotten better. This includes the Chicago Fed National Activity index falling to an 8 month low of +0.01 versus +0.40 last month.

This is a very broad index of economic activity that basically is on the border of falling into negative territory after robust showings in the recent past. That is foreboding for what comes next in this report.

Then on Thursday the PMI Flash report tumbled from 53.6 to 51.2…well under expectations. And teetering on going negative under 50 after a glorious run of being at 55-60 for the better part of the last 18 months. Once again, directionally this points to a marked slowdown in economic activity.

Lastly, Consumer Sentiment on Friday tumbled to an all time low at 50. To be clear 100 is considered normal conditions.

As you would suspect rampant inflation is the culprit behind the unease with consumer as too much money is going into the gas pump and not a lot left over to buy other products & services which have also shown considerable price increases.

Consumer Sentiment = mood. And mood effects actions.

So what this tells us is that consumers are in a bad mood and will be spending less given their unease with the economic environment. Not helping matters is that wages have not kept up with inflation making them feel poorer at this time.

This is why high inflation and recession (and therefore bear markets) go together like peanut butter and jelly. And thus why I continue to have a bearish outlook at this time.

Closing Comments

Note there were many other outstanding presentations at the Financial Answers Wealth Summit this week. Be sure to check out the full line up of replays available for free here.

Wishing you a world of investment success!


Steve Reitmeister…but everyone calls me Reity (pronounced “Righty”)
CEO, StockNews.com
Editor, Reitmeister Total Return & POWR Value


SPY shares closed at $390.08 on Friday, up $12.02 (+3.18%). Year-to-date, SPY has declined -17.26%, versus a % rise in the benchmark S&P 500 index during the same period.


About the Author: Steve Reitmeister

Steve is better known to the StockNews audience as “Reity”. Not only is he the CEO of the firm, but he also shares his 40 years of investment experience in the Reitmeister Total Return portfolio. Learn more about Reity’s background, along with links to his most recent articles and stock picks.

More…

The post Don’t Get Fooled by the Recent Market Rally appeared first on StockNews.com

https://www.entrepreneur.com/article/430248


3 Beaten-Down Real Estate Stocks That Look Cheap

The real estate market is expected to see significant growth in the near term with technological advancements and organizations revamping their operations from offices. Given this scenario, we think beaten-down real estate stocks Jones Lang LaSalle (JLL), Comstock Holding Companies (CHCI), and Forestar Group (FOR), which currently look cheap, could be ideal buys now. Read below to find out more.

shutterstock.com – StockNews

The outbreak of the COVID-19 pandemic acted as a massive restraint for the real estate market, as the need for services offered by these establishments declined due to restrictive measures imposed by the government and the complete closure of commercial activities.

However, analysts are bullish on the industry’s long-term prospects. The global real estate market is expected to grow at a CAGR of 9.6% to reach $5.39 trillion in 2026.

With digitization stepping into the real estate industry, digital house hunting has gained traction with consumers purchasing or mortgaging homes through virtual capabilities like 3D tours and drone videos.

Additionally, the growing demand for single-family owned houses and organizations resuming operations with work from the office should bolster this industry’s growth.

Given the backdrop, beaten-down real estate stocks Jones Lang LaSalle Incorporated (JLL), Comstock Holding Companies, Inc. (CHCI), and Forestar Group Inc. (FOR) that currently seem to be trading at a discount, could be ideal buys now.

Jones Lang LaSalle Incorporated (JLL)

JLL, a professional services company, provides real estate and investment management services in the Americas, Europe, the Middle East, Africa, and the Asia Pacific.

JLL’s revenue increased 18.9% from the prior-year quarter to 4.80 billion in the fiscal quarter ended March 31, 2022.

Net income for the quarter came in at 145.60 million, reflecting an increase of 41.4% year-over-year, while its adjusted EBITDA stood at $273.60 million, up 43.9% from the prior-year quarter.

The company’s adjusted EPS was $3.47, up 65.2% from the prior-year quarter.

Analysts expect JLL’s EPS for the fiscal quarter ending June 2022 to come in at $4.44, indicating an increase of 5.7% year-over-year. Also, the company’s EPS is expected to grow 3.1% year-over-year to $20.08 in the current fiscal year.

It has an impressive earnings surprise history, as it topped Street EPS estimates in each of the trailing four quarters.

In terms of its forward non-GAAP P/E, JLL is currently trading at 7.76x, 74.1% lower than the industry average of 29.92x. Its trailing-12-month Price/Sales multiple of 0.67 is 87.5% lower than the industry average of 5.35.

JLL’s stock has slumped 42.2% year-to-date to close the last trading session at $155.76.

JLL’s strong fundamentals are reflected in its POWR Ratings. The stock has an overall B rating, translating to Buy in our proprietary ratings system.

The POWR Ratings are calculated by considering 118 different factors, with each factor weighted to an optimal degree.

JLL also has a B grade in Growth and Value. It is ranked #1 of 44 stocks in the Real Estate Services industry.

Beyond what is stated above, we’ve also rated JLL for Momentum, Stability, Sentiment, and Quality. Get all the JLL ratings here.

Comstock Holding Companies, Inc. (CHCI)

CHCI develops, operates, and manages mixed-use and transit-oriented properties primarily in the Washington, D.C. metropolitan area. The company also provides real estate development and management services.

On June 13, CHCI announced the completion of two significant transactions with CP Real Estate Services, LC; an entity owned by Christopher Clemente, Comstock’s CEO, that are expected to strengthen its balance sheet and position the company for future growth.

The first transaction involves the redemption of outstanding shares at a discount, while the second transaction represents the replacement and modification of the company’s asset management agreement.

CHCI’s revenue increased 27.6% year-over-year to $8.73 million in the fiscal first quarter of 2022. Its income from operations grew 208.1% from the year-ago value to $1.37 million, while its net income improved 416.4% year-over-year to $2.01 million.

The company’s net income per share increased 340% from its year-ago value to $0.22.

In terms of its trailing-12-month Price/Sales, CHCI is currently trading at 1.15x, 78.5% lower than the industry average of 5.35x. Its trailing-12-month EV/EBIT multiple of 8.13 is 80.8% lower than the industry average of 42.28.

The stock has slumped 5.2% year-to-date to close the last trading session at $4.60. However, it gained 12.3% over the past month.

CHCI’s sound fundamentals are reflected in its POWR Ratings. The stock has an overall rating of B, equating to Buy in our POWR Ratings system.

The company also has a B grade in Value, Momentum, Sentiment, and Quality. The stock is ranked #5 in the Real Estate Services industry. To get CHCI’s ratings for Stability and Growth, click here.

Forestar Group Inc. (FOR)

FOR operates as a residential lot development company in the United States. It acquires land, develops infrastructure for single-family residential communities, and sells its residential single-family finished lots to homebuilders.

For the fiscal quarter ended March 31, 2022, FOR’s revenues increased 46.8% year-over-year to $421.60 million. The net income attributable to FOR grew 68.3% from the year-ago value to $47.80 million.

Moreover, its net income per share was $0.96, up 62.7% from the prior-year quarter.

Street expects FOR’s revenue for the fiscal quarter ending June 2022 to improve 31.3% year-over-year to $410.93 million.

The consensus EPS estimate of $0.88 for the same quarter represents a 48% increase from the same period last year. FOR also beat the consensus EPS estimates in all the trailing four quarters.

In terms of its forward non-GAAP P/E, FOR is currently trading at 3.63x, 87.9% lower than the industry average of 29.92x. Its trailing-12-month EV/EBIT multiple of 5.62 is 86.7% lower than the industry average of 42.28.

The stock has slumped 38.1% year-to-date to close the last trading session at $13.46.

FOR has an overall rating of B, translating to Buy in our proprietary ratings system. The stock is rated A in Growth and Sentiment and a B in Value. In the same industry, it is ranked #4. Click here to see additional POWR Ratings for Quality, Momentum, and Stability for FOR.


JLL shares closed at $167.02 on Friday, up $11.26 (+7.23%). Year-to-date, JLL has declined -37.99%, versus a -22.73% rise in the benchmark S&P 500 index during the same period.


About the Author: Komal Bhattar

Komal’s passion for the stock market and financial analysis led her to pursue investment research as a career. Her fundamental approach to analyzing stocks helps investors identify the best investment opportunities.

More…

The post 3 Beaten-Down Real Estate Stocks That Look Cheap appeared first on StockNews.com

https://www.entrepreneur.com/article/429823