Swedish beverages company Oatly (OTLY) has declined more than 50% in price this year. Moreover, considering the company’s bleak bottom line and lean profit margins, is it be wise to buy the dip in OTLY now? Read on to find out.
shutterstock.com – StockNews
Swedish oat milk and beverages company Oatly Group AB (OTLY) provides plant-based dairy products made from oats.
It offers Barista edition oat milk, frozen desserts, ice creams, yogurts, ready-to-go drinks, and cooking products, including cooking cream, in regular and organic, Crème Fraiche, Whipping Cream, Vanilla Custard, and a variety of spreads.
OTLY has recently announced some earnest business initiatives to strengthen its logistics. On June 9, 2022, OTLY launched electric-powered, heavy-duty trucks for the company’s ground transportation in North America.
This strategy aims to expand the company’s business in America through improved sustainable transportation. In addition, on May 25, 2022, OTLY announced its “one-hour delivery‘ of oat milk, frozen non-dairy dessert pints, and novelties in Los Angeles and New York City.
Over the past month, OTLY has gained 3.9% to close yesterday’s trading session at $3.77. However, it has lost 86.3% over the past year and 52.6% year-to-date.
Here is what could shape OTLY’s performance in the near term:
Weak Financials
For the first quarter ended March 31, 2022, OTLY’s revenue came in at $166.19 million, up 18.7% year-over-year.
However, its gross profit came in at $15.85 million, down 62.2% year-over-year. Also, its loss for the period came in at $87.46 million, compared to a loss of $32.38 million in the year-ago period.
Its loss per share came in at $0.15, compared to a loss per share of $0.07 in the prior-year period. Moreover, its negative adjusted EBITDA increased 217.7% year-over-year to $71.39 million.
Stretched Valuations
In terms of its forwardEV/S, OTLY’s 2.41x is 38.1% higher than the industry average of 1.75x. Also, its forward P/S of 2.52x is 124% higher than the industry average of 1.13x.
Poor Profit Margins
OTLY’s trailing-twelve-month gross profit margin of 19.49% is 41.6% lower than the industry average of 33.39%.
Furthermore, its negative EBIT, EBITDA, and net income margins of 39.87%, 37.24%, and 39.96%, are significantly lower than the positive industry averages of 8.52%, 12.14%, and 5.13%, respectively.
POWR Ratings Reflect Bleak Prospects
OTLY has an overall rating of F, equating to Strong Sell in our proprietaryPOWR Ratings system.
The POWR Ratings are calculated by considering 118 different factors, with each factor weighted to an optimal degree.
OTLY has a Quality grade of F, consistent with its lower-than-industry profit margins.
The stock has a D grade for Stability, in sync with its 24-month beta of 1.68. Moreover, it has a D grade for Value and Growth, consistent with its stretched valuations and declining financials.
In the 35-stockBeverages industry, OTLY is ranked last. The industry is rated A.
Clickhere for the additional POWR Ratings for OTLY (Momentum and Sentiment).
View all the top stocks in the Beverages industryhere.
Bottom Line
Although the company’s recent operational developments helped register positive returns over the past month, its weak financials and stretched valuations are concerning.
Moreover, analysts expect OTLY’s EPS to decline 100% in the next quarter and 45.5% in the current year. Thus, I think OTLY is best avoided now.
How Does Oatly Group (OTLY) Stack Up Against its Peers?
While OTLY has an overall POWR Rating of F, one might consider looking at its industry peers, Coca-Cola Consolidated, Inc. (COKE), which has an overall A (Strong Buy) rating, and Primo Water Corporation (PRMW), Ambev S.A. (ABEV), and Carlsberg A/S (CABGY), which have an overall B (Buy) rating.
OTLY shares closed at $3.73 on Friday, down $-0.04 (-1.06%). Year-to-date, OTLY has declined -53.14%, versus a -22.73% rise in the benchmark S&P 500 index during the same period.
About the Author: Riddhima Chakraborty
Riddhima is a financial journalist with a passion for analyzing financial instruments. With a master’s degree in economics, she helps investors make informed investment decisions through her insightful commentaries.
Should You Add Datadog Stock to Your Growth Portfolio?
Datadog, Inc. (DDOG) is trading below its 52-week high despite its impressive first-quarter financials. With mixed profit margins and stretched valuation, is DDOG a valuable investment now? Read more to find out.
shutterstock.com – StockNews
With a $25.83 billion market cap, Datadog, Inc. (DDOG) provides a monitoring and analytics platform for developers, IT operations teams, and business users in the cloud internationally.
The company’s SaaS platform offers infrastructure monitoring, application performance monitoring, network performance monitoring, log management, cloud security, and incident management.
DDOG recently reported impressive fiscal 2022 first-quarter results. DDOG’s revenue increased 82.8% year-over-year to $363.03 million, while its non-GAAP gross margin rose 90.6% year-over-year to $291.74 million.
The company’s non-GAAP net income and non-GAAP net income per share came in at $83.84 million and $0.24, registering an increase of 316.1% and 300%, respectively, from the prior-year period.
However, the investors have been bearish about DDOG due to its sky-high valuations, and low stability (with a beta of 1.53), amid growing concerns about the Fed’s aggressive interest rate hikes and a possible recession.
The stock has plummeted 54% in price year-to-date to close yesterday’s trading session at $81.99. Also, it has declined 38% over the past three months and 50% over the past six months.
DDOG is currently trading 143.5% below its 52-week high of $199.68, which it hit on November 17, 2021.
Here’s what could shape DDOG’s performance in the near term:
Favorable Analyst Estimates
For the fiscal 2022 second quarter (ending June 2022), analysts expect DDOG’s EPS and revenue to grow 50% and 62.4% year-over-year to $0.15 and $379.27 million, respectively.
The company’s EPS and revenue for the fiscal year 2022 (ending December 2022) are expected to come in at $0.74 and $1.62 billion, representing a rise of 54.2% and 56.3%, respectively, from the previous year.
In addition, its EPS is expected to grow at 50.6% per annum over the next five years.
Mixed Profitability
DDOG’s trailing-12-month gross profit margin of 78.07% is 54.5% higher than the industry average of 50.53%. Its trailing-12-month levered FCF margin of 28.34% is 196.3% higher than industry averages of 9.56%.
However, DDOG’s trailing-12-monthEBITDA margin of 2.20% is 83.5% lower than the 13.35% industry average. And its trailing-12-month net income margin of 0.17% is 96.8% lower than the 5.34% industry average.
Its trailing-12-month ROE, ROTC, and ROA of 0.21%, 0.14%, and 0.08% compare with industry averages of 7.67%, 4.76%, and 3.01%, respectively. Moreover, its trailing-12-month asset turnover ratio of 0.53% is 16.5% lower than the industry average of 0.64%.
Stretched Valuation
In terms of forward non-GAAP P/E, DDOG is currently trading at 110.11x, 562.1% higher than the industry average of 16.63x. The stock’s forward EV/Sales multiple of 16.86 is 525.9% higher than the industry average of 2.69.
In addition, its forward EV/EBITDA and Price/Sales ratios of 95.71 and 15.96 compare with industry averages of 11.67 and 2.54, respectively.
Also, in terms of forward Price/Cash Flow, DDOG is currently trading at 65.86x, 326.7% higher than the industry average of 15.43x.
Consensus Rating and Price Target Indicate Potential Upside
Of the 21 Wall Street analysts that rated DDOG, 18 rated it Buy, while three rated it Hold. The 12-month median price target of $163.58 indicates a99.4% potential upside from yesterday’s closing price of $82.03.
The price targets range from a low of $125.00 to a high of $223.00.
POWR Ratings Depict Uncertainty
DDOG has an overall rating of C, which translates to Neutral in our proprietaryPOWR Ratings system. The POWR Ratings are calculated considering 118 distinct factors, with each factor weighted to an optimal degree.
DDOG has a B grade for Sentiment, consistent with its positive revenue and earnings growth estimates. However, DDOG has a D grade for Value, in sync with its higher-than-industry valuation ratios.
Beyond what I’ve stated above, view DDOG ratings for Growth, Stability, Momentum, and Qualityhere.
Bottom Line
Despite reporting promising latest quarterly results, shares of DDOG have been declining lately, owing to sky-high valuations and relatively low stability.
Moreover, the stock is currently trading below its 50-day and 200-day moving averages of $109.72 and $144.15, respectively, indicating a downtrend.
Due to the Fed’s hawkish tilt and an economic slowdown, the stock is expected to remain under pressure in the near term. Thus, investors should wait until the markets stabilize before investing in DDOG.
How Does Datadog (DDOG)Stack Up Against its Peers?
While DDOG has a C rating in our proprietary rating system, one might want to consider looking at its industry peers, Amdocs Ltd. (DOX), Software AG (STWRY), and Sapiens International Corporation N.V. (SPNS), which have an A (Strong Buy) rating.
DDOG shares closed at $85.63 on Friday, up $3.64 (+4.44%). Year-to-date, DDOG has declined -51.92%, versus a -22.73% rise in the benchmark S&P 500 index during the same period.
About the Author: Mangeet Kaur Bouns
Mangeet’s keen interest in the stock market led her to become an investment researcher and financial journalist. Using her fundamental approach to analyzing stocks, Mangeet’s looks to help retail investors understand the underlying factors before making investment decisions.
The main question of bull or bear market has been answered quite loudly this week. BEAR!!! That is because we have spent 5 straight sessions in bear market territory, with the S&P 500 (SPY) dropping below 3,855. Now more investors are getting the memo and running for the exits at the same time. This begets a slew of other questions which we will ask and answer in this week’s commentary. Read on below for more….
shutterstock.com – StockNews
Please enjoy this updated version of my weekly commentary.
Q: How long will this bear market last?
A: The average bear market in history has lasted for 13 months. That is measured from peak to valley. So in this case the peak of 4,818 was set on January 4, 2022. So if things went according to schedule we would say bottom is likely to be found around February 2023.
However the stock market rarely does anything according to schedule leading to the next question…
Q: Do you believe this bear market will be longer or shorter than the 13 month average?
A: I think it will be shorter because everything about the modern market works faster. Meaning that with so much computer based trading, volatility has increased with stocks rising and falling faster than ever before.
So quite possibly we find bottom faster this time around as well.
Q: Does that mean you expect stocks to fall less than the 34% average bear market decline because it will be a shorter time period?
A: Unfortunately not. I suspect we will wind up a bit closer to 40% decline given that the low rate TINA environment pushed stocks to higher than normal PE levels.
In fact many of the glamorous growth stocks of 2021 were seeing valuations not that far off the 1990’s tech bubble style levels. From that higher peak it will likely be a steeper than normal drop to find equilibrium.
Note that 3,180 represents a 34% decline from peak. And 2,891 is where we end up if 40% decline is in the cards.
Q: How should one interpret a positive day for stocks like today if we are in the midst of a bear market?
A: Consider this…does a bull market go straight up?
Of course not. There are extended bull runs followed by pullbacks and corrections. Yet as you look back over time the gains of the bull are undeniable.
Bear markets are no different. They don’t go straight down either. It is an ongoing process of bear runs to new lows followed by bounces and then another leg lower so on and so forth til bottom is found.
Now everything I said is my current guestimate with a wide range of potential outcomes. NOTHING about this bear, or any other, will go according to a preset pattern. That means we need to be flexible to adjust our plan according to the realities on the ground.
That includes when we start bottom fishing for the next bull run. We would rather be a touch early than a touch late.
That’s because on the late side there is usually a wicked 10-20% bounce from bottom that catches everyone by surprise.
So I suspect we will kind of work our way back to fully invested in 2-3 phases to never be leaning too far in the wrong direction when the market is finally ready to explode off the bottom.
Right now I imagine that first attempt at buying bottom would be around -30%…then down 34%…then hold on to that last part to see if indeed -40% is in the cards. However, at this stage we are getting WAY ahead of ourselves.
For now, there is likely a few months’ worth of bear market to come. Scary drops…shocking bounces (rinse and repeat).
However, since we are prepared, we can handle it in the best possible fashion to end the bear market in positive territory and then step on the gas with the start of the next bull.
Hang in there…I am with you every step of the way.
What To Do Next?
Right now there are 6 positions in my hand picked portfolio that will not only protect you from a forthcoming bear market, but also lead to ample gains as stocks head lower.
This strategy perfectly fits the mission of my Reitmeister Total Return service. That being to provide positive returns…even in the face of a roaring bear market.
Yes, it’s easy to make money when the bull market is in full swing. Anyone can do that.
Unfortunately most investors do not know how to generate gains as the market heads lower. So let me show you the way with 6 trades perfectly suited for today’s bear market conditions.
And then down the road we will take our profits on these positions and start bottom fishing for the best stocks to rally as the bull market makes its rightful return.
Come discover what my 40 years of investing experience can do you for you.
Plus get immediate access to my full portfolio of 6 timely trades that are primed to excel in this difficult market environment.
SPY shares closed at $365.86 on Friday, down $-0.79 (-0.22%). Year-to-date, SPY has declined -22.73%, versus a % rise in the benchmark S&P 500 index during the same period.
About the Author: Steve Reitmeister
Steve is better known to the StockNews audience as “Reity”. Not only is he the CEO of the firm, but he also shares his 40 years of investment experience in the Reitmeister Total Return portfolio. Learn more about Reity’s background, along with links to his most recent articles and stock picks.
Is WPP a Good Stock to Add to Your Dividend Portfolio?
Despite WPP plc’s (WPP) significant efforts to boost its operational performance, its shares are down 35.1% year-to-date. So, let’s evaluate if it is worth adding the stock to your dividend portfolio. Read on to learn more.
shutterstock.com – StockNews
London-based WPP plc (WPP) is a creative transformation company that delivers international communications, experience, commerce, and technology services. The company also advises customers who want to engage with various stakeholders, including consumers, governments, and the business and financial communities. WPP has a five-year average dividend yield of 4.71%. Its current dividend translates to a 4.3% yield. It has a payout ratio of 50.7%.
In April, WPP unveiled ‘Everymile,’ expanding its offering with a new fully managed service that would give businesses an outsourced direct-to-consumer (DTC) e-commerce solution. Everymile expands WPP’s current worldwide omnichannel commerce capabilities in strategy, customer experience, and technology development by adding demand creation, online trading and merchandising supply chain, and logistics. With the introduction of Everymile, WPP becomes the first firm in its category to provide an end-to-end e-commerce solution.
However, its stock is down 31.1% over the past year and 35.1% year-to-date to close yesterday’s trading session at $49.00. In addition, last month, analysts at Morgan Stanley downgraded the stock from an “equal weight” rating to an “underweight” rating.
Here’s what could shape WPP’s performance in the near term:
Mixed Profitability
WPP’s trailing-12-month gross profit margin of 17.2% is 66.1% lower than the industry average of 50.7%. Its trailing-12-month EBITDA margin and asset turnover ratio are 42.7% and 13.7% lower than their respective industry averages. However, its trailing-12-month ROC and ROA are 38.4% and 1.6% higher than their respective industry averages.
Discounted Valuation
In terms of forward EV/EBIT, the stock is currently trading at 7.02x, 50.9% lower than the industry average of 14.32x. Also, its forward non-GAAP P/E of 8.49x is 48.6% lower than the industry average of 16.49x. Moreover, WPP’s forward EV/Sales of 1.07x is 45.5% lower than the industry average of 1.96x.
POWR Ratings Reflect Uncertainty
WPP has an overall C rating, which equates to a Neutral in our proprietary POWR Ratings system. The POWR ratings are calculated considering 118 different factors, with each factor weighted to an optimal degree.
Our proprietary rating system also evaluates each stock based on eight different categories. WPP has a B grade for Value and a C for Quality. The company’s lower-than-industry valuation is in sync with the Value grade. In addition, its mixed profitability is consistent with the Quality grade.
Of the 21 stocks in the C-rated Advertising industry, WPP is ranked #7.
Beyond what I’ve stated above, you can view WPP ratings for Growth, Stability, Momentum, and Sentiment here.
Bottom Line
WPP’s continued efforts to boost its operational performance through various strategic partnerships should bode well for the stock in the long term. However, the stock is currently trading below its 50-day and 200-day moving averages of $59.81 and $68.92, respectively, indicating a downtrend. Moreover, analysts expect its EPS to decline at the rate of 3.7% per annum over the next five years. So, we think investors should wait before scooping up its shares.
How Does WPP Plc (WPP) Stack Up Against its Peers?
While WPP has an overall C rating, one might want to consider its industry peers, Cimpress PLC (CMPR), Criteo S.A. (CRTO), and Transcontinental Inc. (TCLAF), which has an overall B (Buy) rating.
WPP shares were trading at $49.47 per share on Friday afternoon, up $0.47 (+0.96%). Year-to-date, WPP has declined -33.05%, versus a -22.56% rise in the benchmark S&P 500 index during the same period.
About the Author: Pragya Pandey
Pragya is an equity research analyst and financial journalist with a passion for investing. In college she majored in finance and is currently pursuing the CFA program and is a Level II candidate.
3 Attractive ‘Growth at a Reasonable Price’ Stocks to Buy Now
GARP is a strategy to blend the best parts of value and growth investing. It’s particularly apt as it will allow investors to identify the top growth stocks trading at attractive valuations such as Cigna (CI), Freeport McMoran (FCX), and Micron (MU).
shutterstock.com – StockNews
2 of the most popular schools of investing are value investing and growth investing. Each school has its merits and drawbacks. And, each approach has generated life-changing wealth for successful adherents.
The major risk for value investors is that they are buying stocks that are cheap because the market is expecting a deterioration in the business’ earnings power often due to outside forces. A major example is Intel (INTC) which has posted impressive financials, yet its stock has underperformed as its chip technology fell behind competitors which indicates future weakness in revenue growth and pricing power.
And, we are living through a major risk for growth investors. Valuations can get so extreme that stocks can sustain heavy losses due to a slowdown in growth or change in economic or monetary conditions.
However, these challenging market environments can create opportunities to buy fantastic companies at bargain prices. Therefore, those who are looking to take advantage of this dislocation should consider growth at a reasonable price (GARP) stocks.
GARP is a strategy that blends growth and value investing and eliminates the worst aspect of each. The GARP approach can reduce the downside risks of growth investing by filtering out overvalued companies. Overvalued stocks are the most vulnerable to steep losses when market conditions turn sour or the company has a bad earnings report.
Here are 3 top GARP stocks that investors should consider.
CI is a multinational managed healthcare and insurance company with various subsidiaries that offer medical, dental, disability, life, and accident insurance. It also offers Medicare and Medicaid plans and products. The majority of its plans are offered through employers and large organizations. It operates through three segments—Evernorth, U.S. Medical and International Markets.
The rising cost of healthcare means that health insurers have also prospered. These stocks tend to outperform during periods of rising employment as this means more people will be enrolled in Cigna’s insurance plans. Thus, the company weakened as jobs were shed during the coronavirus crisis last year. However, it staged an impressive rebound as the economy has started to recover.
This is evident from its last earnings report which showed a 9% increase in revenue from last year to $41.7 billion, topping expectations. Net income increased 323% to $4.1 billion. As a result, analysts hiked their outlook for its full-year results. Currently, they are projecting EPS of $20.26 and revenue of $169 billion with both figures representing a 9% increase from 2020.
CI’s earnings reflect its above-average growth prospects. However, it has a price to earnings ratio of 11 which means it’s significantly cheaper than the S&P 500’s price to earnings ratio of 44.
The stock has an overall A rating, which equates to a Strong Buy in the POWR Ratings. A-rated stocks have posted an average annual performance of 30.7%. In terms of its components, CI has a B for Value. Even if looking at its forward price to earnings ratio of 11.4, it remains cheaper than the S&P 500 by more than 50%.
To see CI’s other component grades including Growth, Stability, Sentiment, Momentum, Quality, and Industry, please click here.
MU is a leading maker of DRAM and NAND memory chips. Memory chips are integral for all sorts of consumer tech like smartphones, PCs, cameras, and consoles. However, enterprise demand is exploding as they are also increasingly used in cars and data centers. Additionally, there is strong demand from futuristic tech like AI and autonomous driving which bodes well for the company’s growth prospects.
This dynamic is represented in Micron’s recent earnings report which showed a slowing in consumer tech but continued growth in enterprise spending. Over the next year, it’s forecasting DRAM demand to grow in the teens and NAND demand to grow by 30%.
Last quarter, MU’s data center business saw 60% revenue growth. MU’s automotive segment also offers growth upside, and it currently has 50% of the automotive memory market. Cars are increasingly becoming electronic, and many of these require memory.
In terms of value, MU also shines with a forward P/E of 5.9. The company also has above-average 29% profit margins which should persist given the company’s falling per-unit costs with increased production and strong demand, leading to pricing power.
MU has a B rating according to the POWR Ratings which translates to a Buy. B-rated stocks have posted an average annual performance of 21.1% which compares favorably to the S&P 500’s annual gain of 8.0%. MU is ranked #12 in the B-rated Semiconductor & Wireless Chip group out of #12. Click here to see the other top stocks in the sector and here to see MU’s complete POWR Ratings.
FCX is the world’s largest producer of copper with operations in North America, South America, Africa, and Asia. Overall, copper accounts for 75% of its total revenue. Therefore, it’s not surprising that the stock enjoyed spectacular gains as copper prices rose 65% over the last 2 years.
However, copper prices are down by nearly 30% due to the lockdowns in China and concerns that the global economy may be slowing, resulting in a 35% pullback for FCX between mid-April and mid-May. However, FCX remains quite profitable at these prices and attractive from a valuation basis.
The company has a P/E of 9.4 which is significantly cheaper than the market average despite having better growth and cash flow figures. It’s also returning cash to shareholders via its share buyback which equates to 10% of market cap. And, the company has strong, long-term growth prospects due to increasing electrification, EV adoption, and infrastructure spending.
Therefore, investors should look to buy the dip in FCX especially if the drop is due to the Fed’s focus on bringing down inflation. The POWR Ratings are also bullish on FCX as it’s rated a B which translates to a Buy.
In terms of component grades, FCX has a B for Quality due to being one of the largest and lowest-cost producers of copper. It also has a B for Growth due to its very low debt levels and strong cash flow. Click here to see FCX’s complete POWR Ratings.
Want more ideas like this?
The POWR Growth portfolio was launched in April last year and significantly outperformed the S&P 500 in 2021.
What is the secret to success?
The portfolio gets most of its fresh picks from the Top 10 Growth Stocks strategy which has stellar +46.42% annual returns.
If you would like to see the current portfolio of growth stocks, and be alerted to our next timely trades, then consider starting a 30 day trial by clicking the link below.
CI shares were trading at $243.51 per share on Friday afternoon, down $4.79 (-1.93%). Year-to-date, CI has gained 7.01%, versus a -22.52% rise in the benchmark S&P 500 index during the same period.
About the Author: Jaimini Desai
Jaimini Desai has been a financial writer and reporter for nearly a decade. His goal is to help readers identify risks and opportunities in the markets. He is the Chief Growth Strategist for StockNews.com and the editor of the POWR Growth and POWR Stocks Under $10 newsletters. Learn more about Jaimini’s background, along with links to his most recent articles.
With Oil Prices Surging, Is Nordic American Tankers a Buy?
Nordic American Tankers (NAT) anticipates increased demand for their Suezmax tankers in the coming days since OPEC and Saudi Arabia decided to expand oil output by more than the previously projected 400,000 barrels. However, considering its lack of profitability and low-profit margins, would it be worth buying the stock now? Let’s find out.
shutterstock.com – StockNews
Nordic American Tankers Limited (NAT) is a tanker firm that buys and charters double-hull tankers in Bermuda and across the world. It owns and operates 24 Suezmax crude oil tankers. Its shares have gained 18.9% year-to-date.
However, the stock is down 42.7% over the past year and 19.9% over the past month to close yesterday’s trading session at $2.01. Oil prices have soared back to levels seen during the early days of the Ukraine conflict, with little sight of major respite for drivers or companies in the near term. JPMorgan CEO Jamie Dimon believes oil prices will rise to $175 per barrel later this year.
NAT sold three of its 2002-built vessels in the first four months of 2022. While the firm has rebounded from its lows thanks to the current demand, its negative profit margins and widening loss could add to investors’ concerns.
Here’s what could shape NAT’s performance in the near term:
Inadequate Financials
NAT’s net voyage revenue declined 17.5% year-over-year to $15.52 million for the first quarter ended March 31, 2022. Its net operating loss surged 13.8% from the prior-year quarter to $20.92 million. The company’s net loss surged 7.8% from the year-ago value to $26.98 million. Its loss per share amounted to $0.14. In addition, its adjusted EBITDA came in at a negative $7.72 million, representing a year-over-year increase of 505.4%.
Negative Profit Margins
NAT’s trailing-12-month asset turnover ratio of 0.21% is 60.2% lower than the industry average of 0.53%. Also, its trailing-12-month ROA, ROC, and net income margin are negative 20.9%, 6.5%, and 92.3%, respectively. Moreover, its trailing-12-month gross profit margin stood at a negative 4.46% compared to its industry average of 39.5%.
Premium Valuation
In terms of forward Price/Cash Flow, the stock is currently trading at 19.50x, 309.9% higher than the industry average of 4.76x. Also, its forward EV/Sales of 4.94x is 133.3% higher than the industry average of 2.12x.
POWR Ratings Reflect Bleak Outlook
NAT has an overall F rating, which equates to a Strong Sell in our proprietaryPOWR Ratings system. The POWR ratings are calculated considering 118 different factors, with each factor weighted to an optimal degree.
Our proprietary rating system also evaluates each stock based on eight different categories. NAT has an F for Value and a D for Growth and Quality. The stock’s higher-than-valuations are in sync with the Value grade. In addition, the company’s poor financials and profitability are consistent with the Growth and Quality grades.
Of the 45 stocks in the A-ratedShipping industry, NAT is ranked last.
Beyond what I’ve stated above, you can view NAT ratings for Stability, Momentum, and Sentimenthere.
Bottom Line
Analysts expect NAT’s EPS to remain negative in the current year. Moreover, the stock is currently trading below its 50-day and 200-day moving averages of $2.46 and $2.14, respectively, indicating bearish sentiment. So, we think the stock is best avoided now.
How Does Nordic American Tankers Limited (NAT) Stack Up Against its Peers?
While NAT has an overall F rating, one might want to consider its industry peers, Overseas Shipholding Group Inc. (OSG), Matson Inc. (MATX), and Grindrod Shipping Holdings Ltd. (GRIN), which have an overall A (Strong Buy) rating.
NAT shares were trading at $2.01 per share on Wednesday morning, down $0.00 (0.00%). Year-to-date, NAT has gained 20.65%, versus a -20.05% rise in the benchmark S&P 500 index during the same period.
About the Author: Pragya Pandey
Pragya is an equity research analyst and financial journalist with a passion for investing. In college she majored in finance and is currently pursuing the CFA program and is a Level II candidate.
Valuations, Technicals and Sentiment all point to higher prices as WMT finally finds some footing.
shutterstock.com – StockNews
Stocks had a very ugly day on Friday. All the major indices (SPY, DIA, IWM) were down well over 2% on the day as stagflation once again came to the forefront. Gas prices over $5.00 per gallon and rising food prices are putting a crimp in the consumer.
Yet there were still a few stocks that showed glimmers of green during the market massacre. One was the previously punished and pummeled Walmart (WMT).
Most investors are aware of the recent troubles from both Walmart and Target (TGT). Earnings were dramatically affected by rising fuel and labor costs along with an inventory build. While the company lowered profit expectations it actually raised the sales outlook. Still, WMT stock paid the price and dropped over 20%.
Shares, however, are looking decidedly more attractive at $120 versus $150. Here’s three reasons why the worst is likely over for WMT stock.
Valuations
Walmart is a Buy rated stock in the POWR Ratings. It is also in the Strong Buy rated Grocery/Big Box Retailers Industry, ranking number 14 out of 37. Current Price/Sales stands at a three year low of just 0.58. While the latest earnings were a disaster, the market reaction is likely getting overdone.
WMT now trades at well under a 20x P/E on a 2023 forward basis. The dividend yield is a respectable 1.84% with a payout ratio under 50%. This is just the kind of stock that will be a safe haven for investors and fund managers to gravitate towards in this market environment. Maybe that’s why the average analyst price target is still a rather robust $157 per share.
Technicals
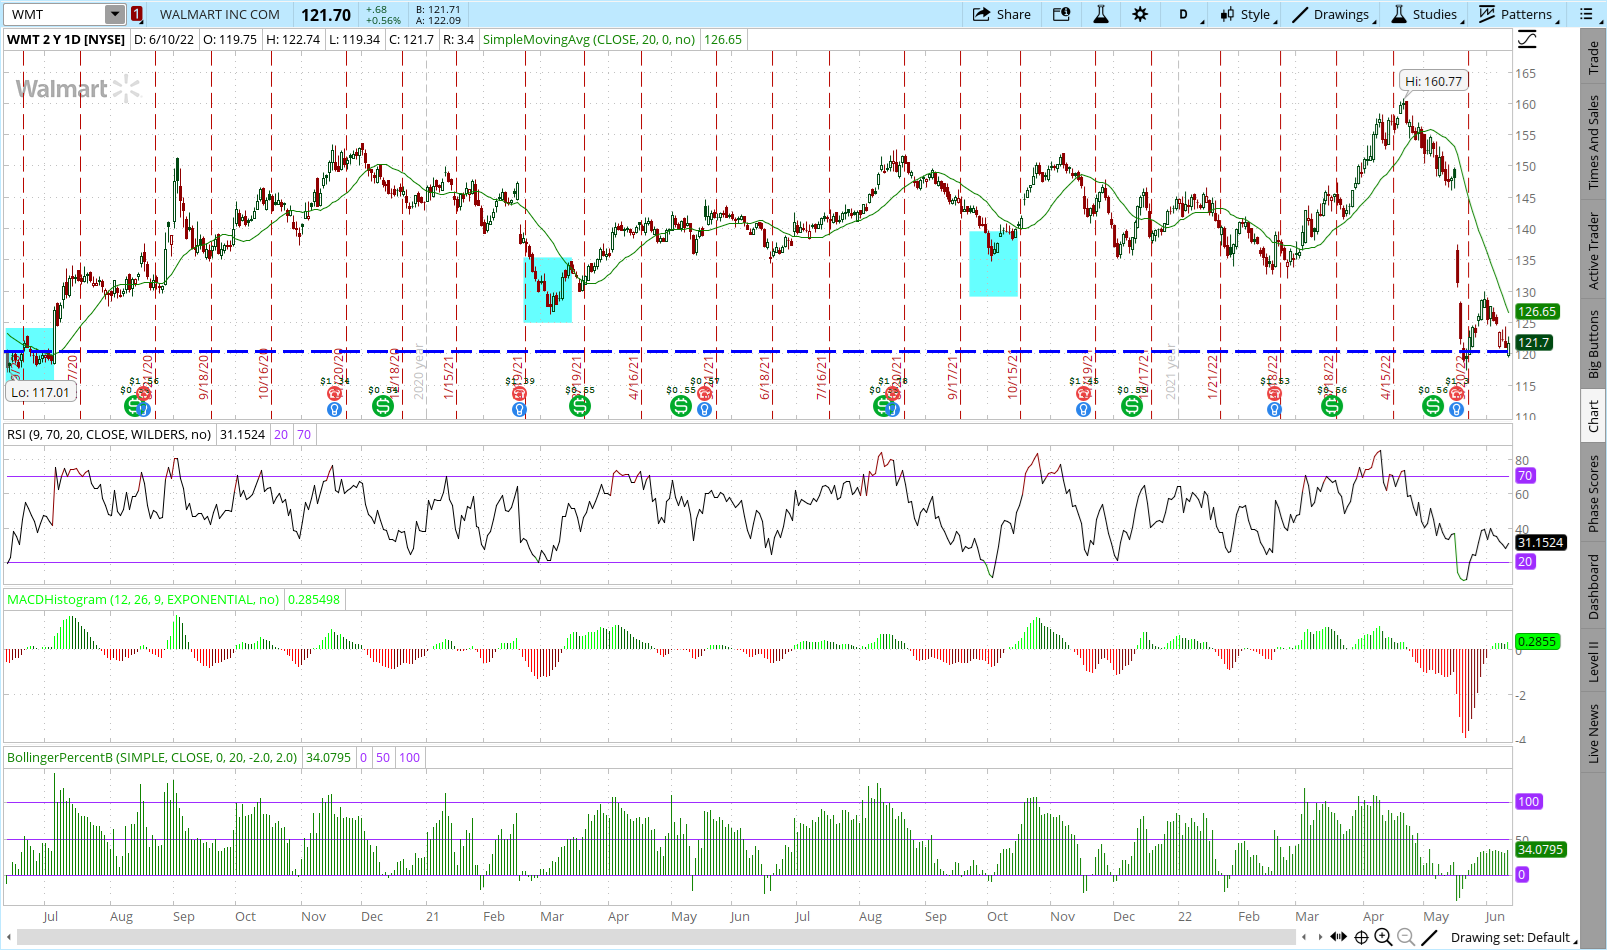
WMT stock reached extremely oversold readings following the earnings torpedo before finding their footing. 9-day RSI printed at a two-year low before strengthening. MACD also reached an extreme then turned higher. Bollinger Percent B got to deeply negative territory but is now solidly positive. Previous times all these indicators aligned in a similar fashion marked significant lows in Walmart stock.
As mentioned, Walmart was one of the few stocks that actually rose on Friday. WMT stock added on 0.56% compared to a nearly 3% loss for the S&P 500. Shares once again bounced off the major support area near $120. WMT initially opened lower and near the lows of the day only to pivot and closer higher and near the highs of the day.
This type of reversal pattern is many times a sign of that the previous trend has come to an end. The sellers may finally be exhausted, and the buyers have taken control. It is an even more powerful signal given that it took place at a major support area.
Sentiment
Walmart is normally viewed in favorable light during stressful economic times. Real wages have fallen nearly 3% from a year ago due to red-hot inflation. Households still must put food on the table and diapers on the babies but are now much more price sensitive. This favors the lower-priced retailers like Walmart.
WMT stock is a solid defensive stock that normally out-performs during bear markets. Now that the earnings cloud is beginning to lift a little, look for a beaten and battered Walmart to be a relative out-performer to the overall market over the coming weeks.
The POWR Options Portfolio took a bullish call position in the August $125 calls on May 23 following earnings. We exited the trade on June 6 for an overall net gain of 27% as Walmart shares stalled near the $130 level. The portfolio may very well look to re-enter a new bullish call trade now that WMT once again held support.
POWR Options
What To Do Next?
If you’re looking for the best options trades for today’s market, you should check out our latest presentation How to Trade Options with the POWR Ratings. Here we show you how to consistently find the top options trades, while minimizing risk.
If that appeals to you, and you want to learn more about this powerful new options strategy, then click below to get access to this timely investment presentation now:
WMT shares closed at $121.70 on Friday, up $0.68 (+0.56%). Year-to-date, WMT has declined -15.26%, versus a -17.67% rise in the benchmark S&P 500 index during the same period.
About the Author: Tim Biggam
Tim spent 13 years as Chief Options Strategist at Man Securities in Chicago, 4 years as Lead Options Strategist at ThinkorSwim and 3 years as a Market Maker for First Options in Chicago. He makes regular appearances on Bloomberg TV and is a weekly contributor to the TD Ameritrade Network “Morning Trade Live”. His overriding passion is to make the complex world of options more understandable and therefore more useful to the everyday trader. Tim is the editor of the POWR Options newsletter. Learn more about Tim’s background, along with links to his most recent articles.
The trucking industry is expected to rebound soon, given the solid consumer and freight transportation demand. Thus, buying shares of Schneider National (SNDR), USA Truck (USAK), ArcBest Corporation (ARCB), P.A.M. Transportation Services (PTSI) and Daseke (DSKE) at a bargain price could be profitable.
shutterstock.com – StockNews
Due to supply chain disruptions and rising input material costs, the trucking industry has been under operational headwinds. In addition, as oil pricesclimbed to 13 week-highrecently, profit margins of trucking companies have been shrinking tremendously.
However, the rising need for logistics companies to automate operations and foster the flow of goods in an efficient manner could drive the industry’s growth. Moreover, trucking companies are taking active steps to optimize their warehouse logistics and transportation amid the continued global supply chain disruptions. Also, advanced technologies such as driverless vehicles, robotics, de-carbonization of transportation, autonomous control, and wearable computing are expected to drive the demand of the truck industry.
Trucking stocks, Schneider National, Inc. (SNDR), USA Truck, Inc. (USAK), ArcBest Corporation (ARCB), P.A.M. Transportation Services, Inc. (PTSI), and Daseke, Inc. (DSKE) are currently trading at a discount to their peers. Thus, these stocks could be ideal additions to your portfolio now.
SNDR provides surface transportation and logistics solutions in the U.S., Canada, and Mexico. The company operates in three segments: Truckload; Intermodal; and Logistics. SNDR offers long-haul and regional shipping services, door-to-door container on flat car services, freight brokerage, and import/ export services.
On June 7, SNDR acquired Wisconsin-based carrier deBoer Transportation. With this acquisition, the company should be able to expand its business and boost earnings.
On April 6, the company marked its fifth year since the IPO as it significantly expanded its footprint and achieved meaningful progress over the years. With solid first-quarter results, its growth is only expected to drive SNDR forward.
SNDR’s operating revenue increased 32% year-over-year to $1.62 billion in the fiscal first quarter (ended March 31). The company’s income from operations increased 77% from the year-ago value to $135.10 million. Its adjustednet income grew 86% from the year-ago value to $102.10 million, while its EPS increased 84% from the year-ago value to $0.57.
SNDR is relatively undervalued compared to its peers. In terms of forward non-GAAP P/E, SNDR is currently trading at 8.56x, 46.9% lower than the industry average of 16.69x. Its forward EV/Sales multiple of 0.61 is 62.8% lower than the industry average of 1.65x.
The consensus EPS estimate of $0.68 for its fiscal second quarter (ending June 2022) represents a 13.5% improvement year-over-year. The consensus revenue estimate of $1.66 billion for the current quarter indicates a 22.2% increase from the same period last year. The company has an excellent earnings surprise history; it surpassed the consensus EPS estimates in each of the trailing four quarters. Over the past nine months, the stock has gained 4.9% to close its last trading day at $23.36.
SNDR’s POWR Ratings reflect this promising outlook. The company has an overall B rating, which translates to Buy in our proprietary rating system. ThePOWR Ratings assess stocks by 118 distinct factors, each with its own weighting.
It has a B grade for Value and Momentum. Among the 22 stocks in the A-ratedTrucking Freight industry, it is ranked #7.Click here to see the POWR ratings of SNDR for Growth, Stability, Sentiment, and Quality.
USAK provides comprehensive capacity solutions to a broad and diverse customer base throughout North America. The company operates in two segments: Trucking; and USAT Logistics. Its Trucking segment offers motor carrier services and freight services, while the USAT Logistics segment provides freight brokerage, logistics, and intermodal rail services.
On May 11, USAK was named National Truckload Carrier of the Year at Transplace’s 2022 Carrier Symposium. This reflects the company’s excellent customer experience to Transplace.
In the fiscal 2022 first quarter (ended March 31, 2022), USAK’s operating revenues increased 26.8% year-over-year to $201.06 million. Its operating income increased 19.6% from the year-ago value to $182.38 million, while its net income grew 264.5% year-over-year to $13.11 million. The company’s EPS came in at $1.45, representing a 262.5% year-over-year improvement.
USAK is trading at a discount to its peers. The stock’s forward non-GAAP P/E multiple of 3.55 is 78.8% lower than the industry average of 16.69. In addition, USAK’s forward EV/EBIT and EV/EBITDA ratios of 4.53 and 3.98 are significantly lower than the industry averages of 14.65 and 12.63, respectively.
Analysts expect USAK’s EPS and revenue to increase 132% and 26.9% year-over-year to $1.16 and $215.70 million, respectively, in the fiscal second quarter (ending June 2022). USAK has surpassed the consensus EPS estimates in each of the trailing four quarters, which is impressive. USAK has gained 15.4% over the past nine months.
USAK’s strong fundamentals are reflected in its POWR Ratings. The stock has an overall rating of A, which equates to a Strong Buy in our POWR Ratings system. USAK also has an A grade for Growth, Value, and a B grade for Momentum and Sentiment. The stock is ranked #2 of 22 stocks in the same industry.Click here to see the ratings of USAK for Stability and Quality.
ARCB is a freight transportation and logistics company. The company operates through three segments: Asset-Based; ArcBest; and FleetNet. ARCB provides transportation services for general commodities, motor carrier transportation services to customers in Mexico, and expedited freight transportation services to commercial and government customers.
On May 18, the company announced that five of its ABF Freight service centers received the President’s Quality Award. In the same month, ARCB’s LTL carrier was also recognized with Excellence in Cargo Claims and Loss Prevention Award by ATA for the ninth time. Such recognition reflects the company’s outstanding performance in the industry.
On April 28, ARCB’s Board of Directors increased the company’s quarterly cash dividend by 50% to $0.12 per share and also increased its share repurchase program to $75 million. This reflects the company’s strong cash flows and should accelerate shareholders’ returns.
ARCB’s net revenues increased 61% year-over-year to $1.34 billion in the first quarter ended March 31, 2022. The company’s operating income increased 194.9% from the year-ago value to $94.93 million, while its net income grew 197.8% year-over-year to $69.57 billion. ARCB’s EPS rose 208% from the prior-year quarter to $2.68.
ARCB is relatively undervalued compared to its peers. The stock’s forward Price/Sales multiple of 0.36 is 73.9% lower than the industry average of 1.36. In addition, its forward EV/EBITDA ratio of 3.67 is 65.1% lower than the industry average of 10.53.
For the fiscal second quarter (ending June 2022), ARCB’s revenue is expected to increase 44% year-over-year to $1.37 billion, respectively. Its EPS is expected to increase 99% to $3.92 in the ongoing quarter. The stock surpassed the consensus EPS estimates in each of the trailing four quarters, which is excellent. ARCB has gained 28.8% over the past year to close yesterday’s trading session at $78.61.
The company has an overall rating of B, which translates to Buy in our proprietary rating system. It is no surprise that ARCB has an A grade for Growth and a B grade for Value and Momentum. In the same A-rated industry, it is ranked #4 of 22 stocks.
Beyond what we’ve stated above, we have also given ARCB grades for Stability, Sentiment, and Quality. Get all the ARCB ratingshere.
PTSI is a truckload transportation and logistics company. It operates as a truckload dry van carrier, transporting general commodities, including automotive parts; expedited goods; consumer goods; and manufactured goods. Its operations are classified into truckload services or brokerage and logistics services.
During the fiscal first quarter (ended March 31, 2022), PTSI’s total revenue increased 47.4% year-over-year to $219.45 million. Its operating income rose 129.6% from the year-ago value to $31.34 million. Net income grew 121.5% from the same period last year to $23.47 million, while its non-GAAP EPS came in at $1.18, representing a 126.9% increase year-over-year.
PTSI is relatively undervalued compared to its peers. In terms of forward non-GAAP P/E, PTSI is currently trading at 6.31x, 62.2% lower than the industry average of 16.69x. Its forward Price/Sales multiple of 0.71 is 47.9% lower than the industry average of 1.36x.
Analysts expect PTSI’s revenues to increase 26.1% year-over-year to $891.30 million in fiscal 2022 (ending December 2022). Its EPS is expected to increase 27.7% year-over-year to $4.50 in the current year. Over the past year, the stock has gained 102.8% to close the last trading session at $28.69.
PTSI’s strong fundamentals are reflected in its POWR Ratings. The stock has an overall rating of A, which equates to a Strong Buy in our POWR Ratings system. PTSI also has an A grade for Sentiment and a B grade for Growth, Value, Momentum, and Quality. The stock is ranked #1 of 22 stocks in the A-rated Trucking Freight industry.Click here to see the ratings of PTSI for Stability.
DSKE provides transportation and logistics solutions focused on flatbed and specialized freight in the United States, Canada, and Mexico. The Company operates through two segments: Flatbed Solutions and Specialized Solutions. It also provides logistical planning and warehousing services to customers and operates a fleet of more than 4,500 tractors and 11,000 flatbed and specialized trailers.
In the first quarter ended March 31, 2022, DSKE’s total revenue increased 26.1% year-over-year to $421 billion. Its net income improved 278.1% from the year-ago value to $13 million, while its EPS came in at $0.18, representing a 238.5% year-over-year improvement.
DSKE is trading at a discount to its peers. The stock’s forward EV/Sales multiple of 0.65 is 60.3% lower than the industry average of 1.65. In addition, DSKE’s forward EV/EBIT and EV/EBITDA ratios of 8.50 and 4.52 are significantly lower than the industry averages of 14.65 and 10.53, respectively.
The consensus EPS estimate of $0.36 for the fiscal third quarter (ending September 2022) represents a 20% improvement year-over-year. The consensus revenue estimate of $428.09 million for the present quarter represents a marginal increase from the same period last year. DSKE surpassed the EPS estimates in three of the trailing four quarters, which is impressive. Over the past year, the stock has gained marginally, closing yesterday’s trading session at $7.64.
DSKE has an overall B rating, which translates to Buy in our proprietary rating system. It also has a B grade for Value and Momentum. The stock is ranked #5 of 22 stocks in the same industry. To see the other ratings of DSKE for Growth, Stability, Sentiment, and Quality,click here.
SNDR shares closed at $23.15 on Friday, down $-0.21 (-0.90%). Year-to-date, SNDR has declined -13.41%, versus a -17.67% rise in the benchmark S&P 500 index during the same period.
About the Author: Shweta Kumari
Shweta’s profound interest in financial research and quantitative analysis led her to pursue a career as an investment analyst. She uses her knowledge to help retail investors make educated investment decisions.
Given the rising prices and the possibility of a recession, consumers are rushing to discount stores or off-price retailers to buy general merchandise at lower prices. This rising foot traffic and enhanced product and service offerings should benefit prominent off-price retailers TJX (TJX) and Target (TGT). But which of these stocks is a better buy now? Read more to find out.
shutterstock.com – StockNews
The TJX Companies, Inc. (TJX) and Target Corporation (TGT) are two prominent retailers in the U.S. TJX operates as an off-price and home fashions retailer that sells family and home fashions, fine jewelry, accessories, and other merchandise worldwide. It operates through Marmaxx; HomeGoods; TJX Canada; and TJX International. TGT is a discount store retailer that offers general merchandise, including food assortments, apparel, accessories, home decor products, electronics, seasonal offerings, and beauty and household essentials through its stores and digital channels.
Amidhigh inflation and the possibility of a recession, consumers are rushing to discount stores or off-price retailers that offer merchandise at relatively lower prices. The growing foot traffic at physical stores, strong online presence, and delivery services should help off-price retailers generate solid revenues. The global off-price retail market is expected to grow at an8.2% CAGR to $474.77 billion by 2028. Therefore, both TJX and TGT should benefit.
TJX is a winner with 2.6% gains over the past week versus TGT’s 31.1% loss. But which of these stocks is a better pick now? Let’s find out.
Recent Financial Results
TJX’s net sales for fiscal 2023 first quarter ended April 30, 2022, increased 13.1% year-over-year to $11.41 billion. The company’s pre-tax income came in at $852.28 million, indicating an 18.2% year-over-year improvement. While its net income increased 10% year-over-year to $587.47 million, its EPS grew 11.4% to $0.49. As of April 30, 2022, the company had $4.30 billion in cash and equivalents.
For the fiscal 2022 first quarter ended April 30, 2022, TGT’s total revenue increased 4% year-over-year to $25.17 billion. The company’s operating income came in at $1.35 billion, representing a 43.3% decline from the prior-year period. Its net earnings came in at $1.01 billion, down 51.9% from the year-ago period. TGT’s adjusted EPS came in at $2.19, indicating a 40.7% year-over-year decline. As of April 30, 2022, the company had $1.11 billion in cash and cash equivalents.
Past and Expected Financial Performance
Over the past three years, TJX’s tangible book value has increased at a CAGR of 3%. TJX’s EPS is expected to increase 11.9% year-over-year in fiscal 2023, ending January 31, 2023, and 13.5% in fiscal 2024. Its revenue is expected to grow 6.7% in fiscal 2023 and 6% in fiscal 2024. Analysts expect the company’s EPS to rise at a 12.8% rate per annum over the next five years.
Over the past three years, TGT’s tangible book value has declined at a CAGR of 1%. Analysts expect TGT’s EPS to decline 34% year-over-year in fiscal 2022, ending January 31, 2023, and rise 39.2% in fiscal 2023. Its revenue is expected to grow 4% year-over-year in fiscal 2022 and 4.2% in fiscal 2023. Analysts expect the company’s EPS to grow at a 19.6% rate per annum over the next five years.
Valuation
In terms of non-GAAP P/E, TJX is currently trading at 19.24x, 5.4% higher than TGT’s 18.26x. In terms of forward EV/Sales, TGT’s 0.81x compares with TJX’s 1.55x.
Profitability
TGT’s trailing-12-month revenue is 2.2 times TJX’s. However, TJX is more profitable, with an 11.5%EBITDA margin versus TGT’s 10%.
Furthermore, TJX’s ROE, ROA, and ROTC of 56.9%, 10.4%, and 15.4% compare with TGT’s 45.5%, 9.9%, and 17.2%, respectively.
POWR Ratings
While TJX has an overall B grade, which translates to Buy in our proprietaryPOWR Ratings system, TGT has an overall C grade, equating to Neutral. The POWR Ratings are calculated by considering 118 distinct factors, each weighted to an optimal degree.
Both TJX and TGT have been graded a B for Quality, consistent with their higher-than-industry profitability ratios. TJX’s 56.9% trailing-12-month ROE is 234.1% higher than the 17% industry average. TGT’s 45.5% trailing-12-month ROE is 167.5% lower than the 17% industry average.
TJX has been graded a B in terms of Sentiment, which is in sync with expected earnings growth. TJX’s EPS is expected to grow 11.9% year-over-year to $3.19 for fiscal 2023 ending January 31, 2023. TGT’s D grade for Sentiment reflects its weak EPS estimated by analysts. The consensus EPS estimate of $8.95 billion for TGT’s fiscal 2022 ending January 31, 2023, represents a 34% decline from the prior-year period.
Of the 68 stocks in the B-ratedFashion & Luxury industry, TJX is ranked #21. In contrast, TGT is ranked #31 of 37 stocks in the A-ratedGrocery/Big Box Retailers industry.
Beyond what we have stated above, our POWR Ratings system has graded TJX and TGT for Growth, Momentum, Stability, and Value. Get all TJX ratingshere. Also,click here to see the additional POWR Ratings for TGT.
The Winner
Rising foot traffic at off-price and discount stores should benefit both TJX and TGT amid the high inflation. However, higher profitability makes TJX a better buy here.
Our research shows that the odds of success increase if one invests in stocks with an Overall POWR Rating of Buy or Strong Buy.Click here to access the top-rated stocks in the Fashion & Luxury industry, andhere for those in the Grocery/Big Box Retailers industry.
TJX shares closed at $58.97 on Friday, down $-1.68 (-2.77%). Year-to-date, TJX has declined -21.63%, versus a -17.67% rise in the benchmark S&P 500 index during the same period.
About the Author: Sweta Vijayan
Sweta is an investment analyst and journalist with a special interest in finding market inefficiencies. She’s passionate about educating investors, so that they may find success in the stock market.
Solid Power (SLDP) made its stock market debut in December of 2021 as the only publicly traded pure-play solid-state battery manufacturer for electric vehicles. However, the stock has declined more than 45% since due to its bleak financials amid an extended market correction. Given the rising demand for EVs worldwide, will SLDP be able to rebound soon? Read more below….
shutterstock.com – StockNews
Solid Power, Inc. (SLDP) is a pure-play solid-state battery cell manufacturer. The company’s products have applications in electric vehicles. It went public through a reverse merger with blank check company Decarbonization Plus Acquisition Corporation III on December 9, 2021, raising $542.90 million in gross proceeds. As of December 9, 2021, SLDP is the only pure-play solid-state battery company to trade on the public markets.
Regarding this, SLDP Co-founder and CEO Doug Campbell said, “Solid Power has spent the last ten years developing all-solid-state battery technology that is designed to deliver the increased performance demanded by both automakers and consumers. We are excited to have completed our business combination with DCRC and we are looking forward to our future as the only pure-play solid-state company trading on the public markets.”
However, the company stated in apress release that its capital-light business model through vehicle integration is expected to occur in 2026. Shares of SLDP have slumped 45.8% since their Nasdaq listing. In addition, the stock plummeted 19.3% year-to-date and 8.3% over the past five days. The SLDP’s bleak financials and growth prospects and pessimistic broader market sentiment caused the stock to lose momentum since its public debut.
Here’s what could shape SLDP’s performance in the near term:
Bleak Financials
SLDP’s revenues increased 357.5% year-over-year to $2.20 million in the fiscal first quarter ended March 31, 2022. However, the company’s total operating expenses increased 183% from the same period last year to $13.50 million. Consequently, the operating loss widened 163.5% from the prior-year quarter to $11.31 million. Pre-tax loss worsened 44.1% from the year-ago value to $10.37 million, while net loss widened 44.9% year-over-year to $10.34 million. Loss per share stood at $0.06.
In addition, net cash and cash equivalents used by operating activities increased 294.4% from the same period last year to $14.37 million. Cash and cash equivalents balance stood at $450.41 million as of March 31, 2022, compared to the $513.45 million balance as of December 31, 2021.
Premium Valuation
SLDP’s trailing-12-month P/E multiple of 112.63 is 777.4% higher than the industry average of 12.84. In addition, the stock’s forward EV/Sales multiple of 173.94 is significantly higher than the industry average of 1.11.
Its trailing-12-month Price/Book ratio of 2.36 is 7.2% higher than the industry average of 2.20. Moreover, SLDP is currently trading 299.68 times its forward Sales, 31,298.2% higher than the industry average of 0.95.
POWR Ratings Reflect Bleak Prospects
SLDP has an overall rating of D, which translates to Sell in our proprietaryPOWR Ratings system. The POWR Ratings are calculated considering 118 distinct factors, with each factor weighted to an optimal degree.
SLDP has a grade of D for Value and Quality. The stock’s stretched valuation compared to its peers justifies the Quality grade. In addition, the company’s trailing-12-monthgross profit margin and ROTC are negative 3.64% and 7.4%, respectively, in sync with the Quality grade.
Beyond what I’ve stated above, view SLDP ratings for Growth, Momentum, Sentiment, and Stabilityhere.
Bottom Line
SLDP is an industry-leading developer of solid-state battery cells for EVs. However, given the global supply chain constraints and lithium supply shortage, SLDP’s operating expenses have increased substantially. As the adverse macroeconomic conditions persist, the company is expected to face severe production and cost headwinds in the near term. Thus, the stock is best avoided now.
How Does Solid Power (SLDP) Stack Up Against its Peers?
While SLDP has a D rating in our proprietary rating system, one might want to consider looking at its industry peers, Standex International Corporation (SXI), Preformed Line Products Company (PLPC), and Belden Inc. (BDC), which have an A (Strong Buy) rating.
SLDP shares closed at $6.90 on Friday, down $-0.15 (-2.13%). Year-to-date, SLDP has declined -21.05%, versus a -17.67% rise in the benchmark S&P 500 index during the same period.
About the Author: Aditi Ganguly
Aditi is an experienced content developer and financial writer who is passionate about helping investors understand the do’s and don’ts of investing. She has a keen interest in the stock market and has a fundamental approach when analyzing equities.
 shutterstock.com – StockNews