5 Beaten-Down Home Improvement Stocks to Scoop Up Now

Slowing home sales due to high mortgage rates has resulted in lower demand for home improvement or remodeling projects. However, with inflation appearing to have peaked, the home improvement industry should rebound soon. Therefore, it could be wise to invest in beaten-down home improvement stocks Arhaus (ARHS), Tile Shop (TTSH), Kingfisher (KGFHY), Haverty Furniture (HVT), and Builders FirstSource (BLDR), which are well-positioned to rebound soon. Let’s discuss.

shutterstock.com – StockNews

Home improvement companies benefited significantly from surging consumer interest in renovation and remodeling activities amid the pandemic-led remote lifestyles. However, sowing home sales this year with soaring mortgage rates amid the multi-decade high inflation is hurting the industry’s growth. Many home improvement companies have witnessed sales declines lately.

However, since many economists believe inflation has peaked, the demand for homes and home improvement should rebound soon with declining mortgage rates. Moreover, soaring DIY décor trends should help home improvement companies to stay afloat. The global do-it-yourself (DIY) home improvement retailing market is expected to grow at a 4.4% CAGR to $1.28 trillion by 2030. The global home improvement market is expected to grow at a 6.4% CAGR to reach $514.90 billion by 2028.

Therefore, it could be wise to invest in beaten-down home improvement stocks Arhaus, Inc. (ARHS), Tile Shop Holdings, Inc. (TTSH), Kingfisher plc (KGFHY), Haverty Furniture Companies, Inc. (HVT), and Builders FirstSource, Inc. (BLDR), which possess sound fundamentals and solid growth prospects.

Arhaus, Inc. (ARHS)

ARHS operates as a lifestyle brand and premium retailer in the home furnishings market, providing merchandise assortments across various categories, including furniture, lighting, textiles, décor, and outdoor. The company offers its products through an omnichannel model comprising showrooms, an e-commerce platform, a catalog, and in-home designer services. As of December 31, 2021, it operated through a network of 71 traditional showrooms, 5 Design Studios, and 3 Outlets, as well as 58 showrooms with in-home interior designers.

For its fiscal 2022 first quarter ended March 31, 2022, ARHS’ net revenue increased 43.5% year-over-year to $246.30 million. The company’s gross profit came in at $97.72 million, representing a 38.9% year-over-year improvement. Its income from operations came in at $22.87 million for the quarter, indicating a 102.7% rise from the prior-year period. As of March 31, 2022, the company had $148.84 million in cash and cash equivalents.

ARHS surpassed Street EPS estimates in the trailing three quarters. The consensus revenue estimate of $1.17 billion for fiscal 2022 ending December 31, 2022, represents a 47.1% rise from the prior-year period. The company’s EPS is expected to grow at a rate of 7.9% per annum over the next five years.

The stock’s 0.82x forward EV/Sales is 26% lower than the 1.11x industry average. In terms of forward Price/Sales, ARHS is currently trading at 0.68x, which is 28.8% lower than the 0.95x industry average. Over the past week, the stock has lost 5.3% to close yesterday’s trading session at $5.57, down 61.9% from its 52-week high of $14.95.

ARHS’ POWR Ratings reflect this promising outlook. The stock has an overall B rating, which equates to Buy in our proprietary rating system. The POWR Ratings are calculated by considering 118 distinct factors, with each factor weighted to an optimal degree.

It has an A grade for Sentiment and a B grade for Quality. Click here to see the additional ratings for ARHS’ Growth, Stability, Value, and Momentum. ARHS is ranked #15 of 63 stocks in the Home Improvement & Goods industry.

Tile Shop Holdings, Inc. (TTSH)

TTSH is a specialty retailer of manufactured and natural stone tiles, setting and maintenance materials, and related accessories. The company offers marble, travertine, granite, quartz, sandstone, porcelain, glass, cement, wood, and metal tiles. It sells its products through its website and offers delivery services through third-party freight providers.

For its fiscal 2022 first quarter ended March 31, 2022, TTSH’s net sales increased 11.3% year-over-year to $102.47 million. The company’s gross profit came in at $66.85 million, indicating a 4.1% rise from the prior-year period. It had $13.46 million in cash and cash equivalents as of March 31, 2022.

Analysts expect the company’s revenue to improve 5.2% year-over-year to $389.97 million for fiscal 2022, ending December 31, 2022. TTSH’s EPS is expected to grow at a rate of 20% per annum over the next five years.

The stock’s 0.90x forward EV/Sales is 19% lower than the 1.11x industry average. In terms of forward Price/Sales, TTSH is currently trading at 0.58x, which is 39% lower than the 0.95x industry average. Over the past week, the stock has lost 4.2% to close yesterday’s trading session at $4.37, down 50.9% from its 52-week high of $8.90.

TTSH’s POWR Ratings reflect this promising outlook. The stock has an overall B rating, which equates to Buy in our proprietary rating system.

It has an A grade for Sentiment and Quality. Click here to see the additional ratings for TTSH’s Stability, Value, Growth, and Momentum. TTSH is ranked #4 in the same industry.

Kingfisher plc (KGFHY)

Headquartered in London, the U.K., KGFHY supplies home improvement products and services through home improvement specialist stores and e-commerce internationally. Also, the company offers property investment, finance, digital, sourcing and franchising, and IT services. It operates approximately 1,470 stores in eight countries across Europe under the B&Q, Castorama, Brico Dépôt, Screwfix, TradePoint, and Koctas brands.

On May 16, 2022, KGFHY’s Screwfix business, a multi-channel retailer of trade tools, accessories, and hardware products, announced to open its 800th store in June and expand its footprint through 80 new stores across the UK and the Republic of Ireland by the end of its fiscal 2023. This expansion will help Screwfix witness rising demand in the coming months.

For its fiscal 2022 full year ended January 31, 2022, KGFHY’s sales increased 6.8% year-over-year to £13.18 billion ($16.45 billion). The company’s gross profit came in at £4.94 billion ($6.16 billion), up 7.9% from the prior-year period. Its operating profit came in at £1.14 billion ($1.43 billion) for the quarter, representing a 24.7% rise from the year-ago period. KGFHY’s adjusted net earnings came in at £737 million ($919.65 million) for the quarter, indicating a 22% year-over-year improvement. Its adjusted EPS came in at 35.2 pence, representing a 22.6% rise from the year-ago period.

The stock’s 0.52x forward EV/Sales is 53% lower than the 1.11x industry average. In terms of forward Price/Sales, KGFHY is currently trading at 0.40x, 57.6% lower than the 0.95x industry average. Over the past week, the stock has lost 5.6% to close yesterday’s trading session at $6.19, down 40.9% from its 52-week high of $10.47.

KGFHY’s POWR Ratings reflect its solid prospects. The stock has an overall B rating, equating to Buy in our proprietary rating system.

It has an A grade for Value and a B grade for Stability and Quality. In addition to the POWR Ratings grades we have just highlighted, one can see the ratings for KGFHY’s Momentum, Growth, and Sentiment here. KGFHY is ranked #14 in the same industry.

Haverty Furniture Companies, Inc. (HVT)

HVT is a specialty retailer of residential furniture and accessories, custom upholstery products, eclectic looks, and mattress product lines. The company also offers financing through a third-party finance company and an internal revolving charge credit plan. It distributes primarily through retail stores and websites.

HVT’s net sales for its fiscal 2022 first quarter ended March 31, 2022, increased 1% year-over-year to $238.95 million. The company’s gross profit came in at $140.96 million, representing a 4.4% year-over-year improvement. Its pre-tax income came in at $25.72 million for the quarter, up 1.4% from the year-ago period. HVT’s EPS increased 6.7% year-over-year to $1.11. The company had $162.34 million in cash and cash equivalents as of March 31, 2022.

The company surpassed Street EPS estimates in each of the trailing four quarters, which is impressive. Its EPS is expected to grow at a 13.1% rate per annum over the next five years.

HVT’s 0.54x forward EV/Sales is 51.5% lower than the 1.11x industry average. In terms of forward Price/Sales, the stock is currently trading at 0.47x, 50.9% lower than the 0.95x industry average. Over the past three months, the stock has lost 3.3% to close yesterday’s session at $27.73, down 42.9% from its 52-week high of $48.54.

HVT’s strong fundamentals are reflected in its POWR Ratings. It has an overall rating of B, which equates to Buy in our proprietary rating system.

The stock has an A grade for Value and Quality and a B for Sentiment. Click here to see the additional ratings for HVT (Momentum, Stability, and Growth). The stock is ranked #3 in the same industry.

Builders FirstSource, Inc. (BLDR)

BLDR manufactures and supplies building materials, manufactured components, and construction services to professional homebuilders, sub-contractors, remodelers, and consumers. The company also distributes dimensional lumber and lumber sheet goods, millwork, windows, interior and exterior doors, and other building products. It offers a range of construction-related services, including professional installation, turn-key framing, and shell construction, spanning all its product categories.

On January 5, 2022, BLDR acquired National Lumber, the largest independent building materials supplier in New England. National Lumber’s diverse building materials and service offerings, including prefabricated millwork components and a robust R&R mix, will add even more depth to the value-added solutions BLDR customers rely on. This acquisition should strengthen BLDR’s presence in New England.

BLDR’s fiscal 2022 first-quarter net sales increased 36.1% year-over-year to $5.68 billion. The company’s gross profit came in at $1.83 billion, indicating a 71.3% year-over-year improvement. Its income from operations came in at $863.81 million for the quarter, representing a 248.4% rise from the year-ago period. While its adjusted net income increased 136.5% year-over-year to $700.80 million, its adjusted EPS grew 174.7% to $3.90. As of March 31, 2022, the company had $281.80 million in cash and cash equivalents.

Analysts expect BLDR’s EPS to be $12.17 for fiscal 2022 ending December 31, 2022, representing a 17.9% year-over-year improvement. It surpassed Street EPS estimates in each of the trailing four quarters, which is impressive. The consensus revenue estimate of $21.65 billion in the same fiscal year represents an 8.8% year-over-year improvement. The company’s EPS is expected to grow at an 18.8% rate per annum over the next five years.

The stock’s 0.69x forward EV/Sales is 58% lower than the 1.65x industry average. In terms of forward Price/Sales, BLDR is currently trading at 0.53x, which is 61.3% lower than the 1.36x industry average. Over the past week, the stock has lost 1% to close yesterday’s trading session at $27.73, down 24.6% from its 52-week high of $86.48.

BLDR’s strong fundamentals are reflected in its POWR Ratings. The stock has an overall B rating, which equates to Buy in our proprietary rating system.

It has a B grade for Value, Growth, Momentum, Sentiment, and Quality. Click here to see the additional ratings for BLDR’s Stability. BLDR is ranked #2 in the same industry.


ARHS shares closed at $5.53 on Friday, down $-0.04 (-0.72%). Year-to-date, ARHS has declined -58.26%, versus a -17.67% rise in the benchmark S&P 500 index during the same period.


About the Author: Sweta Vijayan

Sweta is an investment analyst and journalist with a special interest in finding market inefficiencies. She’s passionate about educating investors, so that they may find success in the stock market.

More…

The post 5 Beaten-Down Home Improvement Stocks to Scoop Up Now appeared first on StockNews.com

https://www.entrepreneur.com/article/429327



2 High-Quality Utilities Stocks to Add to Your Dividend Portfolio

Due to inelastic demand, the utilities sector is slated to generate stable returns amid rising prices, despite current market uncertainties. Thus, it could be wise to invest in high-quality, dividend-paying utilities stocks PPL (PPL) and Otter Tail (OTTR) to ensure a steady income stream. Read on for more.

shutterstock.com – StockNews

The U.S. utilities industry comprising water, gas, power, and electricity is popular among investors as long-term holdings and to generate a steady income for their portfolios. Owing to inelastic demand, this industry continues to rake in substantial profits irrespective of ongoing economic fluctuations.

Moreover, amid record-high inflation, the U.S. Energy Information Administration has projected residential electricity prices to increase by 3.9% between June and August.

Utility stocks have been soaring as investors sought safety amid the market uncertainties. Investors’ interest in the utilities industry is evident from the Utilities Select Sector SPDR ETF’s (XLU) 4.5% returns over the past six months compared to SPDR S&P 500 Trust ETF’s (SPY) 13.9% decline.

Therefore, we think fundamentally sound dividend-paying utilities stocks PPL Corporation (PPL) and Otter Tail Corporation (OTTR) could be solid additions to your portfolio now.

PPL Corporation (PPL)

Utility holding company, PPL, delivers electricity and natural gas in the United States and the United Kingdom. The company operates through two segments: Kentucky Regulated and Pennsylvania Regulated.

On May 25, 2022, PPL completed its acquisition of The Narragansett Electric Company- Rhode Island’s primary electric and gas utility, for approximately $3.80 billion. With this acquisition, PPL aims to serve all Rhode Island inhabitants with utmost diligence – thereby broadening its margins.

PPL has been paying dividends for 22 consecutive years. Its current dividend translates to a 4.78% yield, while its four-year average yield is 5.61%.

PPL’s operating revenues came in at $1.78 billion for the first quarter ended March 31, 2022, up 19% year-over-year. Its net income came in at $273 million, compared to a loss of $1.84 billion in the year-ago period. Also, its net EPS came in at $0.37, compared to a loss per share of $2.39.

PPL’s revenue is expected to increase 22.6% year-over-year to $7.09 billion in 2022. Its EPS is expected to grow 40% year-over-year to $1.47 in 2022. Over the past month, the stock has gained marginally to close yesterday’s trading session at $29.14.

PPL’s strong fundamentals are reflected in its POWR Ratings. The POWR Ratings assess stocks by 118 different factors, each with its own weighting.

PPL has a B grade for Growth, Momentum, and Quality. Within the Utilities – Domestic industry, it is ranked #5 out of 67 stocks. Click here to see the additional POWR Ratings for Value, Stability, and Sentiment for PPL.

Otter Tail Corporation (OTTR)

OTTR and its subsidiaries engage in diversified operations like electric utility, manufacturing, and plastic pipe businesses in the United States. Its segments are Electric; Manufacturing; and Plastics.

On May 2, 2022, President and CEO Chuck MacFarlane said, “We continue to make progress on the development of Otter Tail Power’s 49.9 MW Hoot Lake Solar project, which will be constructed on and near the retired Hoot Lake Plant property in Fergus Falls, Minnesota. The project is expected to be completed in 2023 and has received renewable rider eligibility approval in Minnesota.”

OTTR has been paying dividends for 32 consecutive years. OTTR’s dividend payouts have grown at a 5.4% CAGR in the past three years. Its current dividend translates to a 2.44% yield, while its four-year average yield is 2.95%.

OTTR’s total operating revenues increased 43.3% year-over-year to $374.90 million for the first quarter ended March 31, 2022. Its net income came in at $72 million, up 137.4% year-over-year, while its EPS came in at $1.72, up 135.6% year-over-year.

For the quarter ended June 2022, analysts expect OTTR’s revenue to be $323.38 million, representing a 13.2% year-over-year rise. The company’s EPS is expected to increase 33.7% year-over-year to $1.35 for the same period. Moreover, it surpassed EPS estimates in each of the trailing four quarters. Over the past month, the stock has gained 6.7% to close yesterday’s trading session at $67.40.

OTTR’s POWR Ratings reflect this promising outlook. The stock has an overall B rating, equating to a Buy in our POWR Ratings system.

Also, the stock has a B grade for Growth, Stability, Sentiment, and Quality. Within the Utilities – Domestic industry, it is ranked #2. Click here for the additional POWR Ratings for Value and Momentum for OTTR.


PPL shares closed at $28.33 on Friday, down $-0.81 (-2.78%). Year-to-date, PPL has declined -5.03%, versus a -17.67% rise in the benchmark S&P 500 index during the same period.


About the Author: Riddhima Chakraborty

Riddhima is a financial journalist with a passion for analyzing financial instruments. With a master’s degree in economics, she helps investors make informed investment decisions through her insightful commentaries.

More…

The post 2 High-Quality Utilities Stocks to Add to Your Dividend Portfolio appeared first on StockNews.com

https://www.entrepreneur.com/article/429324


Why the Odds of a Bear Market Are Increasing by the Day

Last week I was a “Doubting Thomas” when it came to the staying power of the recent S&P 500 (SPY) rally. It just looked like yet another in a long line of failed bounces in 2022 before the next leg lower. Gladly this recent bounce gave us the opportunity to take more profits off the table while moving the POWR Value portfolio down to only 69.5% long the stock market (and created a hedge in Reitmeister Total Return where there is more of a market timing element to the trades. And yes, that portfolio actually rallied this week as the market tanked). The point is that the odds of bear market are increasing by the day. And right now we are amassing a 3rd assault on a break into bear market territory (below 3,855). The reasons why that probably takes places is shared in this week’s POWR Value commentary. Read on below for more….

shutterstock.com – StockNews

(Please enjoy this updated version of my weekly commentary from the POWR Value newsletter).

The main headline today is “Inflation is STILL Too Hot” after the not so surprisingly high +8.6% CPI report. This had the positive pre-market futures diving into negative territory in a hurry culminating in a -2.91% slashing of the S&P 500.

Thus, we end the week a mere 45 points away from bear market territory at 3,855.

On top of that the Consumer Sentiment announcement today was the lowest reading since May 1980.

What’s the similarity between that time period? RAGING INFLATION just before a recession and bear market.

The sad fact of is that the Fed is WAY behind the curve. Truly they should have been raising rates and shrinking their balance sheet 6-12 months ago. Thus the odds of them managing a soft landing are between slim and none (and yes, slim may be leaving town ;-)

Hey Reity, how about yesterday’s Jobless Claims report? Sure seems like employment is still in good shape.

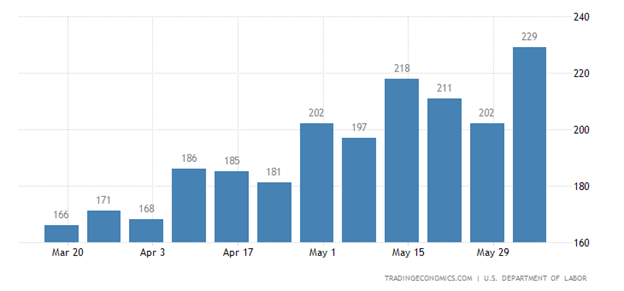
Jobless Claims on absolute basis are still low at only 229K per week. But directionally the news is not good as seen by the graph below showing 3 straight months of trending upwards.

If that continues, which is likely, then it will also start to show up in lower job adds. Then at a certain point job losses and worsening of the unemployment rate.

Remember that employment is a lagging indicator. Meaning one of the last economic data points to show weakness. Kind of like a smoke detector that goes off after the house has already burned down.

However, even this early in the game of looking for a recession there are cracks in the employment foundation which is yet another reason we have gotten more cautious now.

In Tuesday’s Reitmeister Total Return commentary I gave a lot more insight to show why the odds of recession and bear market are increasing. So check that out now if you have not already because there is lots more economic evidence and well reasoned insights from other investment experts.

Speaking of other investment experts, this news piece caught my eye today. That being famed investor, Stan Druckenmiller, is yet another in a growing line of pundits who sees this as a bear market with more downside ahead.

One of the things we have to remember is that we have smaller portfolios and thus can literally turn on a dime to go from bullish to bearish. So that often has us hanging on til the last second to make changes.

However, folks like Druckenmiller have BILLIONS of dollars invested…they can’t turn on a dime. Some of their positions are so large that if they sold them all immediately they would crush those stocks by themselves.

Plus they are watched closely by other investors which would have other everyone running for the hills.

So they need to make their moves bit by bit in stealthy fashion over a longer period of time. That is why they often call “bear” so early in the game when the rest of us can’t truly see it with such clarity.

However, part of our job is to appreciate “pattern recognition“. As in appreciating what happened in previous bear market periods BEFORE IT WAS TOO late that would tip the scales in a direction that we too should start heading for the hills.

Reity, sure sounds like you are ringing the bear market bell…are you?

I have certainly tipped over the 50% likelihood line that odds of recession and bear market are more likely than continuation of the bull. And perhaps now sliding to 60-70% likelihood in my head.

But that shrinking 30-40% chance of bull market continuation is large enough to make me stop in my tracks from doing more at this time.

Because if the market does bounce again and stay on bull track then it could happen very rapidly that create serious damage to any investor leaning too hard in a bearish direction.

Thus, the 69.5% long in POWR Value (and totally hedged in Reitmeister Total Return) is good enough til we see if indeed a break below 3,855 is in the cards.

If so, then POWR Value will likely wind its way down to the new minimum charter of 50% long…but in more conservative positions to mitigate damage.

Whereas in Reitmeister Total Return I will get rid of the long side of the hedge to make more money on the inverse ETFs as we likely see a 30-40% total decline in this bear round (34% is the average bear market decline).

For those doing math at home that would be a likely outcome of 2,891 to 3,372 for the S&P 500. Yikes indeed!

You know the expression it; It is happy hour somewhere

Same could be said this way for investors: It is a bull market somewhere

That bull market just may be in shorting stocks. (read that one again so it sinks in).

If you are not comfortable with that…then my friend…don’t be an investor. Just hand the money to an advisor riding out the highs and lows overtime. And yes, sometimes that means losing a third to half your money when the next bear comes.

However, if you want to have any honest appreciation that there is an economic cycle which creates bull and bear markets…then you have to appreciate it is as natural as night following day. Gladly there are ready made solutions for making money in each environment.

Yes, less people know how to do it during a bear market. But heck, I just laid it out for you. Not that hard when you think about it.

So if the definition of insanity is doing the same thing and expecting a different result. Then let’s stop that insanity train this time around by you trying something new that actually works for a change.

OK, I am getting off my soap box. I suspect that this coming week is the make or break for this market. We are prepared for either outcome. Let the chips fall where they may and we will react in kind.

Portfolio Update

Our portfolio has beaten the market for 4 straight weeks including a nearly 3% advantage this past week alone. Now as we roll back the clock a full month, we see the following:

-0.90% for S&P 500

+7.23% for POWR Value

I hope that brings a smile to your face on an otherwise somber day for investors

What To Do Next?

If you’d like to see more top value stocks, then you should check out our free special report:

7 SEVERELY Undervalued Stocks

What makes these stocks great additions to any portfolio?

First, because they are all undervalued companies with exciting upside potential.

But even more important, is that they are all Strong Buys according to our coveted POWR Ratings system. Yes, that same system where top-rated stocks have averaged a +31.10% annual return.

Click below now to see these 7 stellar value stocks with the right stuff to outperform in these challenging markets.

7 SEVERELY Undervalued Stocks

All the Best!

Steve Reitmeister
CEO StockNews.com & Editor of POWR Value trading service


SPY shares closed at $389.80 on Friday, down $-11.64 (-2.90%). Year-to-date, SPY has declined -17.67%, versus a % rise in the benchmark S&P 500 index during the same period.


About the Author: Steve Reitmeister

Steve is better known to the StockNews audience as “Reity”. Not only is he the CEO of the firm, but he also shares his 40 years of investment experience in the Reitmeister Total Return portfolio. Learn more about Reity’s background, along with links to his most recent articles and stock picks.

More…

The post Why the Odds of a Bear Market Are Increasing by the Day appeared first on StockNews.com

https://www.entrepreneur.com/article/429323


5 Reasons Why It’s Finally The Time To Sell Big Oil

Major oil stocks like ExxonMobil are reaching extremes on a fundamental, technical, and comparative basis. Time to short crude in a non-crude way.

shutterstock.com – StockNews

The huge rally in ExxonMobil (XOM) and the other major oil players looks to be burning a little too hot lately. ExxonMobil (XOM) is the largest component in the Energy ETF (NYSE:XLE). It comprises over 23% of the overall weighting, so let’s use that as the poster child for big oil.

Certainly, XOM has been on a major bull run over the past year. Shares of ExxonMobil are now up over 50% so far in 2022 as they once again reached fresh new highs at $99.09.

That is well above the average analyst price target of $80.73. Besides the analysts, here are 5 really good reasons XOM and other big oil stocks like Chevron (CVX) are due for a drop.

POWR Rating

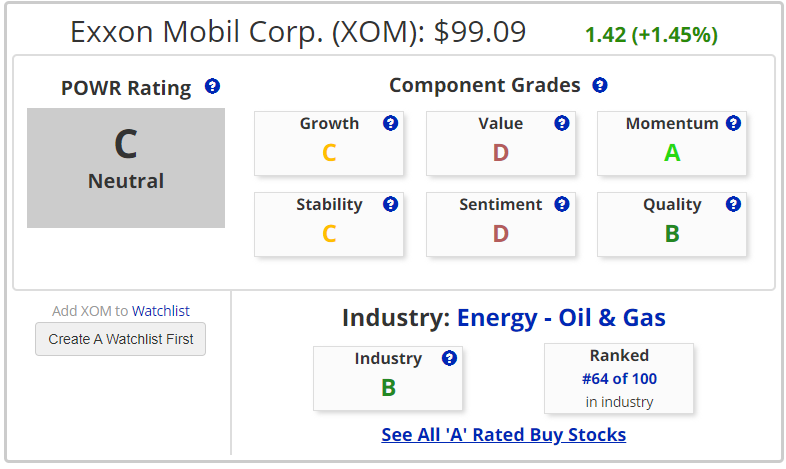
Despite trading at all-time highs, XOM remains just a C Rated stock – Neutral – in the POWR ratings. It also ranks near the bottom in the Industry Group. Not a glowing endorsement for further gains.

If not for the A Component grade in Momentum, ExxonMobil may very likely be a sell stock. Value and Sentiment both carry a D Grade.

Once the momentum breaks, look for XOM stock to start to head lower as profit taking begins to take over.

Valuation

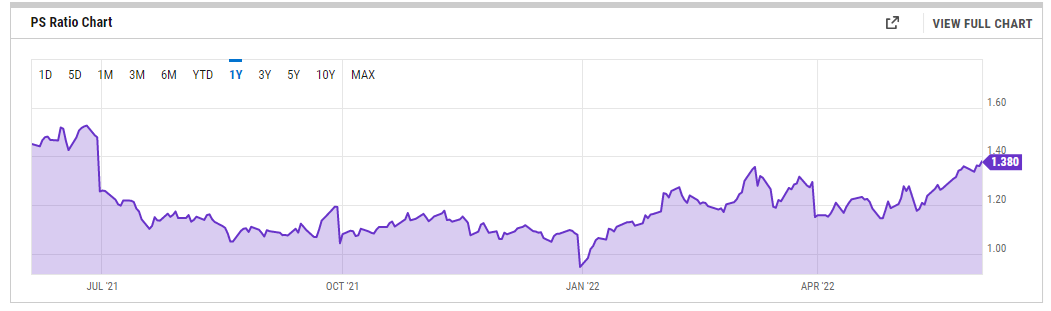
The latest leg in recent rally in ExxonMobil has been driven to a large extent by a multiple expansion. Price/Sales (P/S) for XOM stock now stands at nearly 1.4 x and is approaching the loftiest levels in the past year. It is also well above the median of 1.08 over the past decade.

The last time XOM stock traded at 1.4x P/S was last June which marked a significant short-term top in ExxonMobil stock. Without further multiple expansion XOM stock may likely stall out and begin to go in reverse.

Technicals

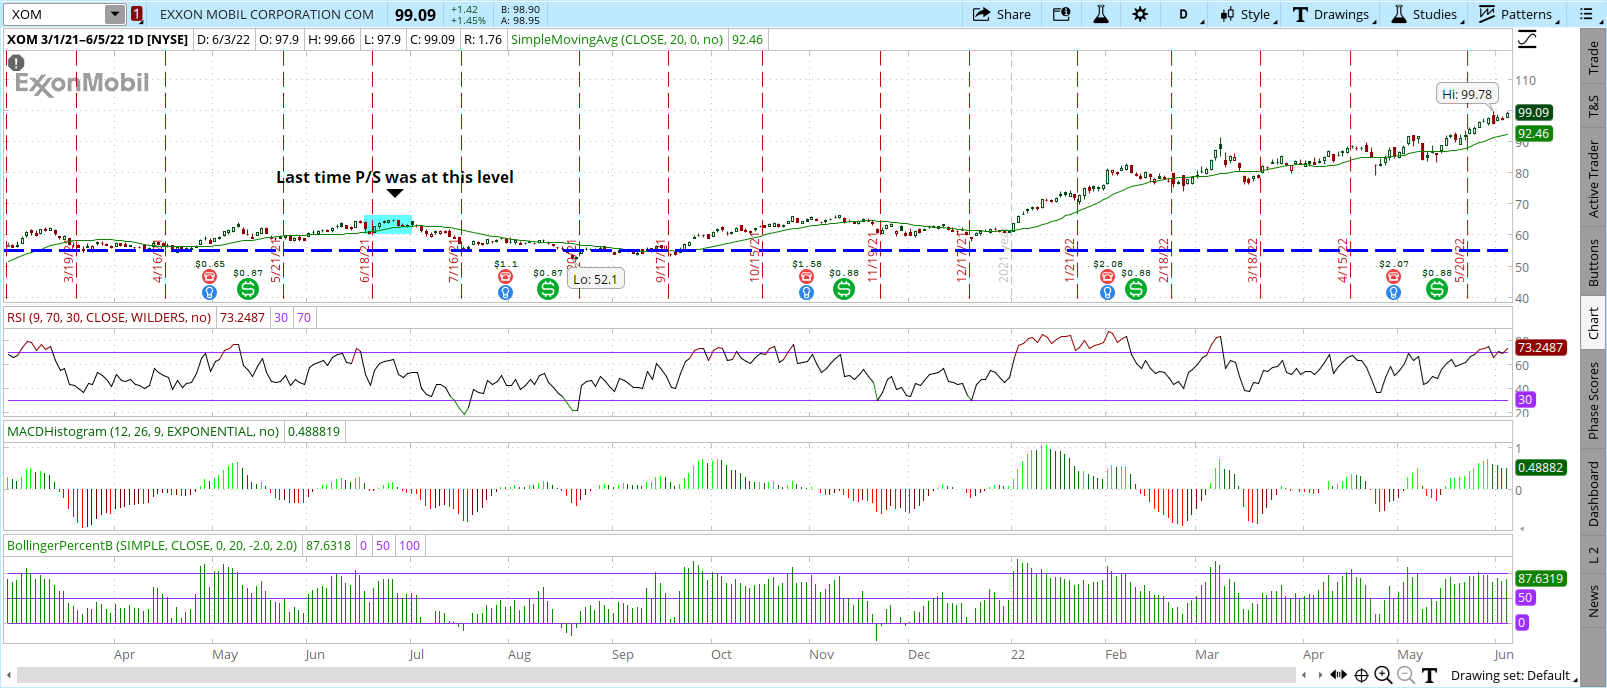
ExxonMobil has gotten to overbought reading from a technical analysis perspective. 9-day RSI is above 70. MACD hit a recent high but has started to soften. Bollinger Percent B got to over 100 but has since fallen back. Shares are trading at a big premium to the widely followed 20-day moving average.

Previous times all these indicators aligned in a similar fashion marked at short term top in XOM stock.

Seasonality

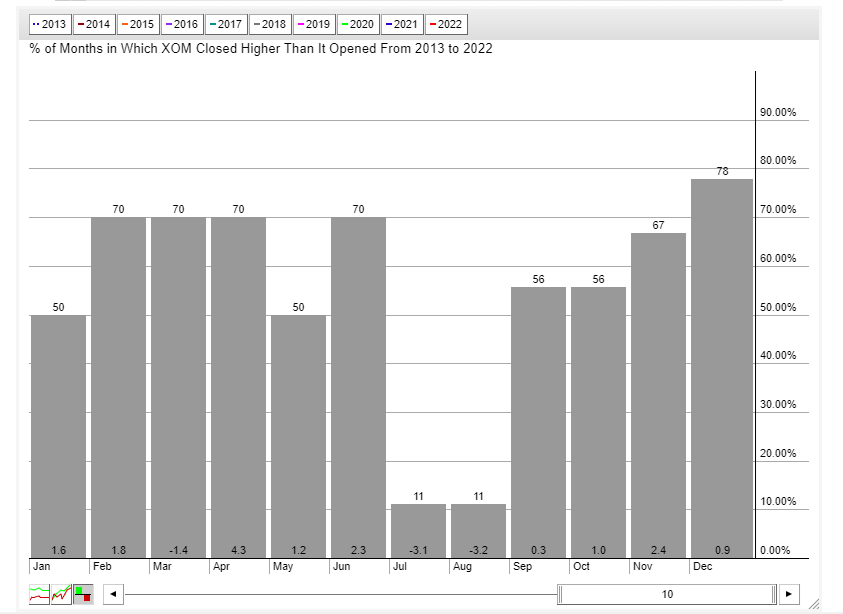
XOM stock is nearing a historically tough stretch. July and August have been by far the two worst performing months for ExxonMobil over the past decade. Shares have lost over 3% on average in both July and August and have shown gains in only 1 of those 10 years.

History may not repeat itself, but it does rhyme to quote Mark Twain. Look for seasonality to be strong headwind for XOM stock over the summer months.

Comparative Performance

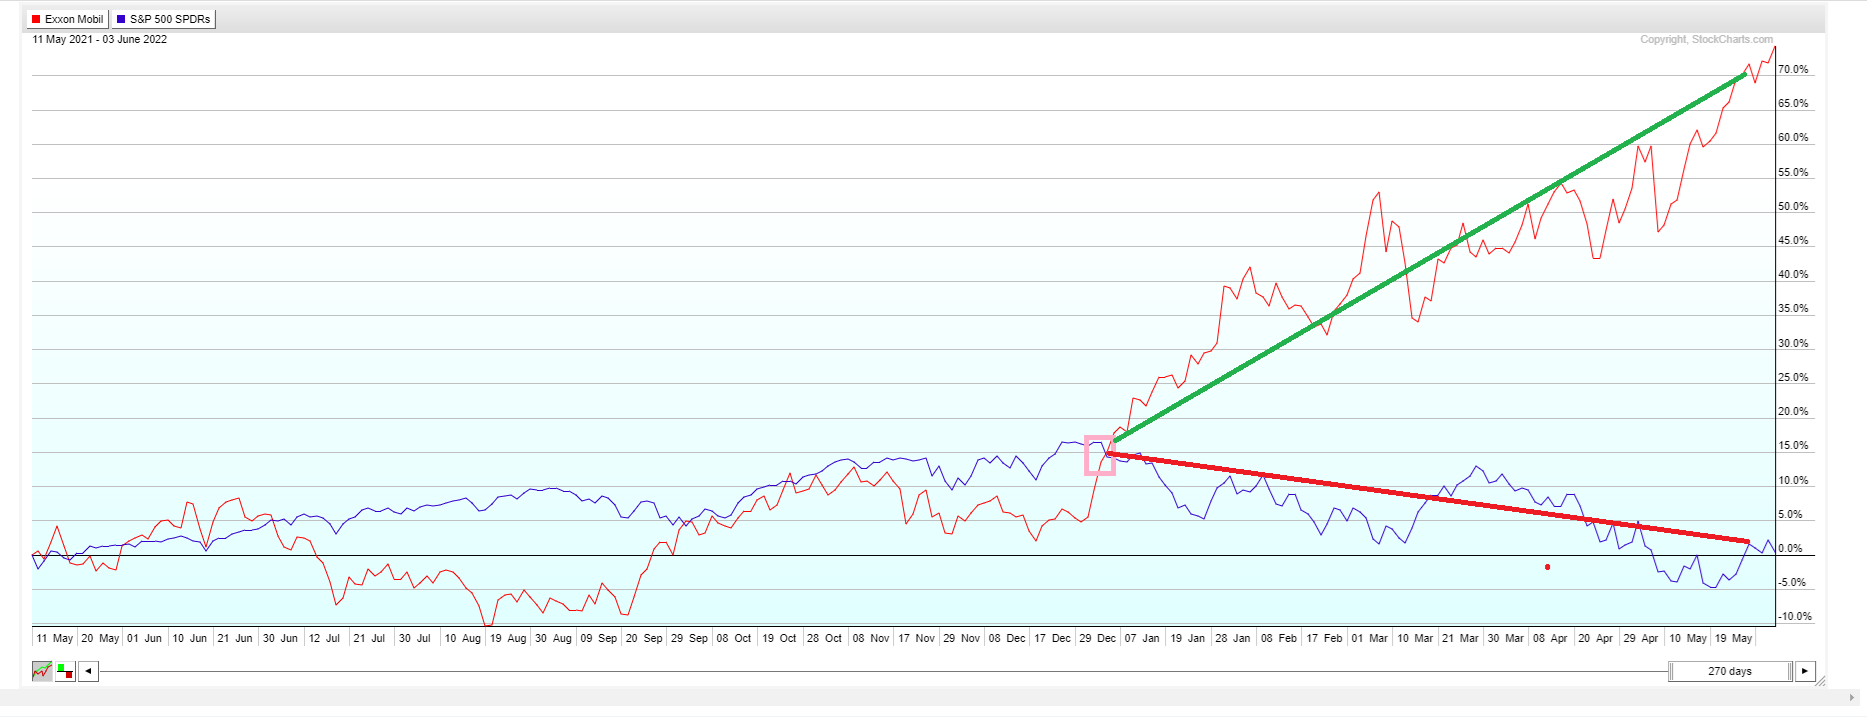
ExxonMobil has been a massive out-performer to the overall market since the beginning of the year. XOM is up over 50% in that time frame with SPY falling nearly 15%. Normally XOM and SPY tend to be fairly well correlated as seen in the first half of the chart.

Trees don’t grow to the sky forever, though. Look for this massive divergence to begin to converge with XOM being a relative under-performer to the overall market over the next several months.

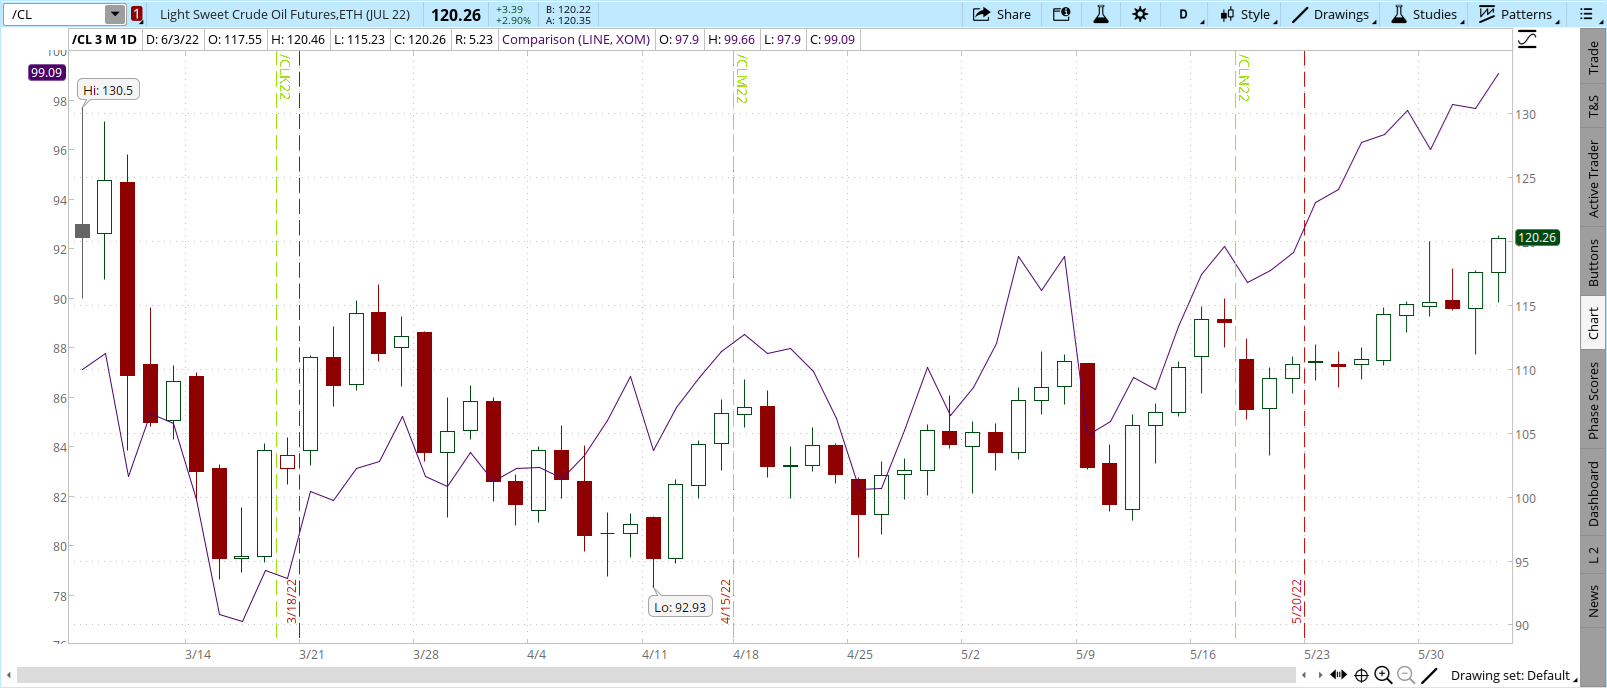
XOM stock is also getting extended versus the price of crude oil. Since making a recent high around $125 in March, oil has fallen about 4% to close near $120. ExxonMobil shares, however, have risen over 12% in that same time frame. XOM went from $88 to $99 even though oil prices dropped from $125 to $120.

Yet another reason the rally in XOM stock may be nearing an end.

Trying to pick the exact top in any stock, let alone oil stocks, is an art, not a science. Plus, there is the old market adage that stocks that trade at $90 will almost always hit $100. Given that XOM is now trading over $99, most of that benefit has been already reaped.

While shorting XOM stock makes sense, it can be expensive from a margin standpoint. Plus, XOM pays has a 3.6% dividend yield which you would be on the hook for if you shorted the stock.

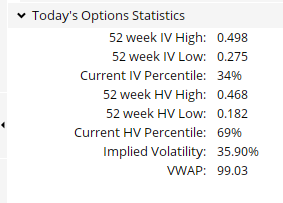
Luckily, the options market provides a very viable alternative-buying puts. Given that implied volatility (IV) is only at the 34th percentile, it means option prices are comparatively cheap. They are even cheaper when compared to the actual, or historic volatility (HV) of 69%.

You can define you risk up front while still having the ability to make out-sized gains. While risk management is always a vital element of trading, it has become even more important recently.

Traders looking to short an over-valued, overbought and overloved XOM stock may want to consider buying cheap put options to put the probabilities in your favor. At the end of the day, trading is all about probabilities and not certainty.

This is the type of trade methodology and option strategy we employ day in and day out in the POWR Options portfolio.

POWR Options

What To Do Next?

If you’re looking for the best options trades for today’s market, you should check out our latest presentation How to Trade Options with the POWR Ratings. Here we show you how to consistently find the top options trades, while minimizing risk.

If that appeals to you, and you want to learn more about this powerful new options strategy, then click below to get access to this timely investment presentation now:

How to Trade Options with the POWR Ratings

All the Best!

Tim Biggam

Editor, POWR Options Newsletter


XOM shares closed at $99.09 on Friday, up $1.42 (+1.45%). Year-to-date, XOM has gained 65.41%, versus a -13.29% rise in the benchmark S&P 500 index during the same period.


About the Author: Tim Biggam

Tim spent 13 years as Chief Options Strategist at Man Securities in Chicago, 4 years as Lead Options Strategist at ThinkorSwim and 3 years as a Market Maker for First Options in Chicago. He makes regular appearances on Bloomberg TV and is a weekly contributor to the TD Ameritrade Network “Morning Trade Live”. His overriding passion is to make the complex world of options more understandable and therefore more useful to the everyday trader. Tim is the editor of the POWR Options newsletter. Learn more about Tim’s background, along with links to his most recent articles.

More…

The post 5 Reasons Why It’s Finally The Time To Sell Big Oil appeared first on StockNews.com

https://www.entrepreneur.com/article/428892


Is This the Formation of a Bear Market?

The S&P 500 (SPY) staged an impressive rally since hitting a low of 3,810 on May 20th. Unfortunately the more I look at the facts in hand…the more concerned I am that this is the formation of a bear market…the more defensive measures I am making in my newsletter services, Reitmeister Total Return and this one, POWR Value. In this week’s Market Commentary I spell out more details on why the odds of bear market continue to grow. Read on below for more….

shutterstock.com – StockNews

(Please enjoy this updated version of my weekly commentary published June 3rd, 2022 from the POWR Value newsletter).

In last week’s POWR Value commentary I shared more insights that equated to a higher probability of bear market on the horizon (Read it here).

Since then the preponderance of fresh evidence is also pointing in that negative direction. Meaning the “thought virus” of bear market continues to spread.

Most notable is the updated read of GDP Now from the Atlanta Fed. A couple weeks ago I used this same indicator here as proof of economic strength at +2.5% for Q2.

That has now slid to only +1.3% after the most recent slate of economic results were under expectations. Directionally that is bad news.

Yes some will point to ISM Manufacturing on Wednesday rising from 55.4 to 56.1 as a positive. Or that Government employment today showed 390K job gains which was higher than expected.

However, let’s consider that Manufacturing often turns on a dime and a solid one month tells us little about what happens next. Or the fact that ISM Services today came in lower than expected at 54.5 from 55.9 last month.

Plus the services sector is 4X larger than manufacturing.

As for the seemingly good employment numbers…the sad truth is that employment is a lagging indicator. Meaning it often doesn’t signal trouble to well after a recession has started to take root.

Kind of like a fire alarm that doesn’t go off til after the building has burnt to the ground.

Also of interest, the competing ADP employment report from Thursday was woefully under expectations at only 128K jobs added. That is the slowest pace since the onset of Covid.

Plus historically it has been much more accurate at showing jobs trends than the Government version.

Going beyond economic data is more proof of the bearish thought virus spreading to more places. Here is a slate of the most telling negative headlines proving out that point:

Here’s the email Elon Mush sent to all Tesla employees about a 10% head count reduction

Jamie Dimon (JPMorgan Chase CEO) says “brace yourself” for an economic hurricane

You Have Been Warned

Yes, I could keep going and going. And if you doubt it do Google searches for terms like Bear Market or Job Layoffs and see how much comes up to support this negative notion.

Right now I would say that odds of recession and bear market is north of 50%. That also means that it is not a done deal.

That indeed the Fed could orchestrate a soft landing for the economy as they raise rates and that the recent nasty correction was enough pain before a return to bull market conditions.

Our move down to 69% long in POWR Value is a nod in that direction. That indeed a bear market is not a given and this more conservative stance gives us a better balancing act to get more defensive or aggressive as needed.

Meaning if a bear market is afoot then likely we will sell more of our aggressive positions and rotate to larger, lower beta, conservative positions in the portfolio. Also likely reduce total long exposure to just 50%.

On the other hand, if we avoid bear market territory and get back on a serious and lasting bull run, then we will do the opposite.

That would mean getting back to 100% long in more aggressive positions. That includes a higher dose of small caps, growth stocks and higher beta investments.

Remember that economics is a soft science. Meaning it is not exact making it hard to make concrete predictions.

The same is obviously true for the stock market by extension since recessions and bear markets go hand in hand.

I point this out to help appreciate the step by step approach we are using to get more or less bullish in our portfolio.

That’s because it’s very dangerous to guess wrong and get trampled by the market going the other direction. Better to do more nuanced moves as things unfold.

What To Do Next?

If you’d like to see more top value stocks, then you should check out our free special report:

7 SEVERELY Undervalued Stocks

What makes these stocks great additions to any portfolio?

First, because they are all undervalued companies with exciting upside potential.

But even more important, is that they are all Strong Buys according to our coveted POWR Ratings system. Yes, that same system where top-rated stocks have averaged a +31.10% annual return.

Click below now to see these 7 stellar value stocks with the right stuff to outperform in the coming months.

7 SEVERELY Undervalued Stocks

All the Best!

Steve Reitmeister
CEO StockNews.com & Editor of POWR Value trading service


SPY shares closed at $410.54 on Friday, down $-6.85 (-1.64%). Year-to-date, SPY has declined -13.29%, versus a % rise in the benchmark S&P 500 index during the same period.


About the Author: Steve Reitmeister

Steve is better known to the StockNews audience as “Reity”. Not only is he the CEO of the firm, but he also shares his 40 years of investment experience in the Reitmeister Total Return portfolio. Learn more about Reity’s background, along with links to his most recent articles and stock picks.

More…

The post Is This the Formation of a Bear Market? appeared first on StockNews.com

https://www.entrepreneur.com/article/428883


3 Stocks Under $2 That Will More Than Double in the Next 12 Months, According to Wall Street

Surging inflation, interest rate hikes, and geopolitical uncertainties have recently put the stock market under pressure. So, it could be wise to bet on low-priced stocks that possess solid rebound prospects. Wall Street Analysts expect low-priced stocks PaySign, Inc. (PAYS), Sorrento Therapeutics, Inc. (SRNE), and National CineMedia, Inc. (NCMI) to more than double in the next 12 months.

shutterstock.com – StockNews

The stock market has been facing immense volatility over the past few weeks due to various macroeconomic factors and geopolitical uncertainties. However, yesterday S&P 500, Dow Jones, and Nasdaq recovered 2%, 1.6%, and 2.7%, respectively. Despite yesterday’s rally, the uncertainties prevailing in the broader market are expected to keep the investor’s overall sentiments bearish. According to a famous economist David Rosenberg, the S&P 500 will further crash by 17% to 3,300.

In addition, the Fed’s hawkish stance to tame the multi-decade high inflation and the consequent possibilities of a recession is expected to keep the market volatile. Therefore, it could be wise to bet on quality, low-priced stocks, which are expected to rebound significantly in the coming months.

Wall Street Analysts expect sub-$2 stocks PaySign, Inc. (PAYS), Sorrento Therapeutics, Inc. (SRNE), and National CineMedia, Inc. (NCMI) to witness significant upside in the coming months. So they could be solid additions to your portfolio now.

PaySign, Inc. (PAYS)

Headquartered in Henderson, Nevada, PAYS offers prepaid card products and processing services under the PaySign brand for corporate, consumer, and government applications. It provides various services, such as transaction processing, cardholder enrollment, value loading, cardholder account management, reporting, and customer service through PaySign, a proprietary card-processing platform.

During the fourth quarter ending December 31, 2021, PAYS’ total revenue increased 20.9% year-over-year to $8.77 million. Its income from operations amounted to $0.10 million compared to a loss of $0.66 million in the prior-year quarter, while its net income came in at $0.11 million compared to a net loss of $4.31 million in the previous period. The company’s cash stood at $7.39 million.

The consensus EPS estimate of $0.01 represents a 150% improvement year-over-year for the fourth quarter ending December 2022. Analysts expect PAYS’ revenue to increase 32.8% year-over-year to $8.83 million for the second quarter ending June 2022.

Out of the four Wall Street Analysts that rated the stock, three rated it Buy, and one rated it Hold. Closing its last trading session at $1.32, the 12-month median price target of $3.43 represents a 159.9% potential upside. The price target ranges from a low of $2.80 to a high of $4.00.

Sorrento Therapeutics, Inc. (SRNE)

Headquartered in San Diego, California, SRNE, a clinical-stage and commercial biopharmaceutical company, develops therapies for cancer, autoimmune, inflammatory, viral, and neurodegenerative diseases. It has two operating segments, Sorrento Therapeutics and Scilex.

This month, SRNE announced the dosing of the first subject in Phase 2, a randomized, double-blind, placebo-controlled, parallel-group, multicenter study to examine the safety and efficiency of SP-103 in subjects with acute LBP. “It is a significant milestone for Scilex to begin the next development phase of the triple-dose strength of FDA-approved ZTlido (lidocaine topical system) 1.8% (“ZTlido”), said Dr. Dmitri Lissin, Chief Medical Officer of Scilex.

SRNE’s total revenue increased 29% year-over-year to $18.39 for the first quarter ending March 31, 2022. The cash and cash equivalents increased 205.2% from its year-ago value to $111.91 million for three months ending March 31, 2022, while its net cash flow provided by financing activities amounted to $173.37 million.

Analysts expect SRNE’s revenue to increase 117.7% year-over-year to $29.41 million for the second quarter ending June 2022. In addition, it has an impressive earnings history as it surpassed the consensus EPS estimate in three of the trailing four quarters.

The two Wall Street Analysts that rated the stock rated it Buy. The 12-month median price target of $18.00 indicates a 1068.8% potential upside. The price targets range from a low of $16.00 to a high of $20.00. The stock closed the last trading session at $1.54.

National CineMedia, Inc. (NCMI)

In March, NCMI announced the launch of one of the largest technology platforms driven by data for moviegoers, NCMx. The new data, insights, and analytics platform uses the company’s complete knowledge and substantial data about moviegoer behavior to connect brands with custom audiences in theaters and on digital screens before and after attending movies.

For the first quarter ending March 31, 2022, NCMI’s revenue increased 564.8% year-over-year to $35.90 million. Its operating loss decreased 20.5% from its year-ago value to $22.50 million. The cash and cash equivalent and marketable securities grew 12.3% year-over-year to $115.10 million for three months ending March 31, 2022              

Analysts expect NCMI’s revenue to increase 362.5% year-over-year to $64.75 million for the second quarter ending June 2022.

All four Wall Street Analysts that rated the stock rated it Buy. Closing its last trading session at $1.23, the 12-month median price target of $3.83 represents a 211.4% potential upside. The price target ranges from a low of $3.50 to a high of $4.00.


PAYS shares were trading at $1.39 per share on Friday afternoon, up $0.07 (+5.30%). Year-to-date, PAYS has declined -13.13%, versus a -12.59% rise in the benchmark S&P 500 index during the same period.


About the Author: Spandan Khandelwal

Spandan’s is a financial journalist and investment analyst focused on the stock market. With her ability to interpret financial data, she aims to help investors evaluate the fundamentals of a company before investing.

More…

The post 3 Stocks Under $2 That Will More Than Double in the Next 12 Months, According to Wall Street appeared first on StockNews.com

https://www.entrepreneur.com/article/428474


3 Stocks Warren Buffett Just Bought That Deserve a Place in Your Portfolio

The stock market has been under immense pressure since the beginning of the year due to several macroeconomic and geopolitical uncertainties. Amid the current turmoil, renowned investor Warren Buffett’s top portfolio holdings may be appealing investments owing to their strong growth potential and ability to endure market headwinds. Recently bought Warren Buffett stocks Celanese Corporation (CE), McKesson Corporation (MCK), and HP Inc. (HPQ) could be solid additions to your portfolio.

shutterstock.com – StockNews

Warren Buffett is one of the world’s most renowned investors and is the CEO of the holding company Berkshire Hathaway (BRK.A) (BRK.B), which majorly owns shares of blue-chip companies with robust balance sheets and stable cash flows. Berkshire Hathaway’s recently filed 13F showed that Buffett’s collection of stocks grew in number during the first three months of 2022. Moreover, Berkshire’s 13F revealed that the holding company spent $41.5 billion in net stock purchases in the first quarter, the highest since 2008.

Since the beginning of the year, the stock market has experienced wild swings as investors remain concerned about the Ukraine-Russia war, supply chain constraints, the Fed’s potential interest rate hikes to curb the inflationary pressures, and a slowdown in economic growth. However, Buffett took advantage of the recent market dip to buy quality stocks.

Warren Buffett recently bought Celanese Corporation (CE), McKesson Corporation (MCK), and HP Inc. (HPQ). So, these stocks could be good additions to your portfolio as well.

Celanese Corporation (CE)

Headquartered in Irving, Texas, CE, a technology and specialty materials company, manufactures and sells high-performance engineered polymers internationally. The company operates through three segments: Engineered Materials; Acetate Tow; and Acetyl Chain. CE represents 0.4% of Buffett’s portfolio.

In February, CE announced the signing of a definitive agreement to acquire a majority1 of DuPont’s Mobility & Materials (“M&M”) business for $11.0 billion in cash. CE will acquire a wide portfolio of engineered thermoplastics and elastomers, industry-renowned brands and intellectual property, global production assets, and a world-class organization.

For the first quarter ending March 31, 2022, CE’s net sales increased 41.2% year-over-year to $2.54 billion. Its operating profit grew 62.9% year-over-year to $531.00 million, while its net earnings improved 56% from its year-ago value to $504.00 million. The company’s adjusted EPS rose 60.1% from its prior-year quarter to $5.54.

Analysts expect CE’s revenue to increase 8.8% year-over-year to $2.39 billion for the second quarter ending June 2022. Moreover, it has an impressive earnings surprise history, as it surpassed the consensus EPS estimates in three of the trailing four quarters. The company’s shares have soared 11.9% over the past month.

CE’s POWR Ratings reflect this promising outlook. The company has an overall rating of B, which translates to Buy in our proprietary rating system. The POWR Ratings assess stocks by 118 different factors, each with its own weighting.

The stock also has a B grade for Sentiment and Quality. Within the A-rated Chemicals industry, it is ranked #38 of 91 stocks. To see additional POWR Ratings for Value, Growth, Stability, and Momentum for CE, click here.

McKesson Corporation (MCK)

MCK offers healthcare services in the United States and internationally. It has four operating segments: U.S. Pharmaceutical, International, Medical-Surgical Solutions, and Prescription Technology Solutions (RxTS). MCK has a 0.3% weightage in Buffett’s portfolio.

MCK’s revenue increased 11.8% year-over-year to $66.10 billion for the fourth quarter ending March 31, 2022. Its operating income amounted to $633.00 million, while its net income amounted to $368.00 million. The company’s EPS came in at $2.47.

The $25.48 consensus EPS estimate for fiscal 2024 represents 9.4% year-over-year growth. Analysts expect revenue to increase 3.5% year-over-year to $64.87 billion for the first quarter ending June 2022. Moreover, it has an impressive earnings surprise history, as it surpassed the consensus EPS estimates in three of the trailing four quarters. The company’s shares have surged 35.3% year-to-date and 70.2% over the past nine months.

MCK’s strong fundamentals are reflected in its POWR Ratings. The stock has an overall A rating, which equates to Strong Buy in our POWR Ratings system. The stock also has a B grade for Growth, Value, and Stability. Within the Medical – Services industry, it is ranked #1 of 86 stocks.

In total, we rate MCK on eight different levels. Beyond what we’ve stated above, we have also given MCK grades for Sentiment, Momentum, and Quality. Get all the MCK’s ratings here.

HP Inc. (HPQ)

HPQ offers personal computing and other access devices, imaging and printing products, and related technologies, solutions, and services worldwide. The company has three operational segments: Personal Systems; Printing; and Corporate Investments. HPQ represents 1.3% of Buffett’s portfolio.

For the first quarter ending January 31, 2022, HPQ’s net revenue increased 8.8% year-over-year to $17.03 billion. Its earnings from operations increased 2.9% from its year-ago value to $1.36 billion, while its non-GAAP net earnings came in at $1.20 billion, up 1% from its prior-year quarter. The company’s non-GAAP EPS rose 20% year-over-year to $1.10.

The consensus EPS estimate of $1.05 for the second quarter ending April 2022 represents 13% year-over-year growth. Analysts expect revenue to increase 2% year-over-year to $16.19 billion for the second quarter ending April 2022. In addition, it has an impressive earnings surprise history, as it surpassed the consensus EPS estimates in all of the trailing four quarters. The stock has gained 14.3% over the past year and 26.4% over the past nine months.

It is no surprise that HPQ has an overall B rating, which equates to Buy in our POWR Ratings system. HPQ has a B grade for Quality and Value. Within the Technology – Hardware industry, it is ranked #11 of 44 stocks.

Click here to see the additional POWR Ratings for HPQ (Sentiment, Growth Stability, and Momentum).


CE shares were trading at $158.65 per share on Friday afternoon, up $2.90 (+1.86%). Year-to-date, CE has declined -4.71%, versus a -12.61% rise in the benchmark S&P 500 index during the same period.


About the Author: Spandan Khandelwal

Spandan’s is a financial journalist and investment analyst focused on the stock market. With her ability to interpret financial data, she aims to help investors evaluate the fundamentals of a company before investing.

More…

The post 3 Stocks Warren Buffett Just Bought That Deserve a Place in Your Portfolio appeared first on StockNews.com

https://www.entrepreneur.com/article/428473


Is the Market Rally for Real This Time?

Another impressive rally this week after flirting with bear market territory. The question on everyone’s mind…Is it safe yet??? Meaning are we done with this correction and getting back to bull market conditions. Or is this yet another temporary rally that gives way to the next leg lower? Exploring those important topics will be at the center of our POWR Value commentary today. Read on below for more….

shutterstock.com – StockNews

(Please enjoy this updated version of my weekly commentary published May 27th, 2022 from the POWR Value newsletter).

I believe there are 3 keys to discussing the bull/bear topic today; Fundamental, Price Action, Sentiment.

Let’s start with the fundamental view.

Taking it from the top GDP Now is done with all the May data ending up with a +1.9% estimate for Q2 GDP. Yes, that is definitely better than the -1.5% actual reading for Q1 GDP. But it is shaven down from the +2.5% reading just a week ago.

On top of that I read an article pointing out that 13 of 19 key monthly economic indicators came in lower than expected in May.

Yes, clearly they still point to what you see above in a positive GDP read, but coming in under expectations is a directional concept we need to appreciate because it could point to more disappointment in future reports.

The most notable singular report I would point to was Tuesday’s PMI Composite Flash report which is a pretty far reaching indicator scanning many aspects of the economy. That fell from 56.0 previously to 53.8 for May.

This is also the second worst reading in a year and 3 straight months of heading lower.

Putting it altogether we see that the economy is still growing…but many of the indicators are showing lower and lower results.

This fits in with the narrative that high inflation is harmful to the economy over time and indeed we may be seeing its negative effects still at large which I would call neutral at best for the fundamental picture, but becoming more and more bearish.

Price Action

I am not going to waste your time with a chart because I am already saying something you know to be 100% true. That is to say there have been COUNTLESS bounces since this correction began. Most were followed up by even more downside action.

Thus, hard to find a clear reason to have faith in this rally over others.

We are getting closer to the moving averages. Breaking above 50 day at 4,276 would be a nice start. But really hard to get enthusiastic til we see a clear break above the 200 day at 4,456.

Could it happen? Yes…but right now this just feels like another short lived rally before the pain train comes back to town.

Sentiment

Often we think of sentiment and price action as being one and the same. In this case I am going to share some thoughts about the mood on Wall Street.

In particular venture capital investors who are some of the shrewdest folks in town. And they are running for the hills as proven by articles like these:

Boom Times Are Over

Sequoia Coaches Start Ups to Cut Cost or Face Death Spiral

Venture Capital Firms Have Very Bad News for Startups

The point is to think of bearish sentiment as a virus that spreads over time. The more people infected with the idea, the more it becomes reality wave after wave.

Right now there are enough people…like truly some of the smartest investors…who have the virus and are spreading this bearish notion which increases the odds we will tip over into bear market territory.

No…it doesn’t guarantee that outcome. Because a long ride up on the wall of worry could counteract these ideas and kill the bear in its tracks.

Especially if rates continue to moderate as they are now…and especially if the dollar continues to weaken which is better for US exporters.

Add it altogether the odds of bear market have increased. In fact, I have recently tipped over the 50% likelihood mark on that being true leading to defensive measures in both POWR Value and Reitmeister Total Return portfolios.

I want to be wrong. I truly welcome the re-emergence of the bull. However, I will keep this more conservative stance in place a good while longer given the current facts in hand.

What To Do Next?

If you’d like to see more top value stocks, then you should check out our free special report:

7 SEVERELY Undervalued Stocks

What makes these stocks great additions to any portfolio?

First, because they are all undervalued companies with exciting upside potential.

But even more important, is that they are all Strong Buys according to our coveted POWR Ratings system. Yes, that same system where top-rated stocks have averaged a +31.10% annual return.

Click below now to see these 7 stellar value stocks with the right stuff to outperform in the coming months.

7 SEVERELY Undervalued Stocks

All the Best!

Steve Reitmeister
CEO StockNews.com & Editor of POWR Value trading service


SPY shares closed at $415.26 on Friday, up $9.95 (+2.45%). Year-to-date, SPY has declined -12.30%, versus a % rise in the benchmark S&P 500 index during the same period.


About the Author: Steve Reitmeister

Steve is better known to the StockNews audience as “Reity”. Not only is he the CEO of the firm, but he also shares his 40 years of investment experience in the Reitmeister Total Return portfolio. Learn more about Reity’s background, along with links to his most recent articles and stock picks.

More…

The post Is the Market Rally for Real This Time? appeared first on StockNews.com

https://www.entrepreneur.com/article/428469


Down 35% in 2022, is T. Rowe Price Group Now a Buy?

Investment management company T. Rowe Price Group (TROW) has been under pressure, with declining assets under management (AUM) amid rising inflation and the war in Ukraine. Its stock has slumped 35% in price this year. Also, considering the Fed’s tightening monetary policies, is TROW a buy now? Keep reading to learn what we think.

shutterstock.com – StockNews

Publicly owned investment manager T. Rowe Price Group, Inc. (TROW) in Baltimore, Md., launches and manages equity and fixed income mutual funds. The firm provides services to individuals, institutional investors, retirement plans, and financial intermediaries. Recently, the company announced plans to add strategies to its nascent bond ETF suite, including one that aims to defend portfolios from rising interest rates. It intends to launch its floating rate ETF and U.S. high yield bond ETF on or around August 1.

However, TROW has been under pressure, with CEO Rob Sharps describing the first quarter as “challenging”. The company saw clients pull $18.10 billion in assets from its equity funds during the quarter amid declining investor confidence due to fears related to sky-high inflation and the Russia-Ukraine war. This took a significant toll on the company’s revenues and profits, which missed Wall Street estimates. Furthermore, the company does not expect the situation to ease anytime soon. “There are a lot of challenges that we’ll have to navigate going forward,” Sharps said. “They are complex, and they’re not the sort of things that resolve themselves quickly.” The company has cut its guidance for the full year.

TROW shares have slumped 35% in price year-to-date to close the last trading session at $127.73. It has plummeted 31.9% over the past year.

Here is what could shape TROW’s performance in the near term:

Declining Financials

For its fiscal first quarter, ended March 31, 2022, TROW’s net revenues increased 2% year-over-year to $1.86 billion. Its adjusted net operating income declined 8.8% from its year-ago value to $838 million. The company’s adjusted net income came in at $616.90 million, down 13.4% from the prior-year quarter. And its EPS declined 13% year-over-year to $2.62. In addition, TROW reported preliminary assets under management (“AUM”) of $1.42 trillion as of April 30, 2022, reflecting an 8.5% decrease from $1.55 trillion in  the prior month. The company’s AUM as of Dec.31, 2021, stood at $1.69 trillion.

Impressive Profitability

TROW’s  EBITDA  and net income margins of 51.19% and 37.64%, respectively, are 114.3% and 28.1% higher than the 23.88% and 29.38% industry averages. Also, its 34.72% levered FCF margin is 83.1% higher than the 18.97% industry average.

TROW’s 33.15%, 23.50%, and 23.47% respective ROE, ROA, and ROTC compare with the 12.70%, 1.26%, and 6.18% industry averages.

Bleak Analysts Expectations

Analysts expect the company’s revenues to come in at $1.78 billion in its fiscal second quarter, ending June 30, 2022, indicating a 7.7% decline year-over-year. Also, its revenue is expected to decrease 8.5% in the next quarter, ending Sept. 30, 2022, and 5.1% in the current year. The $10.41 consensus EPS estimate for the fiscal year indicates an 18.3% year-over-year decline. Moreover, the Street expects TROW’s EPS to decrease 22.8% in the current  quarter and 20.6% in the following quarter.

Mixed Valuation

In terms of forward P/E, TROW is currently trading at 11.57x, which is 10.3% higher than the 10.49x industry average. Also, its 3.67 forward EV/Sales ratio is 31.5% higher than the 2.79 industry average.

However, TROW’s forward EV/EBITDA is 22.9% lower than the 10.29x industry average, and its forward Price/Cash Flow is 7.2% lower than the 10.31x industry average.

POWR Ratings Reflect Uncertain Prospects

TROW has an overall C rating, which translates to Neutral in our proprietary POWR Ratings system. The POWR Ratings are calculated by considering 118 distinct factors, with each factor weighted to an optimal degree.

The stock has a grade of C for Value, which is consistent with its mixed valuation.

TROW has an F grade for Sentiment. Bearish analyst sentiment about the stock justifies this grade.

Among the 61 stocks in the C-rated Asset Management industry, TROW is ranked #27.

Beyond what I have stated above, one can also view TROW’s grades for Quality, Growth, Momentum, and Stability here.

View the top-rated stocks in the Asset Management industry here.

Bottom Line

This year has been quite challenging for asset managers as they face the Fed’s interest rate hikes and its tightening monetary policies. Over the first quarter, TROW’s performance has been unsatisfactory, while analysts are bearish on its near-term prospects. Despite the company’s strong profitability and sound footing in the industry, I think it could be wise to wait for its prospects to stabilize before investing in the stock.

How Does T. Rowe Price Group, Inc. (TROW) Stack Up Against its Peers?

While TROW has an overall POWR Rating of C, one might want to consider taking a look at its industry peers, Silvercrest Asset Management Group Inc. (SAMG) and Gamco Investors, Inc. (GBL), which have an A (Strong Buy) rating.


TROW shares were unchanged in premarket trading Friday. Year-to-date, TROW has declined -34.47%, versus a -14.40% rise in the benchmark S&P 500 index during the same period.


About the Author: Subhasree Kar

Subhasree’s keen interest in financial instruments led her to pursue a career as an investment analyst. After earning a Master’s degree in Economics, she gained knowledge of equity research and portfolio management at Finlatics.

More…

The post Down 35% in 2022, is T. Rowe Price Group Now a Buy? appeared first on StockNews.com

https://www.entrepreneur.com/article/428435


Why This Could Be the Long Awaited Bear Rally

Over the last couple of weeks, we’ve increased our allocation of stocks. Last week and earlier this week, I was uncertain whether this was the correct move. But, the last 2 days of market action are validating those moves as the S&P 500 (SPY) finally seems to be commencing its long, awaited bear market rally. The last genuine thrust higher was in March when the stock market rallied more than 10% in less than 3 weeks. In today’s commentary, I want to talk about why we could see a similar explosive rally, then I want to share my thoughts on the recession debate which is currently roiling the markets. Read on below to find out more….

shutterstock.com – StockNews

(Please enjoy this updated version of my weekly commentary published May 26th, 2022 from the POWR Stocks Under $10 newsletter).

First, let’s review the past week…

Over the past week, the S&P 500 is up by 4%. Even more impressive is that we are up 6.5% from Friday’s lows.

It’s looking more and more like Friday’s low is our ‘tradeable bottom’ and that 3,810 level is an important one to keep in mind.

There was little that was unusual about the Russell 2000 or the Nasdaq worth pointing out except that the small-caps made a higher low, while the large-cap dominant S&P and Naz did make lower lows.

An Explosive Rally?

Last week, I discussed some of the improvements ‘under the surface’ which was contributing to my bullish stance. And, these were also why I was willing to hold on through the volatility.

Some of the major reasons discussed include strength in bonds, stability in growth stocks, outperformance in risky assets, and a low-risk, high-reward trade setup.

Of course, these factors remain intact and are why I continue to see more upside ahead. Over the last couple of months, we’ve had several 3 to 4-day bounces that inevitably roll over.

The only real ‘bear market rally’ that we’ve had was in March when we saw a more than 10% gain. I don’t believe it’s absurd to expect a similar outcome given how oversold the market is and the extremes we’ve reached in terms of sentiment and positioning.

Here are 2 charts from Bank of America (and @Macroops) showing this:

This is from a survey of global fund managers which is showing that expectations for economic growth are at rock-bottom levels, similar to previous inflection/turning points.

It’s also interesting that fund managers are more pessimistic than in March 2020. And, here’s a chart showing how these fund managers are feeling about tech:

This is a potentially great setup for the market. Market sentiment going from bearish to neutral could trigger a big rally in stocks.

As of now, my inclination would also be to lighten up and reduce exposure as we move higher.

Let’s Talk About the R-Word

This is an excerpt from my POWR Growth commentary but wanted to include it, because it covers my stance on the recession debate. After the excerpt, I will talk about how it specifically applies to stocks under $10.

If we zoom back and take a bigger-picture perspective, it becomes easier to understand the market action. In January, we had an inflation scare which led to a 10%+ drop in the major averages despite strong earnings.

This is because higher inflation leads to multiple compression as the Fed is forced to wring liquidity out of the system.

The market bottomed in late January and was quite choppy for a couple of months with several failed breakout and breakdown attempts. In mid-April, the inflation scare receded and we got a growth scare which is leading to weakness in cyclical stocks and expectations of a decline in earnings.

Many are speculating that a recession is imminent. In fact, I would argue that many stocks in the market are priced as if a recession is a certainty rather than a possibility.

My Take

This is a controversial take. First of all, recessions are fantastic buying opportunities for stocks. So, when people start openly talking about recessions, you should start getting excited.

I’m going to make another claim.

When there is no systemic risk, it’s better to buy early as there is a greater chance of a V-shaped bounce. If there is systemic risk, then it’s better to be patient as there is a greater chance of a market crash or more liquidations.

Currently, we don’t have systemic risk. Not like what we had in 2008 with banks leveraged at 30:1. Yes, there are pockets of froth and overvaluation, but these markets could be liquidated and would hurt holders of these assets, but there would be limited damage to the broader economy.

To be specific, here’s what I think is happening. Two parts of the economy are in a recession – tech and discretionary spending. Depending on your bias, some, most, or all of it is due to incredible growth in 2020 and 2021 due to one-offs like the pandemic and stimulus payments.

On a 2-year basis, both segments have strong double-digit growth. But, it’s slowing sharply and going negative in many instances. These are both massive parts of the economy, so a contraction would be meaningful enough to put the economy in a recession or a near recession.

However, I believe other parts of the economy will remain in growth mode like the industrial sector, housing, energy, steel, materials, autos, etc.

In fact, we had a very similar circumstance during 2015-2016 when we had a recession scare. Except during this time, steel/energy/materials were in a major bear market. Oil was around $30, and copper was at $2.

 Supply was strong due to large investments in production that were made from 2007 to 2011, and aggregate global demand had never meaningfully recovered after the Great Recession.

Real GDP growth dipped from 3% to below 1.4% but never went negative. The major reason is that other parts of the economy saw a slowdown but didn’t go negative. Examples are housing, tech, and consumer spending. Another source of support was that interest rates were falling.

So, this is similar except larger components of the economy are vulnerable, and there won’t be as much support from interest rates. Therefore, I anticipate more volatility and think a *technical* recession is likely.

However, just like the last recession scare which kind of crested between February 2016 and June 2016, this will turn out to be a fantastic buying opportunity.

In next week’s article, I want to include some historical analogs that are similar to the current economic and market environment to give greater context.

(end of POWR Growth commentary)

For our purposes, I believe certain parts of the market continue to have significant upside while those parts that are more ‘recessionary’ like tech and consumer spending are better suited for short-term traders rather than investments to work.

 What To Do Next?

If you’d like to see more top stocks under $10, then you should check out our free special report:

3 Stocks to DOUBLE This Year

What gives these stocks the right stuff to become big winners?

First, because they are all low priced companies with explosive growth potential.

But even more important, is that they are all top Buy rated stocks according to our coveted POWR Ratings system and they excel in key areas of growth, sentiment and momentum.

Click below now to see these 3 exciting stocks which could double (or more!) in the year ahead.

3 Stocks to DOUBLE This Year

All the Best!

Jaimini Desai
Chief Growth Strategist, StockNews
Editor, POWR Stocks Under $10 Newsletter


SPY shares . Year-to-date, SPY has declined -14.40%, versus a % rise in the benchmark S&P 500 index during the same period.


About the Author: Jaimini Desai

Jaimini Desai has been a financial writer and reporter for nearly a decade. His goal is to help readers identify risks and opportunities in the markets. He is the Chief Growth Strategist for StockNews.com and the editor of the POWR Growth and POWR Stocks Under $10 newsletters. Learn more about Jaimini’s background, along with links to his most recent articles.

More…

The post Why This Could Be the Long Awaited Bear Rally appeared first on StockNews.com

https://www.entrepreneur.com/article/428406