Better Buy: Kinder Morgan vs. MPLX

High oil and gas prices due to the ban on Russian oil and surging demand bode well for Kinder Morgan (KMI) and MPLX (MPLX). But which of these midstream oil & gas stocks is a better buy now? Read more to find out.

shutterstock.com – StockNews

Rising demand for oil and natural gas upon the resumption of economic and industrial activities and controlled supply from OPEC+ led to high energy prices last year. However, rising Western sanctions on Russian oil have significantly disrupted the oil supply and boosted its prices even higher. As OPEC+ sticks to its original plan to increase oil output by a modest amount, the surging demand is expected to drive prices higher in the upcoming months.

High oil prices should benefit midstream companies with an established network of pipelines and terminals. Investors’ interest in this space is evident from the USCF Midstream Energy Income Fund ETF’s (UMI) 9.2% gains over the past three months versus the SPDR S&P 500 Trust ETF’s (SPY) 10.3% loss. 

Kinder Morgan, Inc. (KMI) and MPLX LP (MPLX) are two prominent oil and gas midstream segment players. KMI is an energy infrastructure company that operates through Natural Gas Pipelines; Products Pipelines; Terminals; and CO2 segments. It owns approximately 83,000 miles of pipelines that transport natural gas, gasoline, crude oil, carbon dioxide, and other products, and 143 terminals that store petroleum products and chemicals and handle bulk materials like coal and petroleum coke. MPLX is a diversified master limited partnership (MLP) that owns and operates midstream energy infrastructure and logistics assets and provides fuel distribution services. It also engages in the inland marine businesses comprising transportation of light products, heavy oils, crude oil, renewable fuels, chemicals, and feedstocks, and operates boats and barges, refining logistics, terminals, rail facilities, and storage caverns.

While MPLX has returned 3.2% gains year-to-date, KMI surged 20%. Which of these stocks is a better pick now? Let’s find out.

Latest Developments

On February 7, 2022, KMI received the necessary commercial commitments to construct a renewable diesel hub in Southern California. Once built, this hub will enable customers to aggregate renewable diesel batches (R99) in the Los Angeles area and move them on pipeline transportation and energy storage company SFPP, L.P. ‘s pipeline system to the high-demand markets in Colton and Mission Valley. This will create up to 20,000 barrels per day (bpd) of blended diesel throughput capacity at its truck racks, with the ability to expand in the future.

On May 2, 2022, MPLX, WhiteWater Midstream, Stonepeak Infrastructure Partners, and natural gas utility company West Texas Gas, Inc. announced their final investment decision to expand the Whistler Pipeline after having secured sufficient firm transportation agreements with shippers. Expected to be in service in September 2023, the expansion will increase the mainline capacity from 2 Bcf/d to 2.5 Bcf/d through the planned installation of three new compressor stations. This will further enhance the pipeline’s ability to provide reliable and cost-efficient residue gas transportation out of the Permian Basin, which would benefit the companies’ growing gas processing position, producers in the region, and gas customers.

Recent Financial Results

KMI’s revenues for its fiscal 2022 first quarter ended March 31, 2022, decreased 17.6% year-over-year to $4.29 billion. The company’s operating income came in at $1.02 billion, down 45.7% from the prior-year period. While its adjusted net earnings decreased 46.7% year-over-year to $732 million, its adjusted EPS fell 46.7% to $0.32. As of March 31, 2022, the company had $84 million in cash and cash equivalents.

For its fiscal 2022 first quarter ended March 31, 2022, MPLX’s total revenues and other income increased 11.6% year-over-year to $2.61 billion. The company’s income from operations came in at $1.06 billion, indicating an 8.8% year-over-year improvement. Its net income came in at $825 million, up 11.6% from the year-ago period. MPLX’s EPS came in at $0.78, indicating a 14.7% year-over-year improvement. As of March 31, 2022, the company had $42 million in cash and cash equivalents.

Past and Expected Financial Performance

Over the past three years, KMI’s EBITDA, total assets, and levered free cash flow have declined at CAGRs of 3.2%, 3.2%, and 5.2%, respectively.

KMI’s EPS is expected to decrease 13.6% year-over-year in fiscal 2022, ending December 31, 2022, and rise 2.6% in fiscal 2023. Its revenue is expected to decrease 5.5% in fiscal 2022 and increase 0.4% in fiscal 2023. Analysts expect the company’s EPS to decline at a 2.7% rate per annum over the next five years.

Over the past three years, MPLX’s EBITDA, total assets, and levered free cash flow have increased at CAGRs of 9.7%, 14.9%, and 164.1%, respectively.

Analysts expect MPLX’s EPS to grow 11.2% year-over-year in fiscal 2022, ending December 31, 2022, and 4.4% in fiscal 2023. Its revenue is expected to grow 3.1% year-over-year in fiscal 2022 and decline 0.2% in fiscal 2023. Analysts expect the company’s EPS to grow at a 3.7% rate per annum over the next five years.

Valuation

In terms of non-GAAP forward PEG, MPLX is currently trading at 3.73x, 55.4% higher than KMI’s 0.88x. In terms of forward EV/Sales, KMI’s 4.90x compares with MPLX’s 5.15x.

Profitability

KMI’s trailing-12-month revenue is almost 1.6 times MPLX’s. However, MPLX is more profitable, with a 50.7% EBITDA margin versus KMI’s 36.7%.

Furthermore, MPLX’s ROE, ROA, and ROTC of 23.8%, 6.6%, and 6.9% compare with KMI’s 3.4%, 3.3%, and 3.5%, respectively.

POWR Ratings

While MPLX has an overall B grade, which translates to Strong Buy in our proprietary POWR Ratings system, KMI has an overall C grade, equating to Neutral. The POWR Ratings are calculated by considering 118 distinct factors, each weighted to an optimal degree.

Both KMI and MPLX have been graded an A for Momentum, consistent with their impressive price gains over the past year. KMI has gained 19.4% over the past nine months, while MPLX returned 12.2%.

KMI has been graded a B in terms of Quality, in sync with its higher-than-industry profitability ratios. KMI’s 26% trailing-12-month levered free cash flow margin is 266.8% higher than the 7.1% industry average. MPLX’s C grade for Quality reflects its lower-than-industry profit margins. MPLX has a 4.3% trailing-12-month levered free cash flow margin, 40% lower than the 7.1% industry average.

Of the 33 stocks in the A-rated MLPs – Oil & Gas industry, MPLX is ranked #7. In contrast, KMI is ranked #59 of 98 stocks in the B-rated Energy – Oil & Gas industry.

Beyond what we have stated above, our POWR Ratings system has graded MPLX and KMI for Sentiment, Value, Stability, and Growth. Get all MPLX ratings here. Also, click here to see the additional POWR Ratings for KMI.

The Winner

Rising energy prices should benefit midstream operators KMI and MPLX in the coming months. However, higher profitability makes MPLX a better buy now.

Our research shows that the odds of success increase if one bets on stocks with an Overall POWR Ratings of Buy or Strong Buy. Click here to access the top-rated stocks in the MLPs – Oil & Gas industry, and here for those in the Energy – Oil & Gas industry.


KMI shares were trading at $19.23 per share on Monday afternoon, up $0.20 (+1.05%). Year-to-date, KMI has gained 25.00%, versus a -16.25% rise in the benchmark S&P 500 index during the same period.


About the Author: Sweta Vijayan

Sweta is an investment analyst and journalist with a special interest in finding market inefficiencies. She’s passionate about educating investors, so that they may find success in the stock market.

More…

The post Better Buy: Kinder Morgan vs. MPLX appeared first on StockNews.com

https://www.entrepreneur.com/article/428130



Off Target?

There was reason for optimism earlier in the week as the S&P 500 (SPY) advanced nicely after skirting bear market territory. But then on Tuesday WalMart had shockingly poor earnings which was easily ignored. Unfortunately the next day Target reported even worse results and the investment world took notice with a 4% sell off. That rout extended through Friday as we briefly blew past the bear market dividing line at 3,855 to a low of 3,810. Then a late rally ensued ending the session back above bear territory at 3,901. Does WalMart and Target earnings truly change our outlook on the economy and what it means for the stock market? That is the key topic we need to explore this week in our POWR Value commentary. Read on below for more….

shutterstock.com – StockNews

(Please enjoy this updated version of my weekly commentary from the POWR Value newsletter).

I have to be honest. I was truly shaken by these back to back earnings misses from the 2 largest retailers. On the surface it SCREAMS RECESSION!

However, I knew there was a person I could turn to answers. I am referring to Sheraz Mian, Director of Research at Zacks. He and I worked together for many years where it was very clear there was no one on the planet who understood earnings trends better than he did.

So let’s start with the insights he shared with the world in this article: Making Sense of Target, WalMart and Disappointing Retail Results. Here is the key excerpt:

“It is tempting to interpret the Walmart and Target earnings disappointments as indicative of a moderation in consumer spending. Faced with the rising costs of fuel and other essentials, not to mention growing talk of a slowing economy in the face of rising interest rates, consumers would be justified to rein in their spending to some extent.

We see the Walmart and Target reports as still reflecting a very strong consumer spending environment.

 Consumer spending will eventually slow down in response to Fed tightening, but we didn’t see much evidence of that in the Q1 earnings reports; neither from Walmart, Target or other consumer-centric companies.

Instead, these big-box retail leaders missed as a result of weak execution and failing to have the right merchandise in stores. Consumers didn’t buy the patio furniture at Walmart or appliances at Target, but they did plenty of shopping at Home Depot.

The challenge for Walmart, Target and other retailers is not only to have the correct merchandise, but also to deal with higher expenses related to freight, payroll and other items.

You can see this in the -24.4% decline in Walmart’s Q1 earnings even as its revenues increased +2.4%. For Target, earnings declined -44.9% while revenues were up +4%. The market expects these companies to pass on these higher expenses to either their customers or squeeze it out of their suppliers.

The market punished them for being surprised at the profitability hit even as they failed to protect their margins.”

After reading the above, I emailed Sheraz directly for more insights. For which he gave me a lengthy response that on the surface did not soothe my nerves:

“…inflation is a problem……for consumers as well as the companies. The Fed must be happy to see that WMT and TGT ate the cost increases, squeezing their margins, instead of passing those onto consumers.

 What happens to inflation when WMT/TGT pass on those higher expenses to consumers? TGT said that they are spending $1 billion incrementally more this year on freight………which they didn’t pass on. 

I have been looking for some early signs of weakness in consumer spending and I don’t think these reports or earlier ones from the likes of PG gave us such evidence.

 That doesn’t mean it wouldn’t happen in three months or six months, but it hasn’t happened yet. The Fed wants to weaken the consumer, so it will happen (Don’t fight the Fed, remember), but it’s down the road.” 

This response seemed a bit ominous too me…as if Sheraz was saying that a recession is right around the corner.

If so, then with investors often forecasting things well in advance, that the market as a whole is right to head into bear market territory now because of a looming recession. Here was his follow up response:

“There is no recession near term….meaning in the next 6 months….there is simply no signs at this stage that we are getting there.

The market is fearful of a recession and starting to price that in…..hence all the red prices. 

Goldman says there is 30% recession risk, in 2023. 

These are hard things to predict, but those odds look reasonable to me. This means that we will see more signs of recessionary weakness in the next couple of quarters. 

Keep in mind that the Fed is data dependent, so it’s monetary policy outlook will adjust as those recessionary signs emerge in the next couple of quarters. 

That is the soft-landing scenario, which is my view as well.

The economy weakens, the market’s inflation expectations come down, causing the Fed outlook to change. That’s when the market takes off. Till then, we are in trouble.”

Yes, that last part is ominous. But I read it as stocks will have a hard time making a meaningful bounce until there is proof of a soft landing allowing the Fed to adjust their outlook and policies.

Or to put it another way, we are still in wait and see mode similar to what we discussed last week as path #2 for the market. Here is that explanation again:

“Consolidate Here and Delay Bull/Bear Conclusion

Remember that relief rallies are typically +3-5% before testing lower once again. And that’s pretty much the size of the bounce we got Thursday afternoon through end of Friday.

So it’s not hard to imagine that we spend time in a trading range between the border of bear market territory at 3,855 and 4,100. Meaning that bulls and bears battle it out a bit longer before making the final determination if we do tumble into bear market territory or bull re-emerges.

We all would prefer the latter choice. And can even make logical presentations showing why that is the more likely outcome.

Unfortunately we do have to appreciate that the combination of high inflation and hawkish Fed is not the most stock friendly environment. Not a guarantee of a bear market…but fertile soil that could support the growth of bearish conditions.    

Add it all up and we are not that far off the divergent paths discussed last week. And that keeps us in wait and see mode.”

Wait and see mode = that just like the Fed we are data dependent to change our course of action depending on what happens next in the economy, sentiment, price action etc. But for now our course is that risk and reward are fairly well balanced at this time.

Don’t get too much more aggressive in case market does devolve into bear market.

Don’t get too much more defensive in case new bullish catalysts emerge with a meteoric bounce ensuing.

Just hold tight for now.

Portfolio Update

The S&P 500 has fallen -18.15% this year. However, that is a far cry from what is happening to the average investor. This Israeli FinTech firm, TipRanks, actually measures the performance of over 500,000 investors through their industry best Smart Portfolio feature.

What their analysis shows is that so far this year the average investor has actually endured a -36.84% devastation to their portfolios.

In that light I hope you are pleased with our more modest -6.37% decline. According to TipRanks that puts us in the top 8% of all investors this year. (And my Reitmeister Total Return portfolio is in the top 1.2% of all investors).

What To Do Next?

If you’d like to see more top value stocks, then you should check out our free special report:

7 SEVERELY Undervalued Stocks

What makes these stocks great additions to any portfolio?

First, because they are all undervalued companies with exciting upside potential.

But even more important, is that they are all Strong Buys according to our coveted POWR Ratings system. Yes, that same system where top-rated stocks have averaged a +31.10% annual return.

Click below now to see these 7 stellar value stocks with the right stuff to outperform in the coming months.

7 SEVERELY Undervalued Stocks

All the Best!

Steve Reitmeister
CEO StockNews.com & Editor of POWR Value trading service


SPY shares closed at $389.63 on Friday, up $0.17 (+0.04%). Year-to-date, SPY has declined -17.71%, versus a % rise in the benchmark S&P 500 index during the same period.


About the Author: Steve Reitmeister

Steve is better known to the StockNews audience as “Reity”. Not only is he the CEO of the firm, but he also shares his 40 years of investment experience in the Reitmeister Total Return portfolio. Learn more about Reity’s background, along with links to his most recent articles and stock picks.

More…

The post Off Target? appeared first on StockNews.com

https://www.entrepreneur.com/article/428041


5 Outperforming Stocks Value Investors Should Add to Their Portfolios

The benchmark indices again ended in the red in the last trading session. With market volatility expected to remain, value investing is gaining traction. We think fundamentally sound stocks Tyson Foods (TSN), LyondellBasell (LYB), Takeda Pharmaceuticals (TAK), Bayer AG (BAYRY), and AutoNation (AN), which are currently trading at a discount, could be ideal bets for value investors. The stocks have outperformed the broader market this year.

shutterstock.com – StockNews

The benchmark indices extended their losses on Thursday, with the S&P 500 inching closer to the bear market. The S&P 500 fell 0.58%, the Dow Jones Industrial Average slumped 0.75%, while the tech-heavy Nasdaq Composite declined 0.26%. Greg Bassuk, CEO at AXS Investments, predicts more volatility for the stock market for the second quarter.

Amid the rapid market sell-off, value stocks seem to be providing shelter to investors. In a value investing strategy, traders generally invest in the shares of companies trading cheap versus expensive groups. Growth investing has dominated for some time on the back of government stimulus. However, the tide seems to be turning. Vanguard expects the U.S. value stocks to deliver an annualized return of 4.1% over the next 10  years compared to 0.1% for the U.S. growth stocks.

Hence, some fundamentally strong stocks trading at a discount, namely  Tyson Foods, Inc. (TSN), LyondellBasell Industries N.V. (LYB), Takeda Pharmaceutical Company Limited (TAK), Bayer Aktiengesellschaft (BAYRY), and AutoNation, Inc. (AN) might be solid additions to value investors’ portfolios. These stocks have outperformed the S&P 500’s 18.2% decline year-to-date.

Tyson Foods, Inc. (TSN)

TSN in Springdale, Ark., is a worldwide food company that operates through the four broad segments of Beef; Pork; Chicken; and Prepared Foods. The company processes live-fed cattle and market hogs and manufactures and sells refrigerated food products.

On February 11, TSN declared a quarterly dividend of $0.46 per share on Class A common stock and $0.414 per share on Class B common stock, payable to shareholders on June 15. This reflects upon the company’s ability in paying back its shareholders.

On February 2, TSN announced that it had broken ground on the site of its $355 million bacon production facility. The site is expected to be operational in late 2023 and should help the company meet the increasing retail and food service demand for bacon products.

In terms of its forward P/E, TSN is trading at 8.96x, which is 52.7% lower than the 18.96x industry average. Its 0.72 forward EV/Sales multiple is 58.9% lower than the 1.77 industry average.

For the second fiscal quarter, ended April 2, TSN’s sales increased 16.1% year-over-year to $13.12 billion. Its adjusted operating income rose 57.1% from the prior-year quarter to $1.16 billion. Its adjusted net income per share attributable to TSN has improved 70.9% from the same period in the prior year to $2.29.

The $9.09  consensus EPS estimate for its fiscal year 2022 indicates a 9.8% year-over-year increase. The $52.80 billion  consensus revenue for the same year  reflects a 12.2% improvement from the prior year. Furthermore, TSN has an impressive surprise earnings history, as it has topped consensus EPS estimates in each of the trailing four quarters.

The stock has gained 5.6% in price over the past year and 3.2% over the past six months to close yesterday’s trading session at $84.12. It has declined 3.5% year-to-date.

TSN’s strong fundamentals are reflected in its POWR Ratings. The stock has an overall B rating, which equates to Buy in our proprietary rating system. The POWR Ratings are calculated by considering 118 distinct factors, with each factor weighted to an optimal degree.

TSN has an A  Value grade and a Sentiment grade of B. In the 87-stock Food Makers industry, it is ranked #12. The industry is rated B. Click here to see the additional POWR Ratings for TSN (Growth, Momentum, Stability, and Quality).

LyondellBasell Industries N.V. (LYB)

LYB is a multinational chemical company. The company operates through the Olefins and Polyolefins Americas; Olefins and Polyolefins Europe, Asia, International; Intermediates and Derivatives; Advanced Polymer Solutions; Refining; and Technology segments.

On April 21, LYB announced its plans to exit the refining business and to cease operations of its Houston refinery no later than December 31, 2023. Ken Lane, interim CEO of LYB said, “While this was a difficult decision, our exit of the refining business advances the company’s decarbonization goals, and the site’s prime location gives us more options for advancing our future strategic objectives, including circularity.”

On February 25, LYB declared a $1.13 per share dividend, which was to be paid to shareholders on March 14. This reflects the company’s ability in cash generation.

LYB’s forward non-GAAP PEG multiple of 0.27 is 76.5% lower than the 1.15 industry average. In terms of its forward Price/Sales, it is trading at 0.68x, which is 44.3% lower than the 1.23x industry average.

LYB’s sales and other operating revenues increased 44.9% year-over-year to $13.16 billion in its fiscal first quarter, ended March 31, 2022. Its net income and EPS came in at $1.32 billion and $4.00, respectively, up 23.4% and 25.8%, from the prior-year period.

Analysts expect LYB’s revenue to increase 17% year-over-year to $13.52 billion for the fiscal quarter ending June 2022.

LYB’s stock has gained 22% in price over the past six months and 18.2% year-to-date to close yesterday’s trading session at $109.03.

It is no surprise that LYB has an overall B rating, which translates to Buy in our POWR Rating system.

LYB has an A grade for Value and a B grade for Sentiment and Quality. It is ranked #28 out of the 89 stocks in the Chemicals industry. The industry is rated A. To see the additional POWR Ratings for Growth, Momentum, and Stability for LYB, click here.

Takeda Pharmaceutical Company Limited (TAK)

TAK researches, develops, manufactures, markets, and out-licenses pharmaceutical products worldwide. The company offers its products for gastroenterology, oncology, neuroscience, and rare diseases. It is headquartered in Tokyo, Japan.

On April 28, Centogene N.V (CNTG), a biodata life-science partner company announced the extension of its partnership with TAK. Under the agreement, CNTG is expected to continue to provide TAK with access to diagnostic testing for global patients.

On April 19, TAK announced that it had received manufacturing and marketing approval from the Japan Ministry of Health, Labour and Welfare (MHLW) for Nuvaxovid Intramuscular Injection (Nuvaxovid), a novel recombinant protein-based COVID-19 vaccine for primary and booster immunization in adults. This might add to the company’s revenue stream.

In terms of its forward Price/Book, TAK is trading at 1.01x, which is 62.6% lower than the 2.70x industry average. Its 5.94 forward Price/Cash Flow multiple is 63.5% lower than the16.30  industry average.

For its fiscal year ended March 31, 2022, TAK’s revenue increased 11.6% year-over-year to $29.39 billion. Its total comprehensive income for the year came in at $6.79 billion, up 18.2% from the prior year. Its net cash from operating activities rose 11.1% from the prior year to $9.25 billion.

The Street expects its revenue for the fiscal year 2023 (ending March 2023) to improve 375.5% from the prior year to $27.97 billion.

The stock has gained 4.1% in price over the past six months and 7% year-to-date to close yesterday’s trading session at $14.58.

This promising prospect is reflected in TAK’s POWR Ratings. The stock has an overall B rating, which equates to Buy in our proprietary rating system.

TAK has a Value grade of A and a Stability grade of B. It is ranked #25 out of the 166 stocks in the Medical – Pharmaceuticals industry. To see the additional POWR Ratings for Growth, Momentum, Sentiment, and Quality for TAK, click here.

Click here to checkout our Healthcare Sector Report for 2022

Bayer Aktiengesellschaft (BAYRY)

BAYRY, headquartered in Leverkusen, Germany, is a life science company that operates worldwide through the segments of Pharmaceuticals; Consumer Health; and Crop Science. The company offers prescription products, nonprescription over-the-counter medicines, and chemical and biological crop protection products.

On April 25, BAYRY announced that it was pursuing an agreement to provide its West Sacramento Biologics Research & Development (R&D) site and internal discovery and lead optimization platform to Ginkgo Bioworks Holdings, Inc. (DNA). The transaction is also expected to bring Joyn Bio’s nitrogen-fixing technologies to BAYRY, closing the joint venture created between Leaps by BAYRY and DNA. The transaction is expected to bolster BAYRY’s biological position and enable access to key technologies.

On March 10, it was announced that BAYRY and private equity firm Cinven had agreed to sell BAYRY’s Environmental Science Professional business for a purchase price of $2.60 billion. Regarding this agreement, Rodrigo Santos, Member of the Board of Management of BAYRY and President of the Crop Science Division, stated, “This divestment represents a very attractive purchase price and allows us to focus on our core agricultural business and the successful implementation of our Crop Science Division growth strategy.”

BAYRY’s 8.65 forward non-GAAP P/E multiple is 55.1% lower than the 19.29 industry average. In terms of its forward Price/Sales, it is trading at 1.31x, which is 70% lower than the 4.37x industry average.

For the fiscal first quarter of 2022, BAYRY’s net sales increased 18.7% year-over-year to €14.64 billion ($15.42 billion). Its net income improved 57.5% from the prior-year quarter to €3.29 billion ($3.47 billion), while its EPS came in at €3.35, up 57.3% from the same period the prior year.

The Street’s EPS for fiscal 2023 of $2.03 indicates a 5.2% year-over-year increase. Likewise, the Street’s $53.34 billion revenue estimate for the same year reflects a 3.4% rise from the prior year. In addition, BAYRY has topped the EPS consensus estimates in three out of the trailing four quarters, which is impressive.

Over the past six months, the stock has gained 23.1% in price and 26.9% year-to-date to close yesterday’s trading session at $16.82.

BAYRY has an overall A rating, which translates to Strong Buy in our POWR Rating system.

The stock has a Growth and Value grade of A and a Stability grade of B. It is ranked #14 in the Medical – Pharmaceuticals industry. Click here to see the additional POWR Ratings for Momentum, Sentiment, and Quality for BAYRY.

Click here to checkout our Healthcare Sector Report for 2022

AutoNation, Inc. (AN)

AN is an automotive retailer in the United States, operating through–Domestic, Import, and Premium Luxury segments. Its offerings include a range of automotive products and services, like new and used vehicles, parts, and automotive repair and maintenance.

On February 23, AN announced the pricing of $700 million of senior unsecured notes due 2032 at 3.850%. The company intended to use the net proceeds from the offering for general corporate purposes, which might include reducing borrowings, strategic initiatives, acquisitions, and share repurchases.

In terms of its forward non-GAAP PEG, AN is trading at 0.18x, which is 78.6% lower than the 0.84x industry average. Its 0.23 forward Price/Sales multiple is 74.6% lower than the 0.90 industry average.

AN’s revenue increased 14.4% year-over-year to $6.75 billion in its fiscal first quarter ended March 31. Its adjusted net income rose 54.9% from the prior-year period to $362.10 million. Its adjusted EPS improved 107.2% from the same period the prior year to $5.78.

The Street expects AN’s EPS to increase 25.9% year-over-year to $6.08 for its fiscal quarter ending June 30, 2022. Likewise, the Street’s revenue estimate for the same quarter of $7.02 billion reflects a 0.6% improvement year-over-year. In addition, AN has beaten consensus EPS estimates in each of the trailing four quarters.

AN’s shares have gained 9.6% in price over the past year and 1% over the past month to close yesterday’s trading session at $109.76. It has declined 6.1% year-to-date.

AN has an overall B rating, which equates to Buy in our proprietary rating system. AN has an A grade for Value and a B grade for Growth and Quality. It is ranked #4 out of the 24 stocks in the Auto Dealers & Rentals industry. The industry is rated B.

In addition to the POWR Rating grades we have stated above, one can see AN ratings for Momentum, Stability, and Sentiment here.

What To Do Next?

If you would like to see more top value stocks, then you should check out our free special report:

7 SEVERELY Undervalued Stocks

What makes these stocks great additions to any portfolio?

First, because they are all undervalued companies with exciting upside potential.

But even more important, is that they are all top Buy rated stocks according to our coveted POWR Ratings system. Yes, that same system where top-rated stocks have averaged a +37.99% annual return.

Click below now to see these 7 stellar value stocks with the right stuff to outperform in the coming months.

7 SEVERELY Undervalued Stocks


TSN shares were trading at $84.87 per share on Friday afternoon, up $0.75 (+0.89%). Year-to-date, TSN has declined -2.15%, versus a -19.15% rise in the benchmark S&P 500 index during the same period.


About the Author: Anushka Dutta

Anushka is an analyst whose interest in understanding the impact of broader economic changes on financial markets motivated her to pursue a career in investment research.

More…

The post 5 Outperforming Stocks Value Investors Should Add to Their Portfolios appeared first on StockNews.com

https://www.entrepreneur.com/article/428022


Is Kraft Heinz a Good Stock to Add to Your Dividend Portfolio?

Popular ketchup and condiments maker Kraft Heinz Company (KHC) is well known to dividend investors because of its impressive dividend-paying history. However, given the company’s stretched valuation and unfavorable analyst estimates, would it be a winning stock to add to one’s dividend portfolio now? Read on to learn our view.

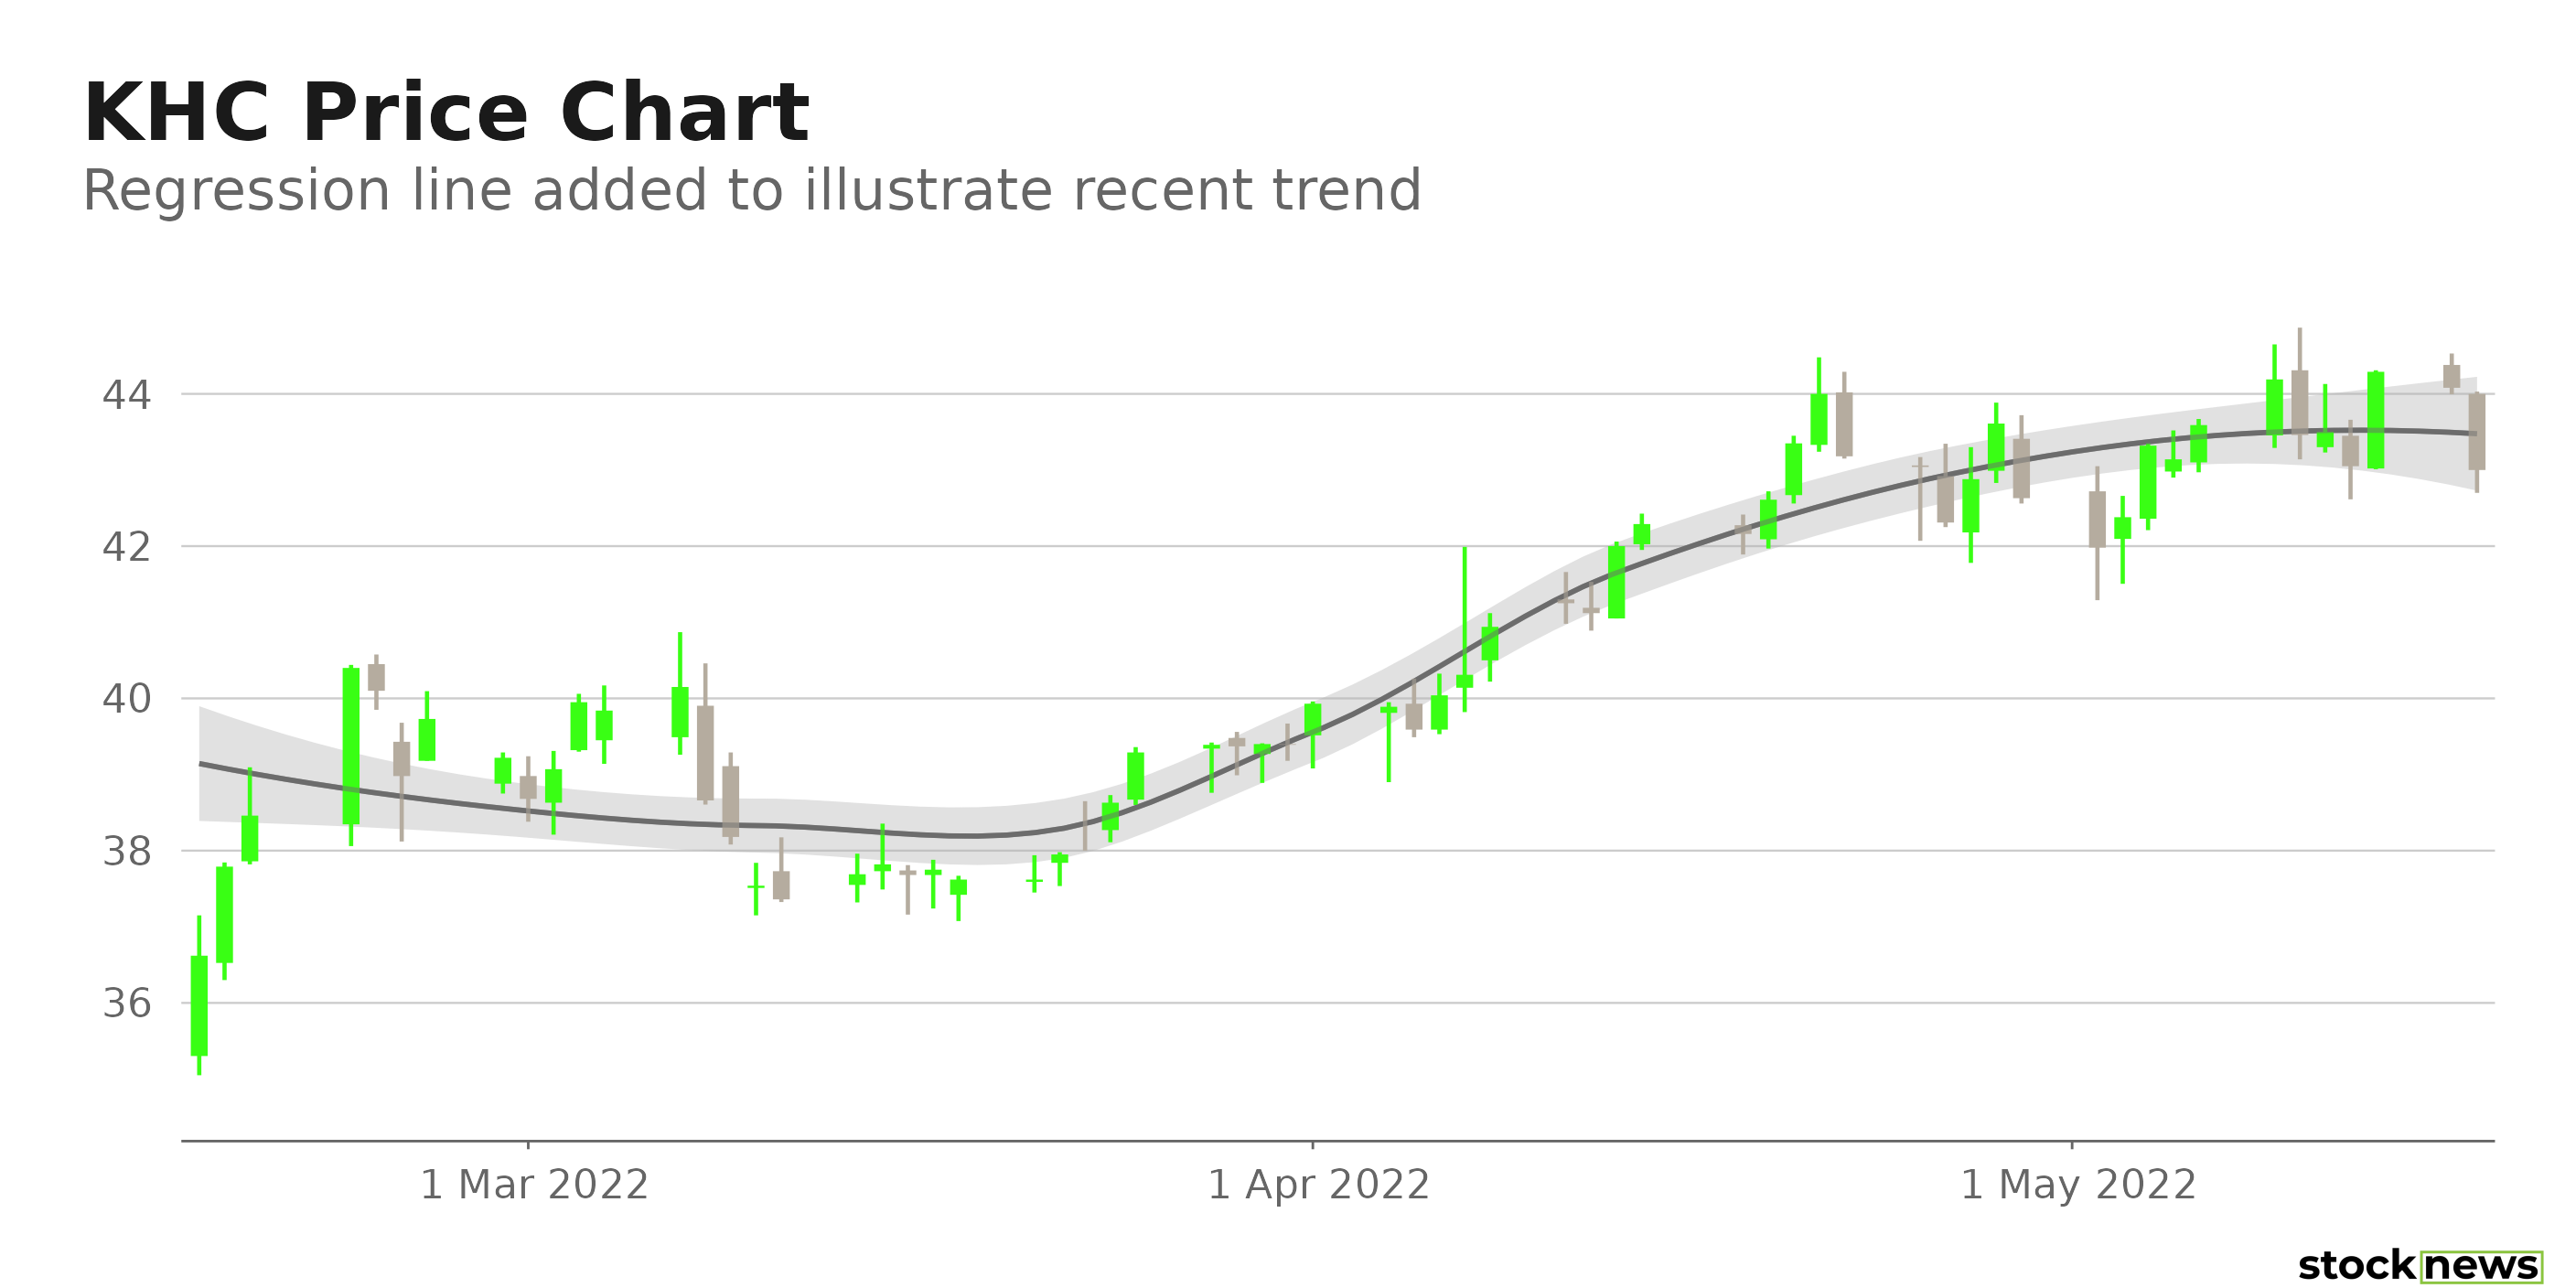
Chicago-based Kraft Heinz Company (KHC) manufactures and markets food and beverage products. Its products include condiments and sauces, cheese and dairy products, meals, meats, refreshment beverages, coffee, and other grocery products. The company also offers dressings, healthy snacks, and other categories, spices, and other seasonings. KHC’s four-year average dividend yield is 5%, and its current dividend translates to a 3.6% yield. It declared a $0.40 per share quarterly dividend to be paid on June 24, 2022. The stock has gained 22.7% in price year-to-date and 20.3% over the past three months to close the last trading session at $44.08.

On May 10, 2022, KHC announced that it would develop a paper-based, renewable, and recyclable bottle with Pulpex by using 100% sustainably sourced wood pulp. The partnership aligns well with KHC’s sustainable packaging ambitions, and it fits well with making all packaging globally recyclable, reusable, or compostable by 2025. It will also help it achieve net-zero greenhouse gas emissions by 2050.

KHC CEO Miguel Patricio said, “We still have work to do, more opportunity ahead, and we remain confident in our ability to deliver our plan for the year and our long-term growth strategy.” However, the company’s free cash flow during the first quarter declined 53.3% year-over-year to $272 million. The decline in its free cash flow may hamper the company’s growth prospects.

Here is what could influence KHC’s performance in the upcoming months:

Mixed Financials

KHC’s net sales declined 5.5% year-over-year to $6.04 billion for the first quarter, ended March 26, 2022. The company’s net income increased 37.5% year-over-year to $781 million. Also, its adjusted EBITDA declined 15.1% year-over-year to $1.34 billion. In addition, its adjusted EPS came in at $0.60, representing a 16.7% decrease year-over-year.

Stretched Valuation

In terms of forward EV/S, KHC’s 2.87x is 59.7% higher than the 1.80x industry average. And its 12.41x forward EV/EBITDA is 1.6% higher than the 12.20x industry average. And the stock’s 2.11x forward P/S is 76.7% higher than the 1.19x industry average.

Unfavorable Analyst Estimates

Analysts expect KHC’s EPS for the quarter ending June 30, 2022, to decrease 12.8% year-over-year to $0.68. Its revenue for fiscal 2022 is expected to decline 1.6% year-over-year to $25.62 billion. And its EPS is expected to decrease 1.5% per annum over the next five years.

Mixed Profitability

KHC’s trailing-12-month gross profit margin and net profit margin of 33.05% and 4.77%, respectively, are lower than the 34.63% and 5.32% industry average. And its 1.31% trailing-12-month ROA is 72.4% lower than the 4.74% industry average. Furthermore, the stock’s trailing-12-month 0.27% asset turnover ratio is lower than the 0.87% industry average. In addition, its trailing-12-month EBIT margin and EBITDA margin of 20.35% and 23.89%, respectively, are 138.1% and 96.7% higher than the 8.55% and 12.14% industry averages.

POWR Ratings Reflect Uncertainty

KHC has an overall C rating, which equates to a Neutral in our POWR Ratings system. The POWR Ratings are calculated by considering 118 distinct factors, with each factor weighted to an optimal degree.

Our proprietary rating system also evaluates each stock based on eight distinct categories. KHC has a C grade for Value, which is in sync with its 2.87x forward EV/S, which is 59.7% higher than the 1.80x industry average.

KHC has a C grade for Growth, consistent with analyst expectations that its EPS for fiscal 2022 will decrease 1.6% year-over-year to $25.62 billion.

KHC is ranked #42 among  87 stocks in the Food Makers industry. Click here to access KHC’s ratings for Momentum, Stability, Sentiment, and Quality.

Bottom Line

KHC’s dividend history makes it an attractive stock for investors looking to generate a steady income stream amid current market volatility. However, analysts expect its revenues to decline in fiscal 2022. Furthermore, it is currently trading at a higher valuation than its peers. So, we think it could be wise to wait for a better entry point in the stock.

How Does the Kraft Heinz Company (KHC) Stack Up Against Its Peers?

While KHC has an overall POWR Rating of C, one might want to consider investing in the following Food Makers stocks with an A (Strong Buy) and B (Buy) rating: Grupo Bimbo, S.A.B. de C.V. (GRBMF), Ajinomoto Co., Inc. (AJINY), and Marfrig Global Foods S.A. (MRRTY).

Want More Great Investing Ideas?

3 Stocks to DOUBLE This Year

Top 10 Stocks for 2022

Bear Market Scare? Read Before Your Next Trade

7 SEVERELY Undervalued Stocks

KHC shares were trading at $43.08 per share on Tuesday morning, down $1.00 (-2.27%). Year-to-date, KHC has gained 21.27%, versus a -14.40% rise in the benchmark S&P 500 index during the same period.

Since he was in grade school, Dipanjan was interested in the stock market. This led to him obtaining a master’s degree in Finance and Accounting. Currently, as an investment analyst and financial journalist, Dipanjan has a strong interest in reading and analyzing emerging trends in financial markets.

https://www.entrepreneur.com/article/427754


Is ContextLogic a Buy Under $2?

Currently trading at $1.54, popular mobile e-commerce platform ContextLogic (WISH) has seen its shares tumble in price over the past month on investor pessimism surrounding the company’s unimpressive first-quarter performance. And given that WISH continues to grapple with multiple near-term headwinds, is it worth betting on the stock at its current price level? Let’s find out.

shutterstock.com – StockNews

Online mobile e-commerce company ContextLogic Inc. (WISH) in San Francisco, operates the e-commerce platform Wish, which offers marketplace and logistics services to merchants. WISH’s shares have plummeted 24.9% in price over the past month and 52.2% year-to-date, driven down by the company’s underwhelming first-quarter earnings performance and continuing headwinds in its business due to reduced user retention and new buyer conversion. Furthermore, the company experienced significant operating losses because of increased advertising costs and brand development expenses.

Closing its last session at $1.54, the stock is trading 89.9% below its 52-week high of $15.18. With  global supply chain woes weighing heavily on the e-commerce player’s active buyers and revenue prospects, the stock could suffer a further pullback in the coming days.

Although WISH has been making efforts to ramp up advertising and launch new initiatives, including the launch of a Women’s Fashion Category, we think the company’s growing dependence on Chinese merchants as it continues to struggle with quality issues could make investors anxious about the stock.

Here is what could influence WISH’s performance in the near term:

Grappling With Challenges

The online mobile shopping platform operator’s monthly active users declined nearly 73% in the first quarter, ended March 31, 2022, compared to the first quarter ended March 31, 2021. In addition, its LTM active buyers declined by roughly 54% year-over-year. This could be primarily attributable to reduced digital advertising expenditures and a substantial decline in conversion.

Furthermore, last year, French regulators ordered search engines and online platforms to remove WISH from their listings due to concerns surrounding product safety. As the company continues to struggle with quality concerns and shipping issues that are disrupting the delivery of its merchants’ products to its users, the popular e-commerce site’s stock could take a hit.

Disappointing Financials

WISH’s total revenue came in at $189 million for the first quarter, ended March 31, 2022, down 76% year-over-year. Its core marketplace revenue declined 81%, while its logistics revenue declined 65%. Furthermore,  its operating loss stood at $62 million for the quarter, while its net loss came in at $60 million. The company’s cash flow from operating activities was negative $146 million, while its free cash flow stood at negative $148 million. In addition, WISH reported  adjusted EBITDA of negative $40 million, and its adjusted EBITDA margin came in at  negative 21%.

The company’s trailing-12-month ROTC, ROE, and ROA are negative 19.8%, 34.8%, and 26.1%, respectively. Also, its net income margin and EBITDA margin are negative 19.5% and 17.9%, respectively.

Weak Growth Expectation

Analysts expect WISH’s revenues to be $887.03 million in its fiscal 2022, indicating a 57.5% decline year-over-year. Furthermore, its EPS is expected to remain negative this year and next year. In addition, the negative $0.17 consensus EPS estimate indicates a 70% decline from its year-ago value. And its EPS is expected to decline 7% year-over-year in the current year to a negative $0.61.

POWR Ratings Reflect Bleak Prospects

WISH has an overall D rating, which translates to Sell in our POWR Ratings system. The POWR Ratings are calculated by considering 118 distinct factors with each factor weighted to an optimal degree.

Our proprietary rating system also evaluates each stock based on eight distinct categories. WISH has a C grade for Quality. This reflects the stock’s negative ROE, ROA, and ROTC.

In terms of Sentiment grade, the company has a D, reflective of a bearish analyst sentiment surrounding the stock. Also, it has an F grade for Stability.

Beyond the grades I have highlighted, one can check out additional WISH ratings for Value, Growth, and Momentum here. Among the 71 stocks in the F-rated Internet industry, WISH is ranked #53.

Bottom Line

In its recently released SEC filing, the mobile e-commerce operator stated that it expects losses from operations to continue for the near future as it suffers costs and expenses related to the development of its brand. In fact, the company’s poor financial health and a decline in user retention and conversion could negatively impact its growth. Furthermore, headwinds related to supply chain disruptions and quality issues and their impact on the company’s business have raised investor concerns surrounding the stock. So, we think it is best avoided now.

How Does ContextLogic (WISH) Stack Up Against its Peers?

While WISH has an overall D (Sell) rating in our proprietary rating system, one might want to consider taking a look at its industry peer, Yelp Inc. (YELP), which has an A (Strong Buy) rating.

What To Do Next?

If you would like to see more top stocks under $10, then you should check out our free special report:

3 Stocks to DOUBLE This Year

What gives these stocks the right stuff to become big winners?

First, because they are all low-priced companies with explosive growth potential, that excel in key areas of growth, sentiment and momentum.

But even more important is that they are all top Buy rated stocks according to our coveted POWR Ratings system, Yes, that same system where top-rated stocks have averaged a +31.10% annual return.

Click below now to see these 3 exciting stocks which could double (or more!) in the year ahead:

3 Stocks to DOUBLE This Year


WISH shares fell $1.54 (-100.00%) in premarket trading Monday. Year-to-date, WISH has declined -50.48%, versus a -15.16% rise in the benchmark S&P 500 index during the same period.


About the Author: Imon Ghosh

Imon is an investment analyst and journalist with an enthusiasm for financial research and writing. She began her career at Kantar IMRB, a leading market research and consumer consulting organization.

More…

The post Is ContextLogic a Buy Under $2? appeared first on StockNews.com

https://www.entrepreneur.com/article/427659


Is Allstate a Winner in the Insurance Industry?

Shares of leading insurance provider Allstate Corporation (ALL) have dipped in price recently as inflation continues to weigh heavy on its financials. Although the company has seen higher growth in premiums due to policy growth, given that increases in claim severity in a higher interest rate and a higher inflation rate environment could hurt its profitability, is it worth betting on the stock now? Let’s find out.

shutterstock.com – StockNews

Leading publicly held insurance provider The Allstate Corporation (ALL) in Northfield Township, Ill., offers property and casualty and other insurance products in the United States and Canada. The company reported premiums of $11 billion in the first quarter of 2022, up 6.5% year-over-year, driven by increased policy growth and an increase in average premiums. Also, solid investment income and earnings from its Protection Services and Health and Benefits business segment could allow the insurer to grow its competitive position in the market significantly.

However, ALL’s shares have declined 8.5% in price over the past month and 8% over the past year. The stock is currently trading lower than its 50-day moving average of $133.59 but higher than its 200-day moving average of $126.17, which does not indicate a robust uptrend. Because the current inflationary environment could continue to affect its bottom-line growth adversely, the insurance provider’s stock price could pullback in the near term.

While the company’s expense reduction goals could help normalize its operations amid a volatile environment, finding more growth may be challenging, given its rising losses on fixed-income sales and lower auto insurance margins.

Here is what could influence ALL’s performance in the coming months:

Insurance Industry Headwinds

According to the latest report from the Bureau of Labor Statistics, the consumer price index for all items rose 8.3% from a year ago, still close to the highest level since the summer of 1982. In response to rising inflation, the Federal Reserve has increased its benchmark interest rate by seventy five basis points so far this year. The combination of a higher interest rate and inflationary pressure could lead to rising insurance claims costs. As a result, the financials and operations of insurance providers like ALL could be negatively impacted. Furthermore, a jump in the auto and homeowners claims severity, mainly due to rising inflationary impact, could affect ALL’s underwriting income and profitability.

Mixed Growth Potential

A $44.15 billion consensus revenue estimate for its fiscal 2022 represents a 6.8% increase year-over-year. Also, the company’s revenue is expected to increase 5.1% from the prior-year quarter to $46.39 billion next year. But analysts expect ALL’s EPS to decline 73.9% year-over-year to $0.99 in the current quarter, ending June 30, 2022. Also, its EPS is estimated to decline 32.3% in its fiscal year 2022. However, it is expected to increase 41.9% in its fiscal 2023 and at the rate of 5.4% over the next five years.

Mixed Financials

ALL’s net revenue declined 0.9% year-over-year to $12.3 billion for the first quarter ended March 31, 2022, due primarily to losses on fixed-income sales and equity valuations in 2022. Its market-based investment income declined 8.8% year-over-year to $323 million, while its total return on investment portfolio stood at a negative 2.8%. The insurance company’s total costs and expenses came in at $11.54 billion, representing a 22.5% increase year-over-year. But ALL’s Protection Services revenue rose 13.6% from the prior-year quarter to $627 million over this period, driven mainly by Allstate Protection Plans. Furthermore, its premium earned from property liability rose 6.1% year-over-year to $10.5 billion, due to higher average premiums and item growth in the National General and Allstate brands.

Stretched Valuation

In terms of non-GAAP forward P/E, ALL is currently trading at 14.11x, which is 40.3% higher than the 10.06x  industry average. Its 2.60x forward non-GAAP PEG ratio is 140.6% higher than the 1.08 industry average Also, ALL’s 1.65x forward Price/Book ratio is 51.3% higher than the 1.09x industry average. And the company’s 8.47x trailing-12-month Price/Cash Flow ratio is 11.4% higher than the 7.61x industry average.

POWR Ratings Reflect Uncertainty

ALL has an overall C rating, which translates to Neutral in our POWR Ratings system. The POWR Ratings are calculated by considering 118 distinct factors with each factor weighted to an optimal degree.

Our proprietary rating system also evaluates each stock based on eight distinct categories. ALL has an F grade for Growth and a C for Value. The stock’s mixed growth prospects and higher-than-industry valuation multiples justify these grades.

In terms of Momentum Grade, ALL has a C. The stock’s price return over the past month is consistent with the grade.

Beyond the grades I have highlighted, one can check out additional ALL ratings for Sentiment, Stability, and Quality here. ALL is ranked #24 of 56 stocks in the C-rated Insurance – Property & Casualty industry.

Bottom Line

While a significant surge in the premiums earned from both the National General and Allstate brands and earnings from Protection Services and Health and Benefits segment have helped ALL progress in its growth strategy, growing inflationary pressure and the Fed’s efforts to raise interest rates aggressively could cause the stock to retreat in the near term. Furthermore, the company’s unstable growth potential and a higher claims severity could add to investors’ concerns surrounding the stock. So, we think investors should wait for some improvement in its prospects before investing in the stock.

How Does the Allstate Corporation (ALL) Stack Up Against its Peers?

While ALL has a C rating in our proprietary rating system, one might want to consider taking a look at its industry peers, Protective Insurance Corporation (PTVCB), and MS&AD Insurance Group Holdings, Inc. (MSADY) which have an A (Strong Buy) rating.


ALL shares were unchanged in premarket trading Monday. Year-to-date, ALL has gained 9.73%, versus a -15.16% rise in the benchmark S&P 500 index during the same period.


About the Author: Imon Ghosh

Imon is an investment analyst and journalist with an enthusiasm for financial research and writing. She began her career at Kantar IMRB, a leading market research and consumer consulting organization.

More…

The post Is Allstate a Winner in the Insurance Industry? appeared first on StockNews.com

https://www.entrepreneur.com/article/427658


Bulls on Parade?

Investors were drawn to the border of bear market territory like a moth to a flame. And just when they were about to cross into bear market territory below 3,855 a rally ensued late Thursday. That got further extended Friday rising all the way to 4,023.89. Is this just a bear market rally or truly the end of this dramatic 4 month correction? That discussion will be at the heart of today’s POWR Value commentary. Read on below for more….

shutterstock.com – StockNews

(Please enjoy this updated version of my weekly commentary from the POWR Value newsletter).

Let’s wind the clock back a week to our previous commentary from 5/6: 2 Divergent Paths for the Stock Market from Here.

This was a lengthy piece talking about what it would mean to break below 3,855 into bear market territory versus bouncing at that level with resumption of the bull market.

Not surprisingly stocks got ever so close at 3,858 before support kicked in leading to a +4.3% rally into Friday’s close.

Unfortunately, this support is NOT proof that the bear market threat is over. On the other hand it very well could be the obituary for the nasty 2022 correction.

This brings us to a new fork in the road with 2 potential paths. Let’s review those possibilities that are nearly equal likelihood in my book:

Bulls on Parade: FOMO Rally

Imagine a 2-3 weeks long rally where stocks just climb higher each day. Bears will hold out at first. But bit by bit will start giving into their FOMO fears.

Plus all the dry powder in cash starts to come off the sidelines.

It would not be unusual for stocks to advance 10-15% in that time frame and crossing back over all the key moving averages leaving no doubt that the bull market was back in charge.

Before you get too excited, we need to review the other equally plausible scenario that will temper your enthusiasm…

Consolidate Here and Delay Bull/Bear Conclusion

Remember that relief rallies are typically +3-5% before testing lower once again. And that’s pretty much the size of the bounce we got Thursday afternoon through end of Friday.

So it’s not hard to imagine that we spend time in a trading range between the border of bear market territory at 3,855 and 4,100.

Meaning that bulls and bears battle it out a bit longer before making the final determination if we do tumble into bear market territory or bull re-emerges.

We all would prefer the former choice. And can even make logical presentations showing why that is the more likely outcome.

Unfortunately we do have to appreciate that the combination of high inflation and hawkish Fed is not the most stock friendly environment.

Not a guarantee of a bear market…but fertile soil that could support the growth of bearish conditions.

Add it all up and we are not that far off the divergent paths discussed last week. And that keeps us in wait and see mode.

If the bull extends from here, then we have some uber-attractive stocks still in the portfolio that shined the last two days and would blossom even further in that environment.

Any stock that does not quickly shed its former red arrows will be replaced with stocks with greener horizons.

If we do devolve into a bearish market, then we know how to get more defensive as laid out last week.

We value investors typically understand that patience is a virtue. And you will need to lean into that reservoir of patience to make it through this next leg of the market.

Stay calm and carry on!

 What To Do Next?

If you’d like to see more top value stocks, then you should check out our free special report:

7 SEVERELY Undervalued Stocks

What makes these stocks great additions to any portfolio?

First, because they are all undervalued companies with exciting upside potential.

But even more important, is that they are all Strong Buys according to our coveted POWR Ratings system. Yes, that same system where top-rated stocks have averaged a +31.10% annual return.

Click below now to see these 7 stellar value stocks with the right stuff to outperform in the coming months.

7 SEVERELY Undervalued Stocks

All the Best!

Steve Reitmeister
CEO StockNews.com & Editor of POWR Value trading service


SPY shares closed at $401.72 on Friday, up $9.38 (+2.39%). Year-to-date, SPY has declined -15.16%, versus a % rise in the benchmark S&P 500 index during the same period.


About the Author: Steve Reitmeister

Steve is better known to the StockNews audience as “Reity”. Not only is he the CEO of the firm, but he also shares his 40 years of investment experience in the Reitmeister Total Return portfolio. Learn more about Reity’s background, along with links to his most recent articles and stock picks.

More…

The post Bulls on Parade? appeared first on StockNews.com

https://www.entrepreneur.com/article/427598


Comcast vs. Warner Bros. Discovery: Which Entertainment Stock is a Better Buy?

With the increasing penetration of blockchain-based digital assets and streaming services, the entertainment industry is poised to grow. So, Comcast Corporation (CMCSA) and Warner Bros. Discovery (WBD) should benefit. But which of these two stocks is a better buy now? Read more to learn our view.

shutterstock.com – StockNews

Comcast Corporation (CMCSA) in Philadelphia, Pa., operates as a media and technology company worldwide. It operates through Cable Communications; Media; Studios; Theme Parks; and Sky segments. In comparison, Warner Bros. Discovery, Inc. (WBD) in New York City is a media company that provides content across various distribution platforms in approximately 50 languages worldwide. It also produces, develops, and distributes feature films, television, gaming, and other content in different physical and digital formats

Despite the recent COVID-19 spike and inflation concerns, entertainment providers are in high demand due to the rising trend of watching videos and other content online. Furthermore, advancements in Web3 and growing internet penetration across the globe are expected to drive the entertainment industry’s growth. 

According to a report by Market Reports World, the global entertainment and media market is expected to grow at a CAGR of 5.9% between 2022 and 2028. Therefore, both CMCSA and WBD should benefit.

But which of these two stocks is a better buy now? Let’s find out.

Latest Developments

On May 10, 2022, CMCSA announced that its board of directors declared a quarterly dividend of $0.27 per share on its common stock. The quarterly dividend is payable on July 27, 2022, to shareholders of record as of the close of business on July 6, 2022.

On May 10, 2022, WBD and Roku, Inc. (ROKU) announced that discovery+, the definitive non-fiction, real-life subscription streaming service, has launched as a Premium Subscription on The Roku Channel. Gabriel Sauerhoff, SVP of Digital Distribution and Commercial Partnerships, WBD, said, “We’re pleased to deepen our relationship with Roku, a valued partner, and expand access of discovery+ on the Roku platform through the launch on The Roku Channel.”

Recent Financial Results

CMCSA’s revenue increased 14% year-over-year to $31.01 billion for its fiscal first quarter, ended March 31, 2022. The company’s adjusted net income grew 10.5% year-over-year to $3.90 billion. Also, its adjusted EPS came in at $0.86, up 13.2% year-over-year.

WBD’s revenues increased 13% year-over-year to $3.16 billion for its fiscal first quarter, ended March 31, 2022. The company’s net income grew 225.7% year-over-year to $456 million. Also, its EPS came in at $0.69, up 228.6% year-over-year.

Past and Expected Financial Performance

CMCSA’s revenue and total assets have grown at CAGRs of 6.8% and 2.3%, respectively, over the past three years. Analysts expect CMCSA’s revenue to increase 5.5% in its fiscal year 2022 and 1.7% in its fiscal 2023. The company’s EPS is expected to grow 9.5% for the quarter ending June 30, 2022, and 11.8% in its fiscal 2022. Furthermore, its EPS is expected to grow at a 13.5% rate per annum over the next five years.

In comparison, WBD’s revenue and total assets have grown at CAGRs of 4.7% and 1.4%, respectively, over the past three years. The company’s revenue is expected to increase 276.4% in its fiscal 2022 and 10.5% in fiscal 2023. However, its EPS is expected to decline 101.1% for the quarter ending June 30, 2022, and 71.8% in fiscal 2022. WBD’s EPS is expected to increase at a 7.4% rate per annum over the next five years.

Profitability

CMCSA’s trailing-12-month revenue is 9.57 times what WBD generates. CMCSA is also more profitable, with gross profit and net income margins of 66.64% and 11.96%, respectively, compared to WBD’s 61.12% and 10.53%.

Furthermore, CMCSA’s 14.67%, 4.83%, and 6.68% respective ROE, ROA, and ROTC are higher than WBD’s 11.33%, 3.90%, and 4.73%.

Valuation

In terms of forward non-GAAP P/E, WBD is currently trading at 14.40x, which is 29.7% higher than CMCSA’s 11.10x. However, CMCSA’s 7.39x forward EV/EBITDA  is 52.1% higher than WBD’s 4.86x.

POWR Ratings

CMCSA has an overall A rating, which equates to a Strong Buy in our proprietary POWR Ratings system. In contrast, WBD has an overall rating of C, which translates to a Neutral. The POWR Ratings are calculated considering 118 distinct factors, with each factor weighted to an optimal degree.

CMCSA has a B grade for Stability, which is in sync with its 0.93 beta. In comparison, WBD has a C grade for Stability, which is consistent with its 1.13 beta.

Of the nine stocks in the Entertainment – TV & Internet Providers industry, CMCSA is ranked first. However, WBD is ranked #4 out of 21 stocks in the Entertainment – Media Producers industry.

Beyond what I have stated above, we have also rated the stocks for Growth, Value, Quality, Momentum, and Sentiment. Click here to view all the CMCSA ratings. Also, get all the WBD ratings here.

The Winner

Since the entertainment industry is expected to grow exponentially due to the increasing adoption of smart homes and advancements in television technology, both CMCSA and WBD should benefit. However, it is better to bet on CMCSA now because of its higher profit margin and better growth prospects.

Our research shows that odds of success increase when one invests in stocks with an Overall Rating of Strong Buy or Buy. View all the other top-rated stocks in the Entertainment – TV & Internet Providers industry here. Also, click here to access all the top-rated stocks in the Entertainment – Media Producers industry. 


CMCSA shares were trading at $41.32 per share on Friday afternoon, down $0.07 (-0.17%). Year-to-date, CMCSA has declined -17.03%, versus a -15.68% rise in the benchmark S&P 500 index during the same period.


About the Author: Nimesh Jaiswal

Nimesh Jaiswal’s fervent interest in analyzing and interpreting financial data led him to a career as a financial analyst and journalist. The importance of financial statements in driving a stock’s price is the key approach that he follows while advising investors in his articles.

More…

The post Comcast vs. Warner Bros. Discovery: Which Entertainment Stock is a Better Buy? appeared first on StockNews.com

https://www.entrepreneur.com/article/427586


Intercontinental Exchange: Buy, Sell, or Hold?

Intercontinental Exchange (ICE) is set to acquire data analytics firm Black Knight (BKI) to support its mortgage servicing business. However, the stock has plummeted nearly 30% in price this year. So, is the stock a buy now? Read on to learn our view.

shutterstock.com – StockNews

Financial services company Intercontinental Exchange, Inc. (ICE) operates regulated exchanges, clearinghouses, and listings venues for commodity, financial, fixed income, and equity markets. The company operates through the three broad segments of Exchanges; Fixed Income and Data Services; and Mortgage Technology.

ICE expects its operating expenses for the second quarter to be in line with its last reported quarter. It expects its operating expenses to come in $900 – $910 million, compared with the first quarter’s $907 million. The company expects a non-operating expense between $135 – $140 million for the second quarter.

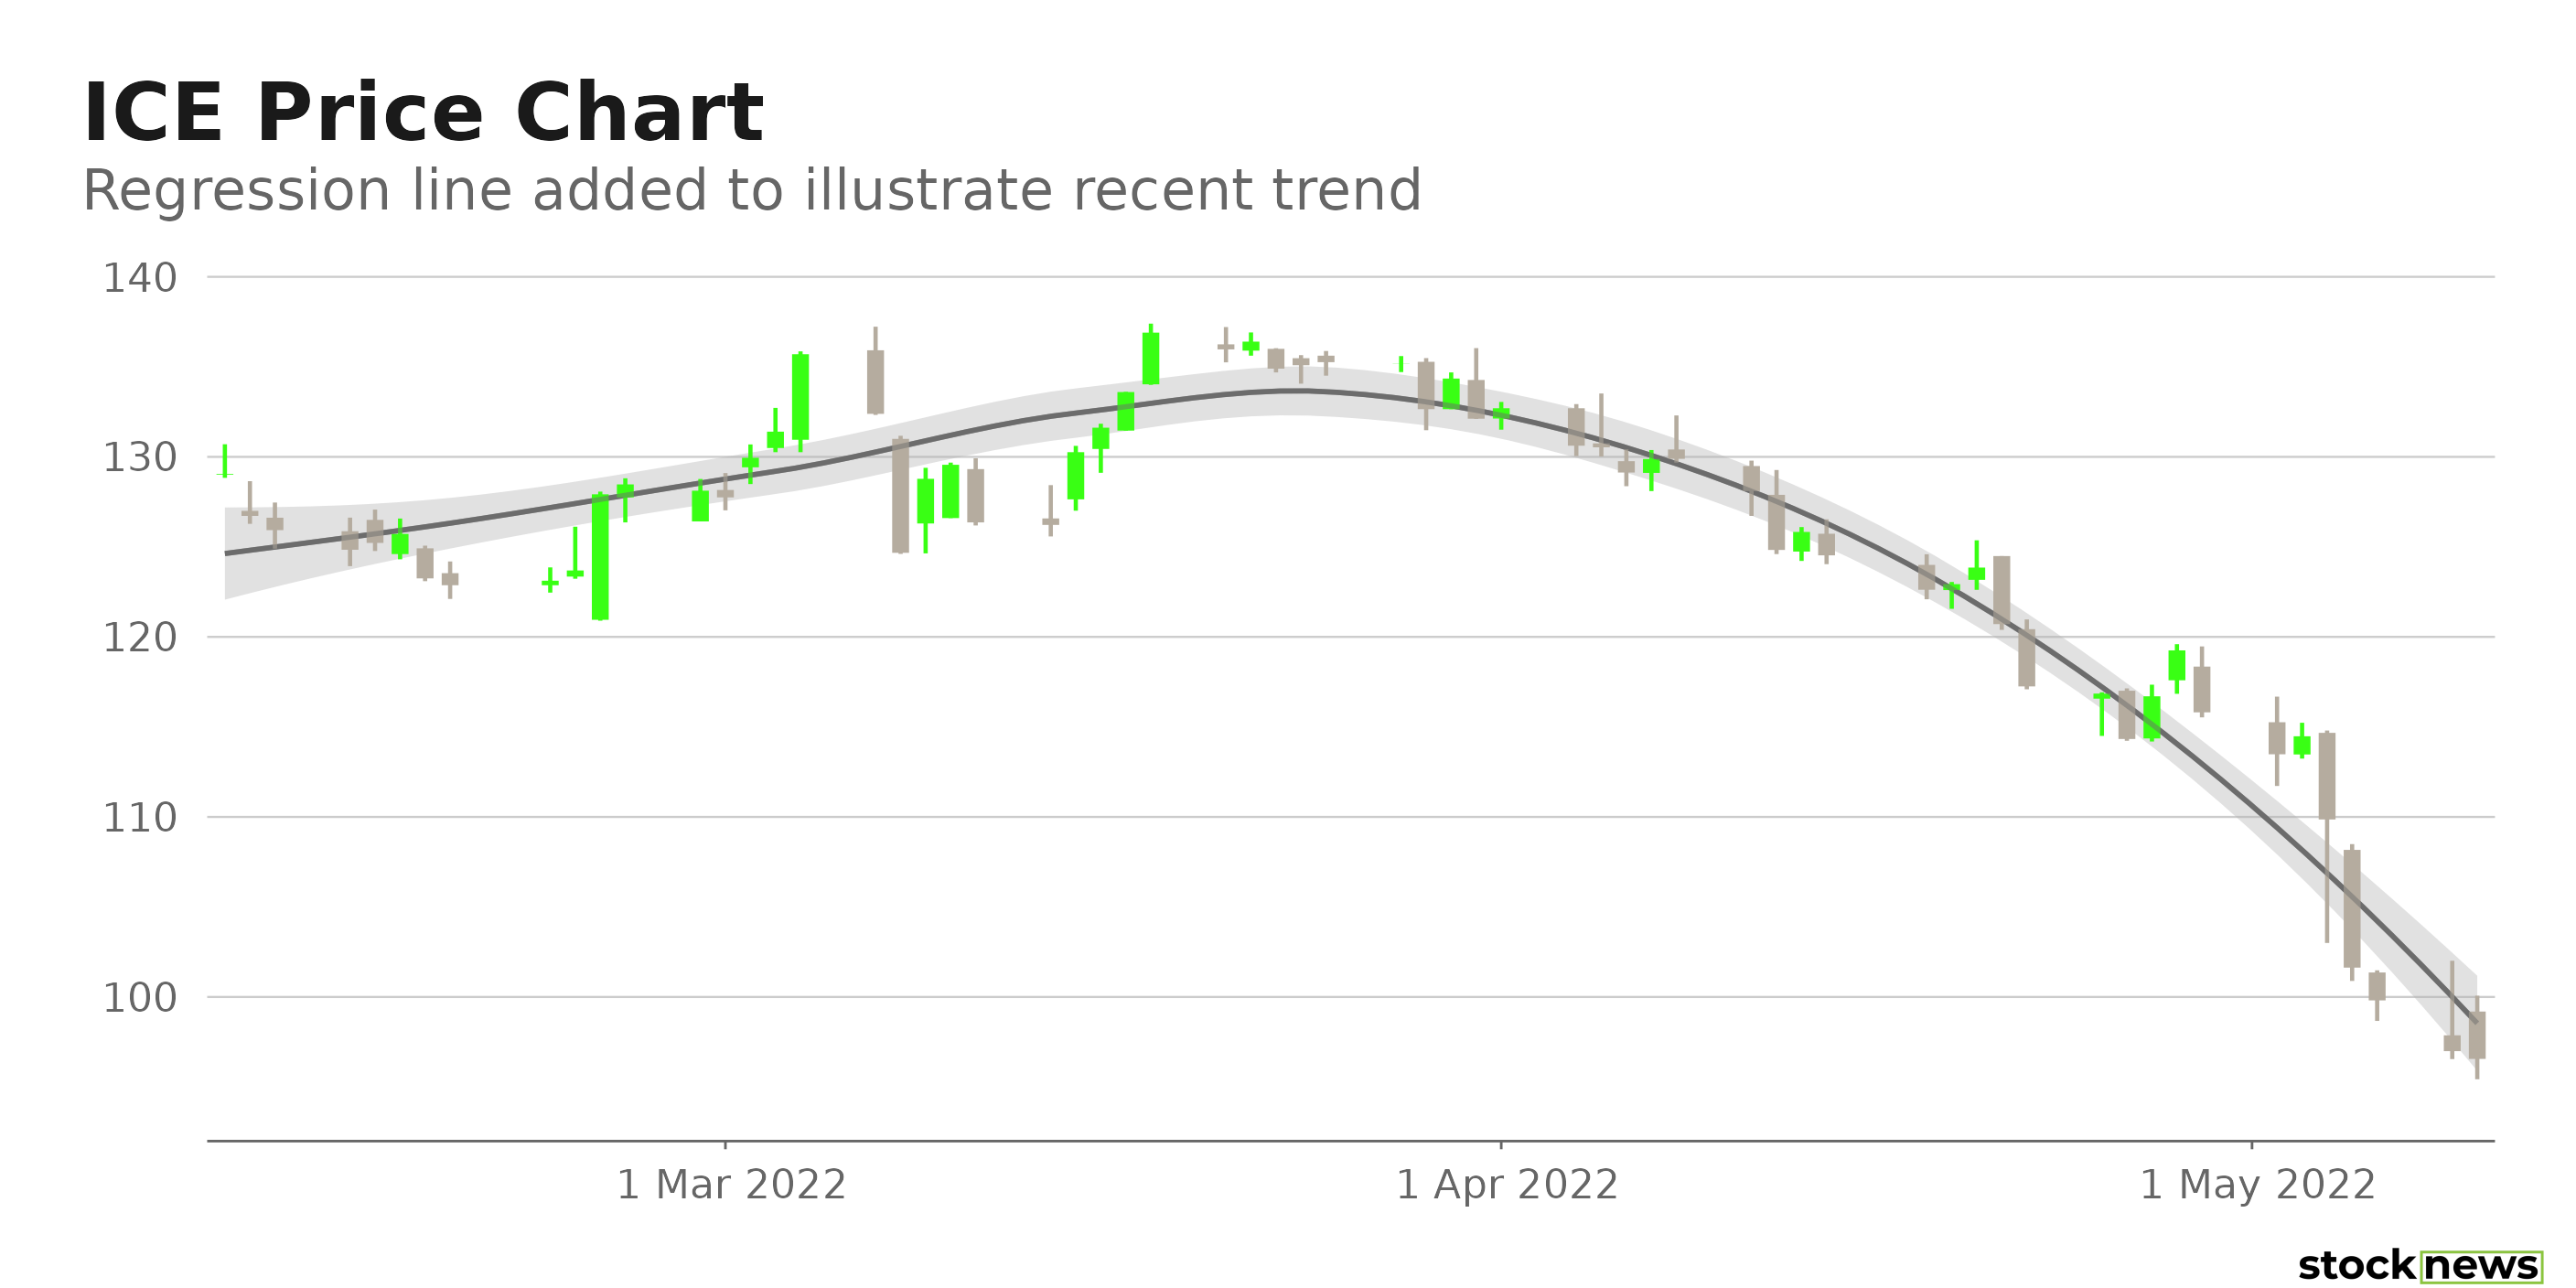
ICE’s stock has declined 15.5% in price over the past year and 29.1% year-to-date to close yesterday’s trading session at $96.99. It has declined 25.3% over the past month.

Here are the factors that could shape ICE’s performance in the near term.

Latest Acquisition

ICE, New York Stocks Exchange’s parent company, recently announced that it would acquire software and data analytics company Black Knight, Inc. (BKI) to support its mortgage servicing business. The acquisition is not cheap. The company bagged the deal for $13.10 billion. However, it may be some time before ICE realizes substantial gains from this venture, because the companies are not expected to close the transaction until the first half of 2023.

Stretched Valuations

In terms of its forward P/E, ICE is currently trading at 21.30x, which is 105.2% higher than the 10.38x industry average. The stock’s 9.34 forward EV/Sales multiple is 230.2% higher than the 2.83 industry average. In terms of its forward Price/Sales, ICE is trading at 7.27x, which is 150.9% higher than the 2.90x industry average. Its 2.27 forward Price/Book multiple is 105.4% higher than the 1.11 industry average.

POWR Ratings Reflect Bleak Prospects

ICE’s POWR Ratings reflect its bleak outlook. The stock has an overall D rating, which equated to Sell in our proprietary rating system. The POWR Ratings are calculated by considering 118 distinct factors, with each factor weighted to an optimal degree.

ICE has a Value grade of D, which is in sync with its stretched valuations. The stock has a C grade for Stability, which is consistent with its 0.84 five-year monthly beta.

In the 12-stock Financial Marketplaces industry, ICE is ranked #11. The industry is rated F.

Click here to see the additional POWR Ratings for ICE (Growth, Momentum, Sentiment, and Quality).

View all the top stocks in the Financial Marketplaces industry here.

Bottom Line

ICE is expected to venture further into the digital mortgage business by acquiring BKI. However, that transaction is not likely to be completed before next year. Moreover, according to Investor Observer, ICE has an overall rank of #42 in its system, which means that 58% of stocks appear more favorable than ICE. Also, the stock looks overvalued at its current price. Hence, I think it might be better to avoid the stock now.


ICE shares were trading at $96.65 per share on Tuesday afternoon, down $0.34 (-0.35%). Year-to-date, ICE has declined -29.13%, versus a -15.65% rise in the benchmark S&P 500 index during the same period.


About the Author: Anushka Dutta

Anushka is an analyst whose interest in understanding the impact of broader economic changes on financial markets motivated her to pursue a career in investment research.

More…

The post Intercontinental Exchange: Buy, Sell, or Hold? appeared first on StockNews.com

https://www.entrepreneur.com/article/427281


Bull vs. Bear Market?

Yes, I know that this commentary normally comes out Friday evenings. But life got in the way yesterday and had to push it out to this morning. Gladly the S&P 500 (SPY) was closed and we do not miss a beat on getting ready for the week ahead. Speaking of which, from here I see 2 very different paths for the market. One a glorious bounce. One a descent into bear market. Which will it be…and what will we do about it? That is what we will cover in this week’s POWR Value commentary. Read on below for more….

shutterstock.com – StockNews

(Please enjoy this updated version of my weekly commentary from the POWR Value newsletter).

The starting point for today’s discussion is to tackle my fundamental review of the bull and bear case which was shared in detail this Wednesday 5/4 for the Platinum Members monthly webinar (watch it here >).

Watching this 30 minute presentation is time well spent. But if you are short on time right now, then here is the summary…

Both bull and bear market outcomes are possible from here. Sometimes it’s easier to see the reasons to be bearish because fear is a much stronger motivator than greed.

And in that camp we have high inflation + hawkish fed + bad market sentiment = a nasty elixir that could devolve into bear market.

On the other hand, history shows that it is much harder than you imagine to create a recession and bear market and that the bull wins out the majority of the time. That is why we stay in bullish conditions 5-6X more than bearish conditions over our lifetimes.

Summing it up, I think the case for bull market is stronger than bear market. The main reason for that is that there is a lot of one time “nonsense” inside the -1.4% GDP read for Q1 that does not really tell the story of the economy’s health.

That is why corporate leaders are in general raising guidance for the rest of the year after their Q1 earnings reports. These business executives are adept at knowing the pulse of their customers.

And if they saw any whiffs of weakness, they would say so in their outlooks to lower guidance and thus make it easier to beat estimates going into the next quarterly report.

On top of that you have the well respected GDPNow model from the Atlanta Fed which is currently flashing a +2.2% reading for Q2 GDP. The Blue Chip Consensus panel of economists is a few ticks higher at +2.8%.

Adding up these points is to refute the idea of a looming recession which is the main cause of bear markets.

Unfortunately devolving into bear market conditions down the road is quite possible because sometimes the leading cause of bear markets is not a weak economy…but rather weak stock market which acts as a catalyst to slow the economy in the future.

This one is a little bit of a brain teaser at first. So read it twice to make sure that the idea sinks in.

The original view of the market was that investors as a group were GREAT prognosticators of the future. That they often predicted recessions 4-6 months in advance by selling off during good conditions only for the evidence of the recession to unveil itself down the road.

Meaning that a near term correction during good times was often times a leading indicator of recession and bear market down the road.

More and more evidence shows this is not really the case. Perhaps here is the more logical sequence of events…

The market can sell off at any time for any reason. And typically bull markets endure 1-2 harsh corrections per year before bouncing back on their way to new highs.

However, sometimes those corrections last a bit longer. And put more strain on investor psyche. Which starts to give investors a pessimistic view of what the future holds.

In particular, the people who run the largest corporates are also amongst the wealthiest in the country. No doubt they have a high % of their net worth tied up in the stock market and are well aware of poor stock price conditions.

Thus, the longer these downturns go on…the more damage they see in their portfolio…the more pessimistic they may become on their business outlook.

Thus, it is when those pessimistic views from the stock market start effecting their business decisions…like lowering spending or delaying major investments in company expansion…that is what starts to chip away at economic growth…perhaps enough to cause a recession.

The point is that poor market conditions can very well be the catalyst behind future recessions and bear markets. And indeed this nasty start to 2022 could be just one of those kinds of market conditions.

When you add it all up you still have to appreciate that bull market odds are higher than bear market…but the latter is a very possible outcome which puts us in “wait and see” mode.

This is what leads to 2 divergent paths for the market from here. Let’s quickly spell them out along with the game plan for how to invest in each environment.

Bear Market Path: Drop Below 3,855

I sense that there will be serious support at 4,000 leading to a bounce. And yes, it may be the lasting bounce and we never test lower again. But the true line of demarcation between bull and bear is 3,855…exactly 20% under the all time highs.

If we break below with gusto, and keep heading lower, then we are indeed in bear market territory and that will likely extend to the average 34% decline found in bear markets…maybe a little further given that stocks did achieve higher than normal valuations during this bull cycle and thus more fat may need to be trimmed before bottom is found.

In this scenario investors will want to get more defensive on the break below 3,855. That starts by selling all aggressive stock positions (smaller cap, higher beta, cyclical industries) as they will come down the most.

Storing that extra money in cash is fine until you want to start picking your spots near bottom. However, more speculative investors may want to consider shorting the market with inverse ETFs to make money as the market heads lower.

We will not be doing that in the POWR Value service because it is outside the charter of the publication, which is to always be in the best value stocks…but like I am doing now I will give advice on how you can do that on your own even if not “official” positions in the portfolio.

On the other hand, my Reitmeister Total Return service is precisely built for that bear market flexibility. So if you do not have access to the service, then learn more about it here.

Now let’s consider the flip side of that investment coin…

Bull Market Path: Stay Above 3,855

As stated earlier, this is the more likely path given the economic evidence in hand. However, when you have a correction this deep and going on for this long, then it will likely demand a glorious finish. The kind of finale that shakes all investors to their core.

Perhaps that just happens with a fight over 4,000 where major support will be found. Yet it is not hard to imagine a drop all the way down to the border of bear market territory at 3,855.

That is the kind of drop that strikes fear in the heart of investors that compels a total “I give up” capitulation. And in the dawn of that surrender is a glorious capitulation rally that marks the end of the correction and resumption of the bull market.

In this case you just hold on to the market like a rodeo rider. No matter how much it bucks and tries to throw you off…the tighter you hold on to still be there when that capitulation rally comes.

That’s because that rally will be fast and furious to the upside. Therefore, to be in cash at that time…or net short…is to destroy your entire year as a 10%+ bounce in just a weeks time is not out of the question.

In this case you simply hold onto your favorite stocks with a healthy blend of attractive growth and tremendous upside to fair value. Those will bounce the most as investors rush back in. And yes, these are exactly the kinds of stocks we have inside POWR Value.

I know it’s not easy reading this commentary as both the bullish and bearish outcomes are such realistic possibilities yet 180 degrees different from each other. But truly there is no better advice I can give but “wait and see” as we have the right contingency plans in place for when that moment of truth comes.

I promise to do my best to help us get through this trying time and onto calmer shores.

Stay tuned for what comes next…

If you’d like to see more top value stocks, then you should check out our free special report:

7 SEVERELY Undervalued Stocks

What makes these stocks great additions to any portfolio?

First, because they are all undervalued companies with exciting upside potential.

But even more important, is that they are all A rated Strong Buys according to our coveted POWR Ratings system. Yes, that same system where top-rated stocks have averaged a +31.10% annual return.

Click below now to see these 7 stellar value stocks with the right stuff to outperform in the coming months.

7 SEVERELY Undervalued Stocks

All the Best!

Steve Reitmeister
CEO StockNews.com & Editor of POWR Value trading service


SPY shares closed at $411.34 on Friday, down $-2.47 (-0.60%). Year-to-date, SPY has declined -13.13%, versus a % rise in the benchmark S&P 500 index during the same period.


About the Author: Steve Reitmeister

Steve is better known to the StockNews audience as “Reity”. Not only is he the CEO of the firm, but he also shares his 40 years of investment experience in the Reitmeister Total Return portfolio. Learn more about Reity’s background, along with links to his most recent articles and stock picks.

More…

The post Bull vs. Bear Market? appeared first on StockNews.com

https://www.entrepreneur.com/article/427066