The shares of leading networking solutions company NVIDIA (NVDA) have been plummeting due to bearish market sentiment amid several macroeconomic headwinds. So, because the markets remain under pressure as the Fed gears up to increase benchmark interest rates again this month, will NVDA be able to regain forward momentum soon? Read more to find out.
shutterstock.com – StockNews
NVIDIA Corporation (NVDA) in Santa Clara, Calif., is a leading semiconductor and networking solutions company based in the United States. The company operates in two segments: Graphics; and Computing and Networking. Its products have applications in gaming devices, data centers, and automotive industries. NVDA has an ISS Governance QualityScore of 6, indicating relatively high governance risk.
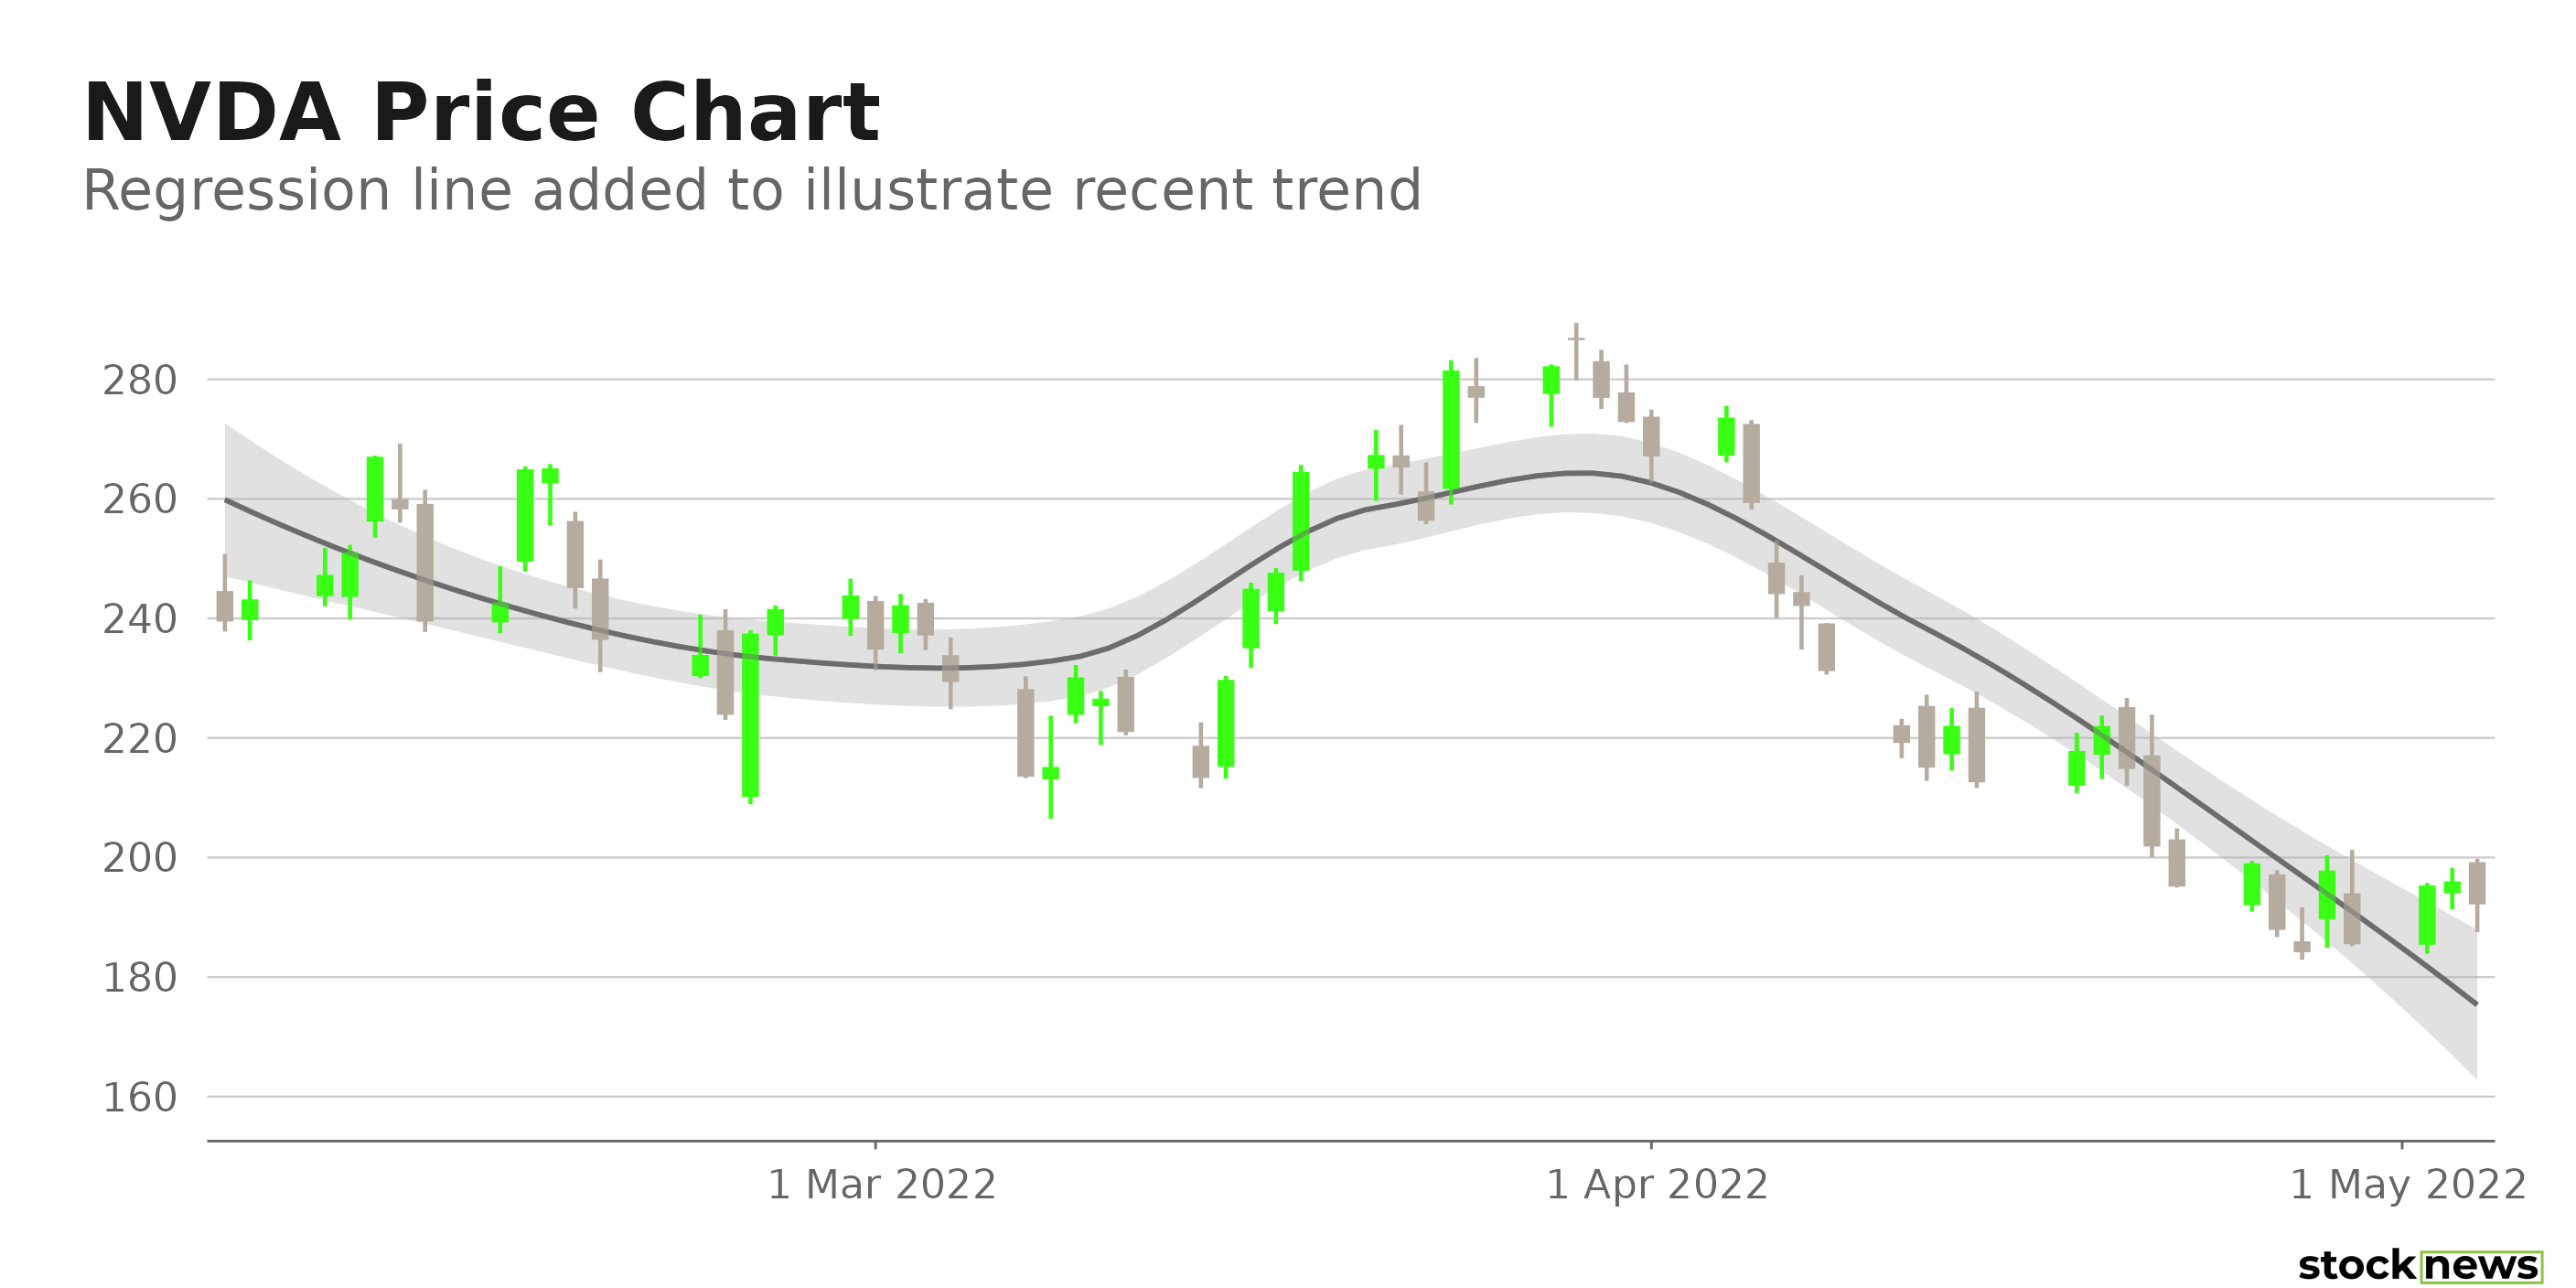
Shares of NVDA have declined 35.9% in price year-to-date and 29.3% over the past month to close yesterday’s trading session at $196.02.
The ongoing market correction combined with bearish investor sentiment amid declining demand for personal computers has caused the stock to lose momentum so far this year.
Here is what could shape NVDA’s performance in the near term:
Impressive Growth Story
NVDA’s revenues have increased at a 32% CAGR over the past three years and at a 31.3% CAGR over the past five years. The company’s EBITDA and net income have risen CAGRs of 40.2% and 33%, respectively, over the past three years. In addition, its EPS has grown at a 32.4% rate per annum over the past three years and at a rate of 43.1% per annum over the past five years. NVDA’s levered free cash flow has improved at a 54.2% CAGR over the past three years. And its EBITDA and net income have risen at CAGRs of 39.5% and 42.4%, respectively, over the past five years. Its EPS has increased at a 43.1% rate per annum over the past five years.
NVDA’s trailing-12-month revenues increased 61.4% year-over-year, while its net income rose 125.1% year-over-year. Also, the company’s trailing-12-month EPS and levered free cash flow have improved 122.5% and 73.2%, respectively, year-over-year. Its trailing-12-month total assets rose 100% year-over-year.
Bullish Growth Prospects
Analysts expect NVDA’s revenues to increase 43% year-over-year in its fiscal first quarter (ended April 30, 2022). Its $1.29 consensus EPS estimate for the about-to-be-reported quarter indicates a 41.5% improvement from the same period last year. In addition, the company’s revenues and EPS are expected to rise 29.9% and 30.6%, respectively, year-over-year to $8.45 billion and $1.36 in the current quarter.
The Street expects NVDA’s revenues to rise 29.2% year-over-year in the current year and 17.2% next year. Also, the company’s EPS is expected to improve by 27% in the current year and 19.9% next year.
Premium Valuation
In terms of forward non-GAAP P/E, NVDA is currently trading at 34.78x, which is 85.9% higher than the 18.71x industry average. In addition, the stock is currently trading 14.11 times its forward sales, which is 357.4% higher than the3.09 industry average.
Also, NVDA’s forward Price/Cash Flow and Price/Book ratios of 40.80 and 12.78, respectively, are significantly higher than the 17.76 and 4.18 industry averages. In addition, the stock’s 31.03 forward EV/EBITDA multiple is 154.4% higher than the 12.20 industry average. And its forward EV/Sales ratio of 13.80 is 367% higher than the 2.95 industry average.
POWR Ratings Reflect Uncertainty
NVDA has an overall C rating, which translates to Neutral in our proprietary POWR Ratings system. The POWR Ratings are calculated by considering 118 distinct factors, with each factor weighted to an optimal degree.
NVDA has a grade of C for Momentum. It is currently trading below its 50-day and 200-day moving averages of $233.60 and $244.25, respectively, indicating a downtrend in sync with the Momentum grade. Also, the stock has a B grade for Growth but a D grade for Value. NVDA’s robust growth story justifies the Growth grade, while its frothy valuation matches the Value grade.
Given the robust demand for semiconductors, NVDA is expected to grow substantially over the next few years. However, the current weakening demand and Fed’s hawkish stance might limit NVDA’s growth in the near term. Furthermore, as bearish market trends persist, shares of NVDA might plummet further, given their premium valuation compared to the company’s peers. Thus, we think investors should wait until NVDA’s valuations stabilize before investing in the stock.
How Does NVIDIA (NVDA) Stack Up Against its Peers?
While NVDA has a C rating in our proprietary rating system, one might want to consider looking at its industry peers, United Microelectronics Corp. (UMC), STMicroelectronics N.V. (STM), and Photronics, Inc. (PLAB), which have an A (Strong Buy) rating.
NVDA shares were trading at $191.59 per share on Wednesday afternoon, down $4.43 (-2.26%). Year-to-date, NVDA has declined -34.85%, versus a -12.00% rise in the benchmark S&P 500 index during the same period.
About the Author: Aditi Ganguly
Aditi is an experienced content developer and financial writer who is passionate about helping investors understand the do’s and don’ts of investing. She has a keen interest in the stock market and has a fundamental approach when analyzing equities.
4 Stocks to Buy if You Think Inflation Will Keep Trending Higher in 2022
The economy is suffering its worst inflation in more than 40 years. In an inflationary environment, investors should look to bet on companies that possess sufficient pricing power, with products and services that face inelastic demand. Since many analysts expect inflation to continue trending higher despite interest rate increases, we think it could be wise to bet on ABB (ABB), Olin (OLN), Dow (DOW), and Costco (COST), which we think can survive even higher inflation. So, let’s discuss these names.
shutterstock.com – StockNews
Concerns over record-high inflation, supply chain constraints, a continuing war between Russia and Ukraine, and expected aggressive interest rate hikes by the Federal Reserve have kept the stock market under pressure. Many analysts expect these lingering issues, coupled with high energy prices, to foster a recessionary environment.
Last week, Fed Chairman Jerome Powell indicated an interest rate hike of 50 basis points in May to restore price stability. However, the global supply disruptions and bans on Russian oil, natural gas, and crucial commodities are expected to push inflation to new highs. In addition, the March jobs data suggested a tight labor market.
Because many economists expect the inflationary pressure to persist longer than expected, stocks possessing sufficient pricing power from companies whose products and services have inelastic or near-inelastic demand should be the ideal investments to weather inflation. The pricing power of ABB Ltd (ABB), Olin Corporation (OLN), Dow Inc. (DOW), and Costco Wholesale Corporation (COST) should help them survive even higher inflation. So, we think these stocks could be solid bets now.
Headquartered in Zurich, Switzerland, ABB manufactures and sells electrification, automation, robotics, and motion products for customers in utilities, industry, transport, and infrastructure. Its segments include Electrification Products, Robotics and Motion, Industrial Automation, Power Grids, and Corporate and Other.
On April 1, 2022, ABB launched its new share buyback program of up to $3 billion. The share buyback is consistent with ABB’s intention of returning $1.20 billion of the $7.80 billion of its cash proceeds from the divestment of its power grid to its shareholders.
ABB’s revenues increased 0.9% year-over-year to $6.96 billion for the first quarter, ended March 31, 2022. The company’s income from operations increased 7.5% year-over-year to $857 million. Also, its net income increased 20.3% year-over-year to $604 million. In addition, its operational EBITA increased 3.9% year-over-year to $997 million.
Analysts expect ABB’s EPS and revenue for its fiscal 2023 to increase 15.1% and 6.8%, respectively, year-over-year to $1.83 and $31.96 billion. It surpassed the Street EPS estimates in three of the trailing four quarters. And over the past six months, the stock has declined 8.9% in price to close the last trading session at $30.23.
ABB’s POWR Ratings reflect solid prospects. According to our proprietary rating system, it has an overall B rating, which translates to a Buy. The POWR Ratings assess stocks by 118 distinct factors, each with its own weighting.
It has a B grade for Stability and Quality. It is ranked #24 out of 76 stocks in the B-rated Industrial – Machinery industry. Click here to see the other ratings of ABB for Growth, Value, Momentum, and Sentiment.
OLN in Clayton, Miss., produces and sells chemical products in the United States, Europe, and globally. It operates in three segments: Chlor Alkali Products and Vinyls; Epoxy; and Winchester.
On April 28, 2022, OLN announced the signing of a memorandum of understanding to create a joint venture with Plug Power, Inc. (PLUG) to produce and market green hydrogen to support growing fuel cell demand in the global hydrogen economy. OLN’s Chairman, President, and CEO Scott Sutton said, “Olin’s 130-year history of producing hydrogen as part of our Chlor alkali production process combined with Plug Power’s leadership in the green hydrogen economy creates a powerful partnership to serve the growing demand for green hydrogen.”
For its fiscal first quarter, ended March 31, 2022, OLN’s sales increased 28.2% year-over-year to $2.46 billion. The company’s net income increased 61.3% year-over-year to $393 million. Also, its EPS came in at $2.48, representing a 64.2% increase year-over-year. In addition, its adjusted EBITDA increased 31.5% year-over-year to $710.90 million.
For the quarter ending March 31, 2022, OLN’s EPS and revenue are expected to increase 52.6% and 28.3%, respectively, year-over-year to $2.35 and $2.46 billion. It surpassed consensus EPS estimates in three of the trailing four quarters. And over the past year, the stock has gained 26.3% in price to close its last trading session at $53.26.
OLN’s POWR Ratings reflect solid prospects. The stock has an overall B rating, which equates to a Buy in our proprietary rating system.
It has a B grade for Value and Quality. Within the A-rated Chemicals industry, it is ranked #22 of 89 stocks. To see the other ratings of OLN for Growth, Momentum, Stability, and Sentiment, click here.
Note that OLN is one of the few stocks handpicked by our Chief Growth Strategist, Jaimini Desai, currently in the POWR Growth portfolio.Learn more here.
DOW is the holding company for the Dow chemical company and its subsidiaries. The Midland, Mich.-based company’s portfolio of plastics, industrial intermediates, coatings, and silicones businesses delivers a range of science-based products and solutions for its customers in various market segments, such as packaging, infrastructure, mobility, and consumer care.
On January 25, 2022, DOW announced an agreement with Locus Performance Ingredients to sell its high-performance sophorolipid biosurfactants in the global home care and personal markets. The ingredients offer a substantial reduction in carbon footprint compared to conventional surfactants. The agreement should enable DOW to strengthen its position in the biosurfactants market.
DOW’s net sales increased 28.4% year-over-year to $15.26 billion for the first quarter, ended March 31, 2022. The company’s net income increased 54.2% year-over-year to $1.55 billion. Also, its EPS came in at $2.11, representing a 59.8% increase year-over-year.
Analysts expect DOW’s revenue for the quarter ending June 30, 2022, to increase 11.8% year-over-year to $15.52 billion. Its EPS is expected to grow 59.7% per annum over the next five years. It surpassed the Street’s EPS estimates in each of the trailing four quarters. Over the past six months, the stock has gained 19.8% in price to close the last trading session at $67.81.
DOW’s strong prospects are reflected in its POWR Ratings. The stock has an overall B rating, which equates to a Buy in our proprietary rating system.
It has an A grade for Value and a B grade for Sentiment and Quality. It is ranked #17 in the Chemicals industry. Click here to see the other ratings of DOW for Growth, Momentum, and Stability.
Famous membership warehouse operators COST in Issaquah, Wash., offers branded and private-label products throughout a range of merchandise categories. It operates across the U.S., Canada, United Kingdom, Japan, and China. In addition, its broad product portfolio includes almost everything from dry groceries to automotive care products. It currently operates 824 warehouses.
COST’s total revenue increased 15.9% year-over-year to $51.90 billion for the second quarter, ended Feb. 13, 2022. The company’s attributable net income increased 36.5% year-over-year to $1.29 billion. Also, its EPS came in at $2.92, representing an increase of 36.4% year-over-year.
For its fiscal year 2022, COST’s EPS and revenue are expected to increase 18.2% and 13.2% year-over-year to $13.11 and $221.76 billion, respectively. It surpassed consensus EPS estimates in each of the trailing four quarters. And over the past year, the stock has gained 52% in price to close the last trading session at $562.
COST’s POWR Ratings reflect this promising outlook. The stock has an overall B rating, which equates to a Buy in our proprietary rating system.
It has a B grade for Stability and Sentiment. It is ranked #22 out of 39 stocks in the A-rated Grocery/Big Box Retailers industry. Click here to see the additional ratings of COST for Growth, Value, Momentum, and Quality.
ABB shares rose $0.32 (+1.06%) in premarket trading Friday. Year-to-date, ABB has declined -19.55%, versus a -9.65% rise in the benchmark S&P 500 index during the same period.
About the Author: Dipanjan Banchur
Since he was in grade school, Dipanjan was interested in the stock market. This led to him obtaining a master’s degree in Finance and Accounting. Currently, as an investment analyst and financial journalist, Dipanjan has a strong interest in reading and analyzing emerging trends in financial markets.
Should You Buy Automation Company UiPath Following the Stock’s More than 70% Drop
Shares of UiPath Inc. (PATH) are down more than 35% in price over the past month. Although rising demand for robotic process automation has increased PATH’s sales, the question is, will its shares rebound in the near term, given worries about increasing competition from leading companies in the automation services industry? Let’s discuss.
shutterstock.com – StockNews
New York City-based UiPath Inc. (PATH) offers an end-to-end automation platform with a range of robotic process automation (RPA) solutions in the United States, Romania, and Japan. The company provides a suite of interconnected technologies to help organizations design, manage, run, engage, measure, and regulate automation.
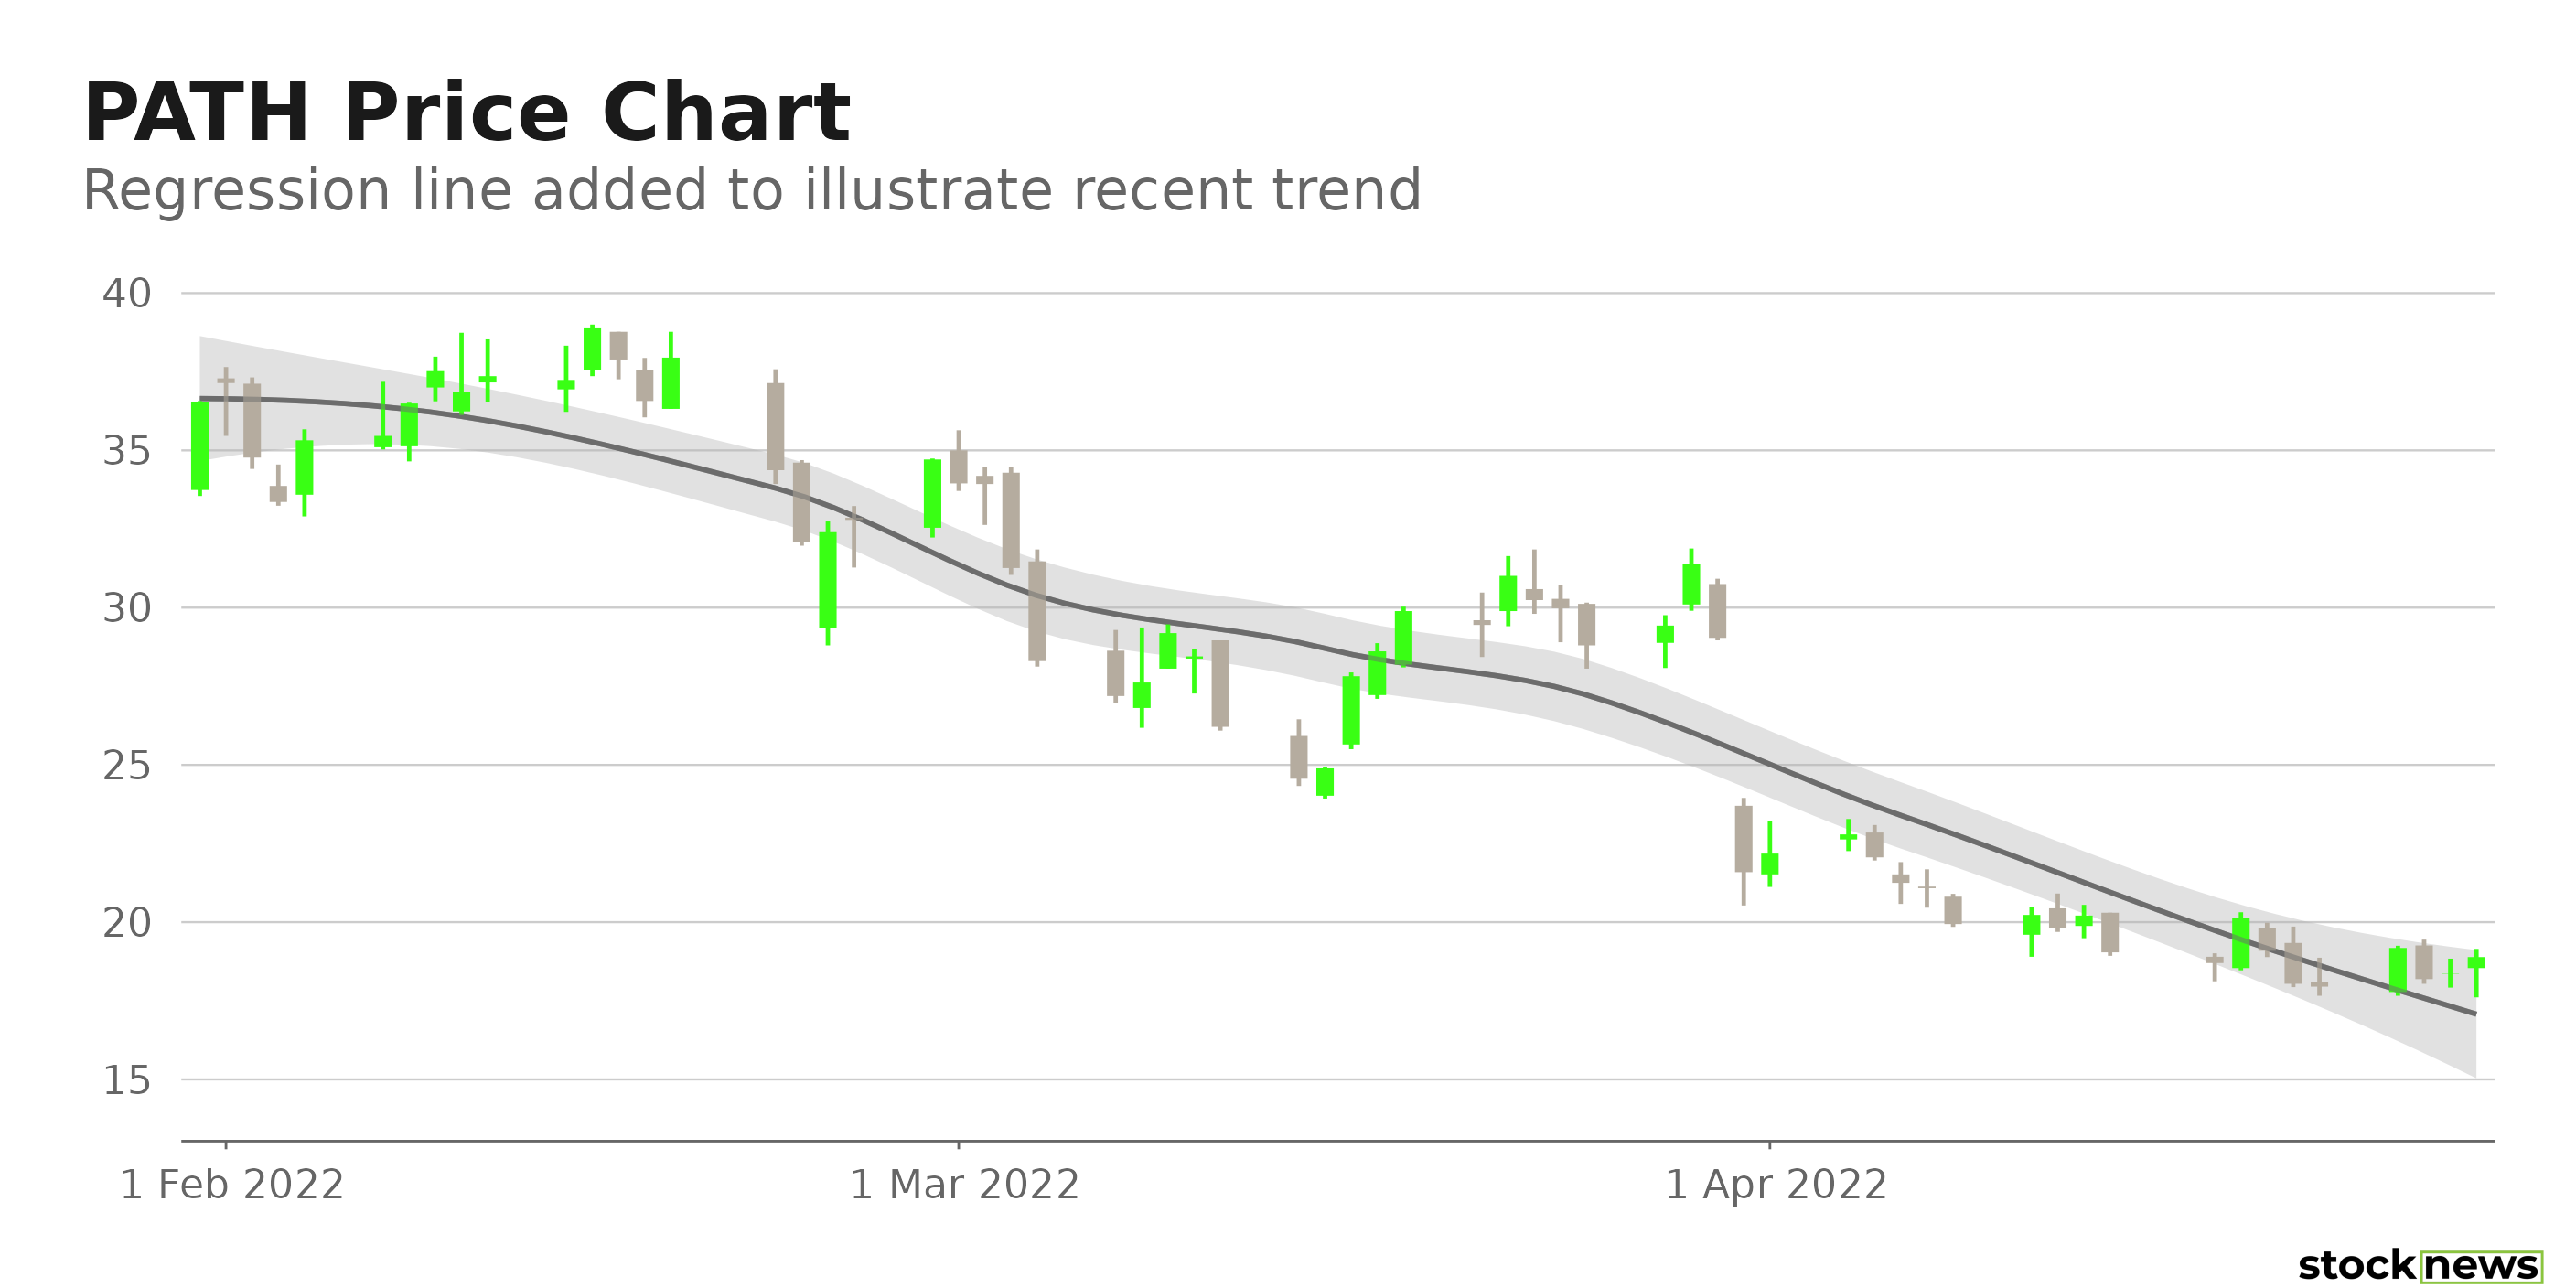
The stock is down 75% in price over the past year and 56.2% year-to-date to close yesterday’s trading session at $18.89. In addition, it is currently trading 79% below its 52-week high of $90, which it hit on May 28, 2021.
Although the company’s ground-breaking Academic Alliance program could help it benefit from the growing need for automation, increased competition from major industry players may threaten its market-share growth.
Here is what could shape PATH’s performance in the near term:
Increasing Competition
The worldwide automation services sector has grown highly competitive as more firms opt for Robotic Process Automation (RPA) technology services to automate repetitive operations and streamline business processes. Because digital behemoths like Microsoft Corporation (MSFT) and International Business Machines Corporation (IBM) are increasingly partnering with prominent niche firms to capitalize on their market development potential and obtain a vast client base, PATH’s growth may be stymied.
Poor Bottom line Performance
PATH’s total revenue increased 39.4% year-over-year to $289.69 million for the three months ended Jan. 31, 2021. However, its operating expenses increased 72.9% from its year-ago value to $299.41 million. Its operating loss came in at $50.88 million, compared to a $50.88 million operating profit. The company reported a $63.11 million net loss, compared to a $26.26 million net profit in the prior-year period. Its loss per share came in at $0.12 over this period.
Stretched Valuation
In terms of forward Price/Book, the stock is currently trading at 5.52x, which is 25.9% higher than the 4.38x industry average. Also, its 7.45x trailing-12-months EV/Sales is 153.9% higher than the 2.93x industry average. Furthermore, PATH’s 9.40x trailing-12-months Price/Sales is 201.5% higher than the 3.12x industry average.
Poor Profitability
PATH’s 0.52% trailing-12-months asset turnover ratio is 17.3% lower than the 0.63% industry average. Its trailing-12-months cash from operations stood at negative $54.96 million, versus the $90.61 million industry average. Also, its trailing-12-months ROA, net income, and ROC are negative 20.4%, 58.9%, and 25.9%, respectively.
POWR Ratings Reflect Bleak Outlook
PATH has an overall D rating, which equates to Sell in our proprietaryPOWR Ratings system. The POWR ratings are calculated by considering 118 distinct factors, with each factor weighted to an optimal degree.
Our proprietary rating system also evaluates each stock based on eight distinct categories. PATH has a D grade for Value. The company’s higher than industry valuation is consistent with the Value grade.
Among the 25 stocks in the F-rated Software – SAAS industry, PATH is ranked #23.
Beyond what I have stated above, you can view PATH ratings for Growth, Momentum, Stability, Quality, and Sentiment here.
The rising demand for robotic process automation for automating repetitive processes has boosted the growth of major automation companies like PATH. However, the stock’s lofty valuation and increased competition from established companies have raised concerns about its prospects. Therefore, we believe the stock is best avoided now.
How Does UiPath Inc. (PATH) Stack Up Against its Peers?
While PATH has an overall D rating, one might want to consider its industry peers, MiX Telematics ADR (MIXT), The Sage Group Plc (SGPPY), and Descartes Systems Group Inc. (DSGX), which have an overall B (Buy) rating.
PATH shares fell $0.28 (-1.48%) in premarket trading Friday. Year-to-date, PATH has declined -56.20%, versus a -9.65% rise in the benchmark S&P 500 index during the same period.
About the Author: Pragya Pandey
Pragya is an equity research analyst and financial journalist with a passion for investing. In college she majored in finance and is currently pursuing the CFA program and is a Level II candidate.
Here’s Why Signet Jewelers Should Outperform in 2022
Signet Jewelers (SIG) posted solid fundamental performance thanks to robust growth in its e-commerce business and smooth progress in its Inspiring Brilliance strategy in its fiscal fourth quarter. In addition, the company is striving to strengthen its data analytics skills and is looking forward to bringing the connected commerce concept to its next phase of growth. Therefore, we think the stock should soar higher in 2022. Read on.
shutterstock.com – StockNews
Signet Jewelers Limited (SIG) in Hamilton, Bermuda, runs nearly 2,800 stores under the renowned brands of Kay Jewelers, Zales, Jared, H. Samuel, Ernest Jones, Peoples, Piercing Pagoda, and JamesAllen.com, as well as a jewelry subscription service, Rocksbox. The company is working to improve its online shopping experience with in-store consultations and services, such as buy online, pick up in-store, and curbside delivery.
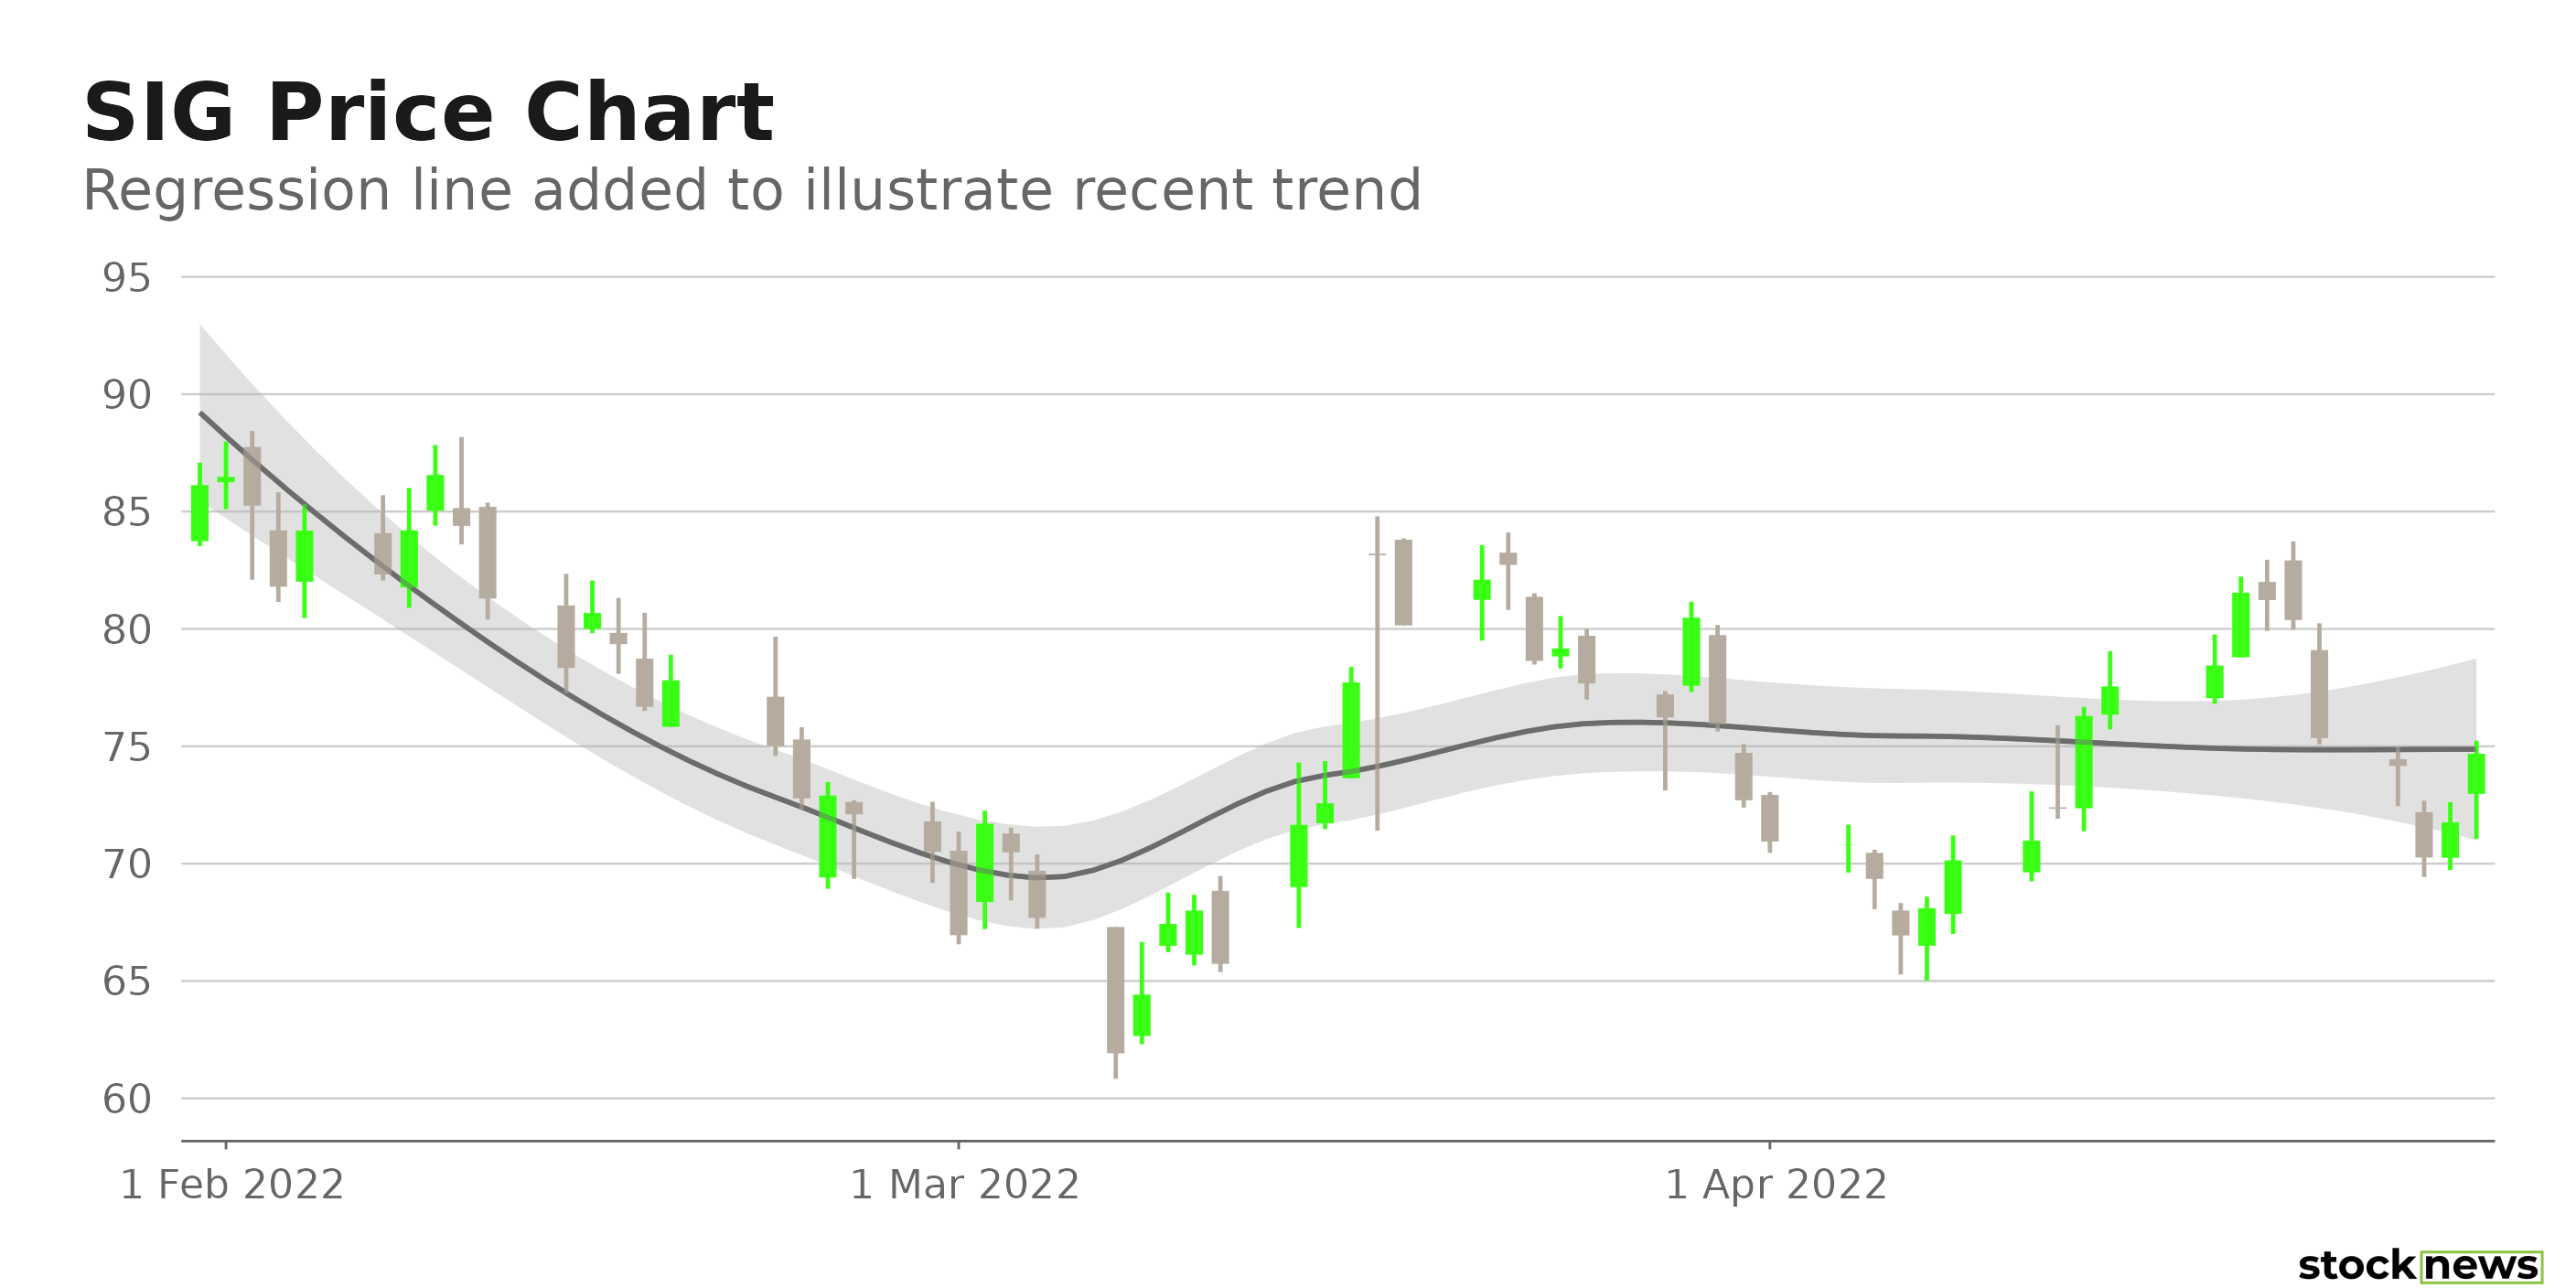
SIG’s shares are up 18.9% over the past year and 14.7% over the past nine months to close yesterday’s trading session at $74.68.
SIG posted strong fourth-quarter fiscal 2022 results, with e-commerce sales increasing 8.7% from the previous year’s quarter to $556 million. Its retail sales grew 34.6% year-over-year to $2.3 billion. Its e-commerce sales in North America increased 14% year-over-year, while its same-store sales increased 30.6%.
Here is what could shape SIG’s performance in the near term:
Robust Financials
During its fiscal fourth quarter, ended Jan. 29, 2022, SIG’s sales increased 28.6% year-over-year to $2.81 billion. Its operating income increased 37.9% year-over-year to $402.4 billion. And the company’s net income grew 23.6% from its year-ago value to $214.3 billion, while its EPS grew 19.2% from the prior-year quarter to $4.91.
Strong Profitability
SIG’s 9.8% trailing-12-months net income margin is 48.8% higher than the 6.6% industry average. Also, its ROC, gross profit margin and ROA are 105.3%, 8.9%, and 91.4% higher than the respective industry averages. Furthermore, its $1.26 billion in cash from operations is 669.9% higher than the $163.29 million industry average.
Impressive Growth Prospects
The Street expects SIG’s revenues to rise 2.10% year-over-year to $7.99 billion in its fiscal 2022. In addition, SIG’s EPS is expected to rise at a 7% CAGR over the next five years. Also, the company has an impressive earnings surprise history; it topped the Street’s EPS estimates in three of the trailing four quarters.
Discounted Valuation
In terms of forward Non-GAAP P/E, the stock is currently trading at 6.33x, which is 49.8% lower than the 12.60x industry average. Its 0.53x forward EV/Sales is 53.1% lower than the 1.13x industry average. Moreover, SIG’s 2x forward Price/Book is 19.1% lower than the 2.47x industry average.
Consensus Rating and Price Target Indicate Potential Upside
Among the three Wall Street analysts that rated SIG, two rated it Buy, and one rated it Hold. The 12-month median price target of $112.33 indicates a50.4% potential upside. The price targets range from a low of $94.00 to a high of $138.00.
POWR Ratings Reflect Solid Prospects
SIG has an overall B grade, which equates to a Buy rating in our proprietary POWR Ratings system. The POWR Ratings are calculated by considering 118 distinct factors, with each factor weighted to an optimal degree.
Our proprietary rating system also evaluates each stock based on eight distinct categories. SIG has a B grade for Quality and Value. SIG’s solid earnings and revenue growth potential are consistent with its Quality grade. In addition, the company’s lower-than-industry multiples are in sync with the Value grade.
Among the 67 stocks in the A-rated Fashion – Luxury industry, SIG is ranked #25.
Beyond what I stated above, we have graded SIG for Growth, Sentiment, Stability, and Momentum. Get all SIG ratings here.
Bottom Line
Solid gains from growth initiatives such as distinctive banner value propositions, marketing activities, and enhanced connected-commerce capabilities contribute to company performance. So, given the company’s financial soundness and high-profit margins, we believe the stock is primed for tremendous upside in the near term and might be a great investment bet now.
How Does Signet Jewelers Ltd. (SIG) Stack Up Against its Peers?
SIG has an overall POWR Rating of B, which equates to a Buy rating. Check out these other stocks within the same industry with A (Strong Buy) ratings: J.Jill Inc. (JILL), Hugo Boss AG (BOSSY), and Caleres Inc. (CAL).
SIG shares were unchanged in premarket trading Friday. Year-to-date, SIG has declined -13.76%, versus a -9.65% rise in the benchmark S&P 500 index during the same period.
About the Author: Pragya Pandey
Pragya is an equity research analyst and financial journalist with a passion for investing. In college she majored in finance and is currently pursuing the CFA program and is a Level II candidate.
The S&P 500 (SPY) had a nice bounce and remains above its key level. However, the market faces some serious challenges in terms of inflation, a hawkish Fed, and now a possible slowdown in growth. Read on to find out how we are navigating this tricky market environment.
shutterstock.com – StockNews
We’ve seen a deterioration of market conditions over the last week with some ominous developments.
The S&P 500 has managed to stay above its late-February low of 4,100. In contrast, the Nasdaq and Russell 2000 both undercut these levels over the past couple of days, increasing concern that a re-test and possible break lower was imminent for the S&P 500. Today, we got a nice relief rally with the Nasdaq and Russell 2000 closing above these key levels. While this was a positive development, we are still in ‘no man’s land’.
Overall, the market remains in its choppy, muddled state. Today’s commentary will entail some brief thoughts on the market outlook and check-in on how Q1 earnings season is shaping up. Then, we’ll look at the few trades that are working in this market. And, we’ll conclude with a discussion of our portfolio.
Market Commentary
First, let’s review the past week…
Over the past week, the S&P 500 is down 2.5%, although it was down 5.3% at its trough. There was more weakness in the Russell 2000 which was down 3.7%, but the Nasdaq was an outperformer with a 2.3% loss, aided by nice post-earnings gains from Facebook and Microsoft.
(As I write this, the Nasdaq is down more than 2% due to post-earnings selling in Amazon and Apple.)
I think this type of performance and volatility is further confirmation that the market is still confined by these choppy conditions.
A couple of weeks ago, I started to get optimistic that maybe all the bad news was priced in and that the market’s dip, following the 10% rally in March, could be a launching point for the bull market to reassert itself.
This turned out to be incorrect.
This bullish setup failed, and we are back to a more defensive position. As noted before, a break below 4,100, and we would get to a neutral position as this would indicate that the market’s intermediate-trend is lower.
Bullish and Bearish Scenarios
To recap, I see the short-term trend as now being down and the intermediate trend’s direction is being tested.
In tennis, they call the space between the service box and the baseline – ‘no man’s land’ because this is the worst part of the court to be standing. You either want to be close to the net or behind the baseline.
Similarly, the market is kind of in a place, where it’s hard to have confidence about its near-term direction. We are very oversold with bearish sentiment, but there’s not really any catalyst to rally. Further, it’s easy to see weakness at least until the next FOMC meeting in early May, where traders are looking for either a 50 or 75 basis points hike.
Earnings Season
So far, Q1 earnings season has continued to be better than expected on an aggregate basis. Overall, we have 6.6% earnings growth, while analysts were looking for 4.7% prior to the start of earnings season.
20% of the S&P 500 has reported with 79% of companies topping earnings expectations and 69% beating on revenue. Due to earnings growth and a lower S&P 500, the forward P/E has declined to 18.6 from the mid-20s a few months ago. Another positive is that we are seeing earnings growth across multiple sectors.
The bigger stories to watch with earnings season is seeing what type of impact is felt by inflation and if it starts affecting margins. Another is to see if there are any signs of a slowdown in the economy.
So far, margins have remained pretty strong at 12.3%. This is off from the recent peak of 12.8% but still above historical averages. And, the revenue and earnings beats in multiple sectors are not consistent with the economy slowing.
Still, I can’t help noticing a certain flavor of ‘sell the news, buy the rumor’ in stocks that report strong numbers that see an initial pop and then selling to finish lower. One interpretation is that investors are expecting earnings to contract due to higher rates and a possible slowdown.
What’s Working
Despite Thursday’s big bounce, I still think that we have to respect the downside risk.
Simply put, the Fed is getting increasingly hawkish to the point that it’s clear that they are OK with lower stock prices or higher unemployment if that’s what is necessary for price stability.
This means that the market is going to be even more sensitive to any data that indicates a slowdown in growth or even a recession is increasing odds.
And, there are some indications that some softening is on the horizon based on leading indicators like the ISM New Orders. Another concern is that China’s economy is essentially shut down with mobility and activity levels that were last seen in early 2020.
Therefore, we still need to respect the bear case, however, I did want to talk about briefly what trends and trades are working in the market.
The biggest winners have been the ‘boring but safe’ stocks that are of the high-quality variety. This is why some of the outperformers in 2022 have included defense stocks, consumer staples, utilities, managed care, and pharmaceuticals.
These stocks’ earnings and revenue are less impacted by changes in economic or monetary conditions. They have strong pricing power to provide protection in an inflationary environment. They also have a strong balance sheet which provides protection in the event of a downturn.
Another area to monitor is energy and materials stocks. These have also had spectacular runs over the past year which continued in 2022 but have had pullbacks that seem healthy so far. However, I’m less enthused about this theme at the moment given their spectacular gains and the aforementioned data showing a slowdown is likely.
Finally, the travel trend is taking off. We are seeing strong earnings reports and very positive commentary from management teams. So far, the stocks haven’t reacted too much, but I’m confident that this will be a leading group once the bull market reasserts itself.
Now, let’s shift our focus to the portfolio…
Nexa Resources (NEXA)
NEXA shares were 7% higher following the company’s earnings report.
Due to its strong report, the company’s forward P/E is now 4. It reported $0.48 in EPS, topping estimates, and a big improvement from last year’s $0.17 per share in earnings.
Given its strong results and low valuation, this is a cyclical stock that I’m willing to hold onto.
In contrast to NEXA, CGAU is a commodity stock that I’m less into given that real interest rates are starting to rise.
In my experience, gold prices have a tough time breaking out to new highs when this is the case. And, the last few months have been great for gold as inflation was raging higher, the geopolitical risk was exploding, and the Fed was slow to act.
Now, the Fed is quite hawkish, but it seems that inflation may be plateauing which means real rates should start trending higher.
.Garrett Motion (GTX)
GTX reported earnings that came in below expectations due to decreased production from automakers.
Q1 was likely the nadir of supply chain issues, and we should see auto production improve from here. Thus, it’s not surprising that GTX’s stock price was unchanged as investors are more focused on the future and have already priced in its current set of challenges.
Overall, I think it was still a good result with $88 million in net income in a depressed quarter. This is especially impressive considering that the overall market cap for GTX is $450 million.
For us, the bigger picture is on managing risk if we fall below our key levels. The first key level is around 4350 on the S&P 500. After that, it’s the 4,100 level for the intermediate-term trend.
The first key level was broken, and we raised some cash. Now, we will watch to see how the market acts around the 4,100 level and what it does going into next week’s Fed meeting.
All the Best!
Jaimini Desai Chief Growth Strategist, StockNews Editor of the POWR Stocks Under $10 Newsletter
SPY shares fell $3.84 (-0.90%) in premarket trading Friday. Year-to-date, SPY has declined -9.65%, versus a % rise in the benchmark S&P 500 index during the same period.
About the Author: Jaimini Desai
Jaimini Desai has been a financial writer and reporter for nearly a decade. His goal is to help readers identify risks and opportunities in the markets. He is the Chief Growth Strategist for StockNews.com and the editor of the POWR Growth and POWR Stocks Under $10 newsletters. Learn more about Jaimini’s background, along with links to his most recent articles.
Here’s Why Choice Hotels is a Top Pick for the Rest of the Year…
Choice Hotels (CHH) is one of the top hotel stocks due to its unique business model which ensures high margins. Additionally, travel stocks will benefit from pent-up demand for travel in the coming quarters.
shutterstock.com – StockNews
There are a lot of reasons for investors to be fearful of at the moment. War continues to rage between Ukraine and Russia. The Fed is laser-focused on bringing down inflation. This hawkishness and increasing concerns of a slowdown in economic growth have resulted in stocks plunging lower.
Despite the increasing bearish sentiment, investors should remember that some of the best investment opportunities are birthed during these episodes of fear when markets are cascading lower. And, these opportunities are often found in finding companies, with improving fundamentals, that are exposed to bullish secular trends that are disconnected from economic or geopolitical factors.
Today, I want to talk about such a company – Choice Hotels (CHH). CHH is benefiting from a massive boom in travel which should continue over the next couple of years. Further, the company has a favorable business model for investors and should continue seeing margins and earnings trend higher. Revenues have also returned to pre-pandemic levels even with many categories of travel far from pre-pandemic levels.
Read on to find out why CHH is my growth stock of the week..
Company Background
While Choice Hotels may not be familiar to most people, its many brands certainly are. Some off the most well-known include Comfort Inn, Comfort Suites, Quality, Clarion, Clarion Pointe, Sleep Inn, Econo Lodge, Rodeway Inn, and MainStay Suites. As of the start of the year, the company had nearly 600,000 rooms in all 50 states and 40 countries.
It operates in two segments: Hotel Franchising; and Corporate & Other. It franchises all of its properties, and it also has a unit dedicated to selling its cloud-based, software for property management to other hoteliers.
Operating Leverage
CHH gives investors operating leverage due to its business model. As a franchisor, it has higher profit margins than its peers. For instance, it had 26.9% profit margins last quarter, while competitors like Marriot (MAR) and Hilton (HLT) had profit margins of 7.9% and 7.1%, respectively.
Another source of operating leverage is its growing, software business which is growing at a double-digit rate with increasing adoption and use. These types of SaaS products can become integral to operators which creates future opportunities to raise prices and provide more features for additional monetization.
For these reasons, CHH is pretty unique among hotel stocks.
Growth
This operating leverage means that CHH will see significant earnings growth as the travel market booms this summer and into 2023. Already, there are reports of record demand among airlines and cruises as the coronavirus continues to recede as a major issue.
TSA travel data shows that travel volumes are about 10% below pre-pandemic levels despite impairment in business and international travel and airlines operating at a lower capacity. Given such developments, it’s likely that we are in the early innings of an unprecedented boom in travel with pent-up demand that should persist for many quarters.
Another catalyst for CHH is that its margins are likely to expand due to growth in its software business. Further, the company is less affected by inflation due to its franchising model. Higher margins are supportive of multiple expansion, while the recovery in travel is supportive of revenue growth.
POWR Ratings
CHH is a company with multiple positive tailwinds in place. Recent market volatility is creating an opportunity to buy shares at an attractive valuation.
In addition, the POWR Ratings are also very positive on the stock as it’s rated a B which translates to a Buy. B-rated stocks have posted an average annual return of 21.1% which compares favorably to the S&P 500’s average annual return of 8%.
It also has strong component grades including an A for Quality due to its success in increasing margins and investor-friendly business model. It has a B for Growth which is consistent with its organic growth and the cyclical boost as pent-up demand for travel is unleashed in the coming years. Click here to see more of CHH’s POWR Ratings including component grades for Value and Momentum.
What To Do Next?
If you’d like to see more top growth stocks, then you should check out our free special report:
All 9 picks have strong fundamentals and are experiencing tremendous momentum. They also contain a winning blend of growth and value attributes that generates a catalyst for serious outperformance.
Even more important, each recently earned a Buy rating from our coveted POWR Ratings system where the A rated stocks have gained +31.10% a year.
Click below now to see these top performing stocks with exciting growth prospects:
CHH shares were trading at $142.50 per share on Wednesday afternoon, up $1.57 (+1.11%). Year-to-date, CHH has declined -8.36%, versus a -10.95% rise in the benchmark S&P 500 index during the same period.
About the Author: Jaimini Desai
Jaimini Desai has been a financial writer and reporter for nearly a decade. His goal is to help readers identify risks and opportunities in the markets. He is the Chief Growth Strategist for StockNews.com and the editor of the POWR Growth and POWR Stocks Under $10 newsletters. Learn more about Jaimini’s background, along with links to his most recent articles.
Bulls and bears have been squabbling over the direction of the stock market (SPY) since the start of the year. Right now the bears are winning. But the bulls have not lost hope because the economy seems to be in fine shape. That may all change Thursday morning, April 28th when the GDP report comes out. This key announcement could truly be a catalyst in either direction. This commentary will get you ready for whatever comes our way on 4/28. Read on for more.
Stocks are retesting the lows established in late February before a glorious, but short lived, March bounce. On the surface we are dealing with the same elements as before:
High Inflation
Hawkish Fed
Russia/Ukraine
Yet these negatives all were happening with no real harm being done to the economy as it appeared report by report. But the well respected Atlanta Fed GDPNow model just dipped to only +0.4% growth rate for Q1. That is way to close to a recessionary territory and why more investors got to selling stocks this week.
This makes the Thursday morning release of Q1 GDP a pivotal event for investors. Let’s focus on that topic in this week’s commentary.
Market Commentary
Let’s set the scene.
The 3 negatives of high inflation, hawkish Fed and Russia/Ukraine provide ample reason for investors to pause after 2 years of non-stop stock advances. This should have them searching high and low for any serious signs of weakness in the economy or corporate earnings to determine if indeed the next recession and bear market are on the way.
We have vigilantly done that in the Reitmeister Total Return commentary analyzing each key economic report as it came out with nary a chink in the armor. Same goes for monitoring the start of Q1 earnings season for any clues.
The key points are highlighted in yellow. That being where the earnings growth outlook now is better than before the earnings season started. This is a statement that recent earnings announcements have been good. More importantly that analysts foresee even better results than previously anticipated in the quarters ahead.
Or to overly simplify…corporate earnings points to NO slowing of the economy. In fact, it shows an acceleration of growth.
Unfortunately, the Atlanta Fed has many more inputs in their GDPNow model. Here is a chart of that going back a few months:
The green line represents the model which has flitted from slightly in the contraction territory to +1.5%. In fact, that higher view of things was on display just a week ago before the model tumbled closer to 0% the last few days. This likely corresponds with the 6% decline in the S&P week over week.
You will also note the blue line on this chart which represents the “Blue Chip Consensus”. This being a panel of economists they monitor to get an average forecast for the US economy. Note that was nicely higher a month ago and now coming in closer to +1%.
Here is the bad news. If the actual GDP report on Thursday morning comes out worse than these expectations, then we will probably find lower lows as risk of recession and bear market will have increased.
If, on the other hand, GDP proves to be better than these anemic expectations, then it should be a very bullish catalyst as investors breathe a sigh of relief.
The one wrinkle to the bear case is that any weakness found in the economy could actually be a positive for stocks.
SAY WHAT?
That’s because bad news for the economy is good news for changing the Feds tune on raising rates…which investors could actually applaud with a rally.
Yes, this is an overwhelming range of possibilities. And don’t want to venture a guess as to what will actually happen. The best we can do is review things in real time and make any adjustments.
Right now, we are pretty well geared for continuation of the bull market. So not much will change with our portfolio in that situation besides putting our modest 7% cash position to work in the market.
Now let’s imagine it’s a bad report, and odds of recession and further downside have increased, then we will start making more defensive moves. This would entail selling our most aggressive/bullish positions and start raising cash and/or buying inverse ETFs to profit from that potential downward action.
The key to the above statement is “odds of downside”…not guarantee of downside. And thus our defensive moves will likely be bit by bit and not all at once given that the market can bounce at any time for any reason (as we have seen time and time again over our investing lifetimes).
Meaning that history has shown that most investors are wrong about market direction. If they are all too giddily bullish…then time to sell. And if they are wetting their beds about a bear market on the horizon, as they are now, then very often that is a sign of a bounce ready to come.
Again, no one said this is going to be easy, but truly we are ready for whatever comes our way.
What To Do Next?
Discover my current portfolio of 9 hand picked stocks and 4 ETFs inside the Reitmeister Total Return portfolio that are perfect for this hectic market environment. The same portfolio that firmly beat the market last year and is doing so once again in 2022.
How is that possible?
The clue is right there in the name: Reitmeister Total Return
Meaning this service was built to find positive returns in all market environments. Not just when the bull is running full steam ahead. Heck, anyone can profit in that environment.
Yet when stocks are trending sideways, or even worse, heading lower…then you need to employ a different set of strategies to be successful.
Come discover what my 40 years of investing experience can do you for you.
Plus get immediate access to my full portfolio of 9 stocks and 4 ETFs that are primed to excel in this unique market environment. (This includes 2 little known investments that actually profit from rising rates which right now is the best trade in town).
Steve Reitmeister…but everyone calls me Reity (pronounced “Righty”) CEO, Stock News Network and Editor, Reitmeister Total Return
SPY shares were trading at $421.28 per share on Wednesday afternoon, up $5.18 (+1.24%). Year-to-date, SPY has declined -11.03%, versus a % rise in the benchmark S&P 500 index during the same period.
About the Author: Steve Reitmeister
Steve is better known to the StockNews audience as “Reity”. Not only is he the CEO of the firm, but he also shares his 40 years of investment experience in the Reitmeister Total Return portfolio. Learn more about Reity’s background, along with links to his most recent articles and stock picks.
Should You Buy Netflix After Its More Than 40% Decline?
Entertainment services provider Netflix’s (NFLX) shares have dipped since the company reported weak first-quarter earnings results. But can they rebound on the company’s ability to leverage its broad portfolio of products and services? Read on to learn our view.
shutterstock.com – StockNews
Netflix Inc. (NFLX) in Los Gatos, Calif., offers TV series, documentaries, feature films, and mobile games across various genres and languages. It recently announced that it had entered a combination agreement to acquire Next Games to expand its internal game studio capabilities. However, the company posted disappointing results, losing 200,000 customers in the first quarter and projecting its subscribers will shrink by another 2 million customers in the second quarter.
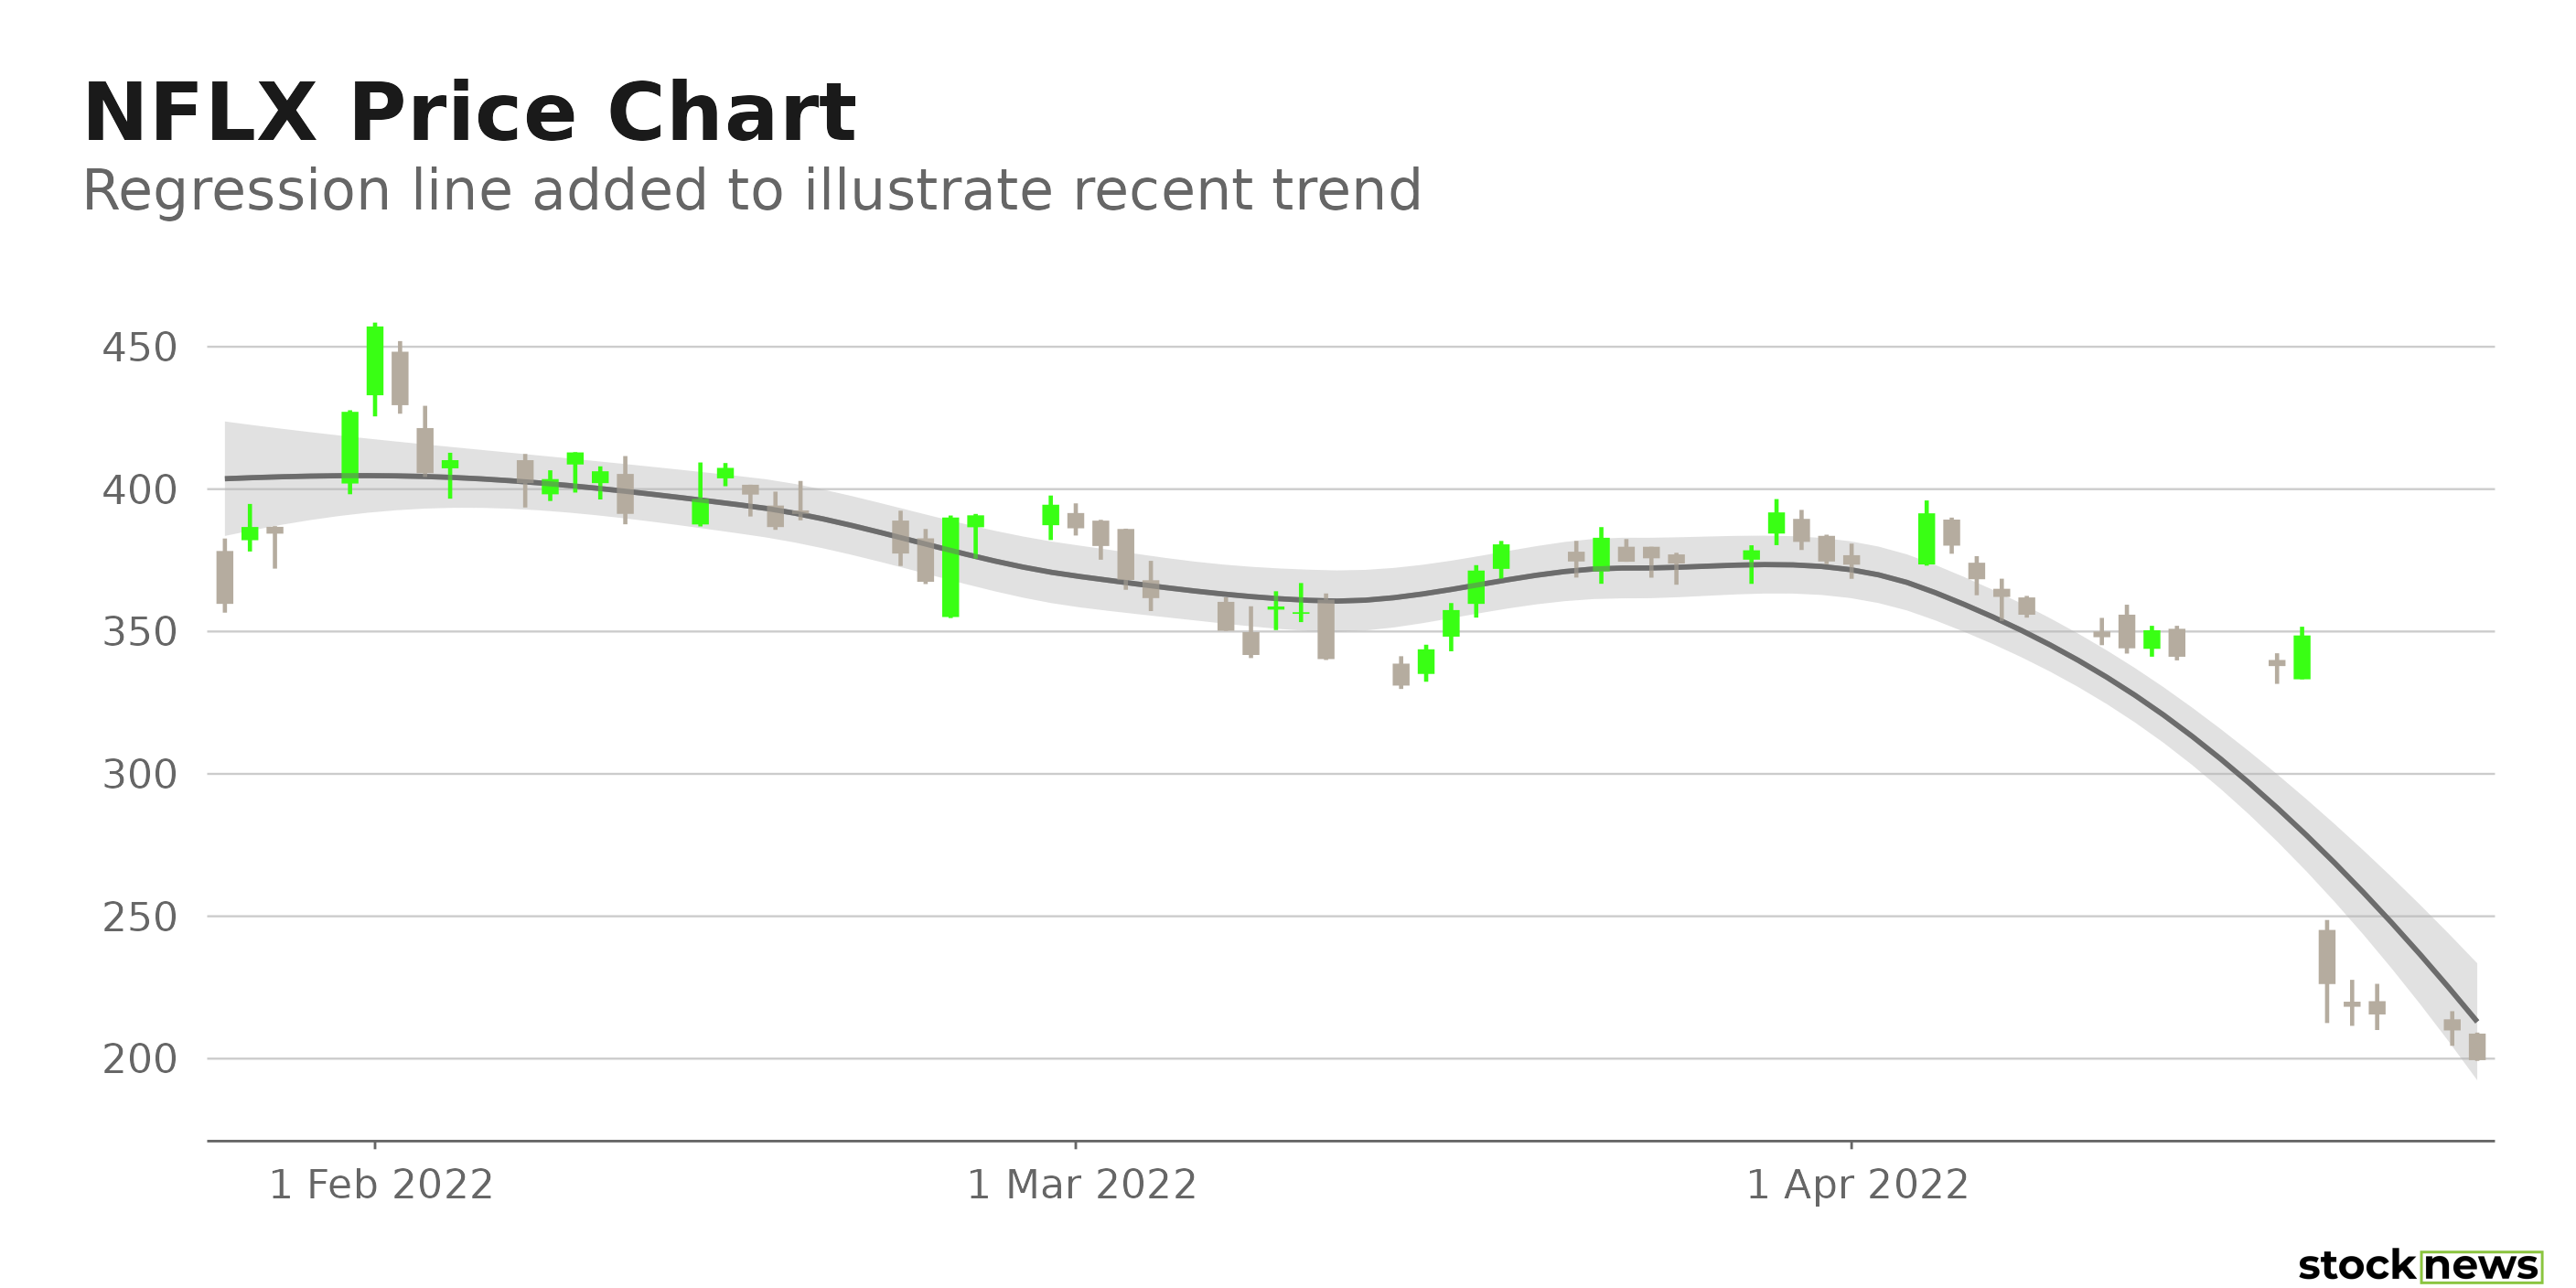
The stock has declined 43.9% in price over the past month and 68.8% over the past six months to close yesterday’s trading session at $209.91. In addition, it is currently trading 70.1% below its 52-week high of $700.99, which it hit on Nov. 17, 2021.
Furthermore, stiff competition, the impact of account sharing, increasing inflation, and the Russia-Ukraine war make the company’s near-term outlook uncertain.
Here is what could influence NFLX’s performance in the upcoming months:
Top Line Growth Does Not Translate into Bottom Line Improvement
For its fiscal first quarter, ended March 31, 2022, NFLX’s revenue surged 9.8% year-over-year to $7.87 billion. The company’s operating income increased 0.6% year-over-year to $1.97 billion. However, its net income came in at $1.60 billion, representing a 6.4% year-over-year decrease. Also, its EPS was $3.53, down 5.9% year-over-year.
Low Profitability
In terms of trailing-12-month CAPEX/Sales, NFLX’s 1.86% is 56.3% lower than the 4.25% industry average. Also, its 41.62% trailing-12-month gross profit margin is 18.1% lower than the 50.83% industry average.
Stretched Valuation
In terms of forward P/CF, NFLX’s 84.48x is 758.9% higher than the 9.84x industry average. And its 4.70x forward P/B is 109.7% higher than the 2.24x industry average. Furthermore, the stock’s forward P/S andEV/EBITDA of 2.88x and 14.97x, respectively, are higher than the 1.51x and 8.61x industry averages.
POWR Ratings Do not Indicate Enough Upside
NFLX has an overall C rating, which equates to a Neutral in our POWR Ratings system. The POWR Ratings are calculated by considering 118 distinct factors, with each factor weighted to an optimal degree.
Our proprietary rating system also evaluates each stock based on eight distinct categories. NFLX has a C grade for Value, which is in sync with its higher-than-industry valuation ratios.
In addition, NFLX has a C grade for Growth and Sentiment. This is justified because analysts expect its EPS to decrease 12.2% in the next quarter and 3.1% in the current year.
NFLX is ranked #20 of 72 stocks in the F-rated Internet industry. Click here to access NFLX’s Momentum, Quality, and Stability ratings.
Bottom Line
NFLX is currently trading below its 50-day and 200-day moving averages of $357.98 and $519.41, respectively, indicating a downtrend. Moreover, it could continue declining in the near term due to concerns over multi-household account sharing and increased competition. So, the stock looks overvalued at its current price level, and we think it could be wise to wait for a better entry point in the stock.
How Does Netflix Inc. (NFLX) Stack Up Against its Peers?
While NFLX has an overall POWR Rating of C, one might want to consider investing in the following Internet stocks with an A (Strong Buy) or B (Buy) rating: trivago N.V. (TRVG), Yelp Inc. (YELP), and Travelzoo (TZOO).
Note that TRVG is one of the few stocks handpicked by our Chief Growth Strategist, Jaimini Desai, currently in the POWR Stocks Under $10 portfolio.Learn more here.
NFLX shares were trading at $199.95 per share on Tuesday afternoon, down $9.96 (-4.74%). Year-to-date, NFLX has declined -66.81%, versus a -11.80% rise in the benchmark S&P 500 index during the same period.
About the Author: Nimesh Jaiswal
Nimesh Jaiswal’s fervent interest in analyzing and interpreting financial data led him to a career as a financial analyst and journalist. The importance of financial statements in driving a stock’s price is the key approach that he follows while advising investors in his articles.
5 Outperforming Biotech Stocks with More Room to Run
Thanks to the global COVID-19 vaccination drive and inelastic demand for healthcare, biotechnology stocks have been outperforming the broader markets so far this year. Because this trend will likely continue, we think investing in popular biotech stocks Regeneron Pharmaceuticals (REGN), Exelixis (EXEL), Jazz Pharmaceuticals (JAZZ), Alkermes (ALKS), and Incyte Corp. (INCY) could be wise. Let’s discuss.
shutterstock.com – StockNews
The COVID-19 pandemic has created massive opportunities for biotechnology companies to develop treatments and vaccines. Governments worldwide have made large investments to mitigate the public health crisis through mass vaccinations. The substantial private and public sector investments coupled with rapid tech integration have allowed major biotech companies to expand their product portfolios tremendously over the past year.
Advancements in biotechnology have delivered new ways of treating and preventing major life-threatening diseases. And given the inelastic demand for healthcare products and medicines, the biotech industry is expected to perform well in the near term, despite the potential recession. According to Precedence Research, the biotechnology market’s size is expected to surpass $1.68 trillion by 2030, growing at an 8.7% CAGR.
Despite surging market volatility, fundamentally strong biotech stocks Regeneron Pharmaceuticals, Inc. (REGN), Exelixis, Inc. (EXEL), Jazz Pharmaceuticals plc (JAZZ), Alkermes plc (ALKS), and Incyte Corporation (INCY) have been gaining momentum of late.
REGN in Westchester County, N.Y., discovers, invents, develops, manufactures, and commercializes medicines for treating various diseases. Its product portfolio includes EYLEA, Dupixent, Libtayo, Praluent, REGEN-COV, Kevzara solution, and ARCALYST, among other injections.
On April 19, REGN agreed to acquire Checkmate Pharmaceuticals, Inc. (CMPI). The acquisition should strengthen its portfolio and help it accentuate its cancer treatment research.
On April 14, the European Commission approved the use of Dupixent for children aged 6 to 11 years with severe asthma and type 2 inflammation in Europe. The approval was based on Phase 3 trials, which significantly reduced severe asthma attacks and improved lung function among the children.
In November, the company’s new phase 3 analyses showed that a single dose of REGEN-COV provides long-term protection against COVID-19. It reduced the risk of COVID-19 by 81.6% during the pre-specified follow-up period (months 2-8), maintaining the 81.4% risk reduction during the first month.
In its fiscal fourth quarter (ended Dec. 31, 2021), REGN’s net revenues increased 104% year-over-year to $4.95 billion. Its non-GAAP net income increased 151% from its year-ago value to $2.71 billion, while its income from operations grew 126.2% year-over-year to $2.64 billion. The company’s non-GAAP EPS came in at $23.72, representing a 149% year-over-year improvement.
The $9.91 consensus EPS estimate for its fiscal first quarter (ended March 31, 2022) represents a 0.2% improvement year-over-year. The $2.71 billion consensus revenue estimate for the about-to-be-reported quarter represents a 7% increase from the same period last year. The company has an excellent earnings surprise history; it surpassed the consensus EPS estimates in each of the trailing four quarters. REGN stock has gained 13.4% in price year-to-date.
REGN’s POWR Ratings reflect this promising outlook. The company has an overall B rating, which translates to Buy in our proprietary rating system. The POWR Ratings assess stocks by 118 distinct factors, each with its own weighting.
REGN has a B grade for Value and Quality. Within the Biotech industry, it is ranked #26 of 402 stocks.
To see additional POWR Ratings for Growth, Stability, Sentiment, and Momentum for REGN, click here.
EXEL is an oncology-focused biotech company engaged in discovering, developing, and marketing new medicines for cancer treatment. Its products include CABOMETYX tablets for advanced renal cell carcinoma, COMETRIQ capsules for thyroid cancer, COTELLIC for advanced melanoma, and MINNEBRO for hypertension. EXEL is headquartered in San Francisco.
On March 25, based on results from COSMIC-311, the phase 3 pivotal trial EXEL’s partner, Ipsen, received a positive opinion from CHMP for CABOMETYX (cabozantinib) for patients with previously treated radioactive iodine-refractory differentiated thyroid cancer. This positive recommendation could lead to the availability of a standard treatment option in Europe.
EXEL’s net revenues increased 67.1% year-over-year to $451.14 million in the fourth quarter, ended Dec. 31, 2021. The company’s non-GAAP net income increased 161.6% from the year-ago value to $113.32 million, while its income from operations grew 380.1% year-over-year to $116.64 million. EXEL’s non-GAAP EPS rose 150% from the prior-year quarter to $0.35.
Analysts expect EXEL’s EPS and revenue to increase 18.1% and 11.5%, respectively, year-over-year to $0.85 and $1.60 billion in the current year ending Dec. 31, 2022. EXEL stock has gained 24.5% in price year-to-date to close yesterday’s trading session at $22.76.
EXEL has an overall A rating, which translates to Strong Buy in our proprietary rating system. It is no surprise that EXEL has an A grade for Value and Quality and a B grade for Growth and Sentiment. In the Biotech industry, it is ranked #4 of 402 stocks.
Beyond what we have stated above, we have also given EXEL grades for Momentum and Stability. Get all the EXEL ratings here.
JAZZ is a biopharmaceutical company that is focused on developing and commercializing products that address various unmet medical needs. Its leading products include Xyrem for cataplexy and excessive daytime sleepiness; Sunosi for EDS and obstructive sleep apnea; Erwinaze for acute lymphoblastic leukemia; Defitelio for hepatic veno-occlusive disease; and Zepzelca for small cell lung cancer. JAZZ is headquartered in Dublin, Ireland.
On April 7, JAZZ and Werewolf Therapeutics, Inc. (HOWL) entered a global license and collaboration agreement to develop WTX-613. This collaboration should expand JAZZ’s robust oncology pipeline and the company’s immuno-oncology opportunities.
On March 25, the company, with its subsidiary GW Pharmaceuticals, announced the construction of its new, state-of-the-art manufacturing facility at Kent Science Park. This expansion should support the U.K.’s manufacture of regulatory-approved cannabis-based medicines.
During its fiscal year 2021 fourth quarter (ended Dec. 31, 2021), JAZZ’s net revenues increased 34.7% year-over-year to $896.73 million. Its non-GAAP adjusted net income rose 14.6% from its year-ago value to $262.01 million, while its non-GAAP adjusted EPS came in at $4.21, representing a 5.3% increase year-over-year.
For its fiscal second quarter (ending June 30, 2022), JAZZ’s EPS and revenue are expected to increase 13.8% and 20.9%, respectively, year-over-year to $4.44 and $909.02 million It surpassed the consensus EPS estimates in each of the trailing four quarters, which is impressive. The stock has gained 30.7% in price year-to-date to close the last trading session at $166.54.
JAZZ has a B grade for Growth and Value. The stock is ranked #33 of 402 stocks in the Biotech industry.
Click here to see the other ratings of JAZZ for Momentum, Stability Sentiment, and Quality.
Dublin, Ireland-based ALKS researches, develops, and commercializes pharmaceutical products to address patients’ medical needs in therapeutic areas. The company’s marketed products include ALKERMES, ARISTADA, ARISTADA INITIO, LinkeRx, LYBALVI, NanoCrystal, and VIVITROL.
On February 8, ALKS announced positive results from ENLIGHTEN-Early, a phase 3b study of LYBALVI in patients early in the illness. LYBALVI resulted in less weight gain compared to olanzapine in patients with schizophrenia, schizophreniform disorder, or bipolar I disorder. Such positive results reinforce the potential of LYBALVI as a new treatment option for patients.
ALKS’ total revenue increased 15.9% year-over-year to $324.46 million in its fiscal fourth quarter (ended Dec. 31, 2021). Its non-GAAP net income grew 133.1% from the year-ago value to $38.55 million, while its operating income improved 107.8% year-over-year to $2.38 million over the period. The company’s non-GAAP EPS increased 130% from the year-ago value to $0.23.
Analysts expect ALKS’s revenues to increase 3.4% year-over-year to $259.88 million in its fiscal first quarter (ended March 31, 2022). The company has surpassed the consensus EPS estimates in three of the trailing four quarters. The stock has gained 22.4% in price year-to-date, to close yesterday’s trading session at $28.48.
ALKS’ strong fundamentals are reflected in its POWR Ratings. The stock has an overall A rating, which equates to a Strong Buy in our POWR Ratings system. ALKS also has an A grade for Growth and a B grade for Value, Sentiment, and Quality. The stock is ranked #6 of 402 stocks in the Biotech industry.
Click here to see the other ratings of ALKS for Stability and Momentum.
INCY specializes in the development and commercialization of therapeutics in the United States. The Wilmington, Del., company operates in two therapeutic areas: Hematology/Oncology; and Inflammation and Autoimmunity. It offers JAKAFI (ruxolitinib), MONJUVI (tafasitamab-cxix)/MINJUVI (tafasitamab), PEMAZYRE (pemigatinib), ICLUSIG (ponatinib), OPZELURA (ruxolitinib) cream and other clinical development programs.
On March 26, INCY announced that nearly 40% of adults with severe alopecia areata taking OLUMIANT 4-mg saw at least 80% scalp hair coverage at 52 weeks in Eli Lilly and Company’s (LLY) pivotal phase 3 studies. Such positive results could make OLUMIANT the first-ever medicine for the treatment of alopecia areata.
On March 25, the company announced CHMP’s recommendation approval of ruxolitinib for treating acute or chronic GVHD patients aged 12 and older. With this positive opinion, ruxolitinib could become the first JAK1/2 inhibitor in Europe.
During its fiscal year 2021 (ended December 31), INCY’s net revenues increased 12% year-over-year to $2.99 billion. The company’s non-GAAP net income improved 776.1% year-over-year to $611.98 million, while its non-GAAP EPS grew 757.1% from the prior-year quarter to $2.76.
Analysts expect INCY’s revenues to increase 24.3% year-over-year to $751.49 million in its fiscal first quarter (ended March 31, 2022). Its EPS is expected to increase 2.8% to $0.69 in the about-to-be-reported quarter. INCY also has an impressive earnings surprise history; it surpassed the consensus EPS estimates in three of the trailing four quarters. Shares of INCY have gained 8.3% in price year-to-date.
INCY’s strong fundamentals are reflected in its POWR Ratings. The stock has an overall A rating, which equals Strong Buy in our proprietary rating system. INCY also has an A grade for Sentiment and a B grade for Value and Quality. The stock is ranked #2 among 402 stocks in the Biotech industry.
In addition to the POWR Ratings I have just highlighted, click here to see the INCY ratings for Growth, Momentum, and Stability.
REGN shares were trading at $719.42 per share on Wednesday afternoon, up $3.20 (+0.45%). Year-to-date, REGN has gained 13.92%, versus a -5.99% rise in the benchmark S&P 500 index during the same period.
About the Author: Shweta Kumari
Shweta’s profound interest in financial research and quantitative analysis led her to pursue a career as an investment analyst. She uses her knowledge to help retail investors make educated investment decisions.
Adobe vs. Synopsys: Which Growth Stock is a Better Buy?
Despite aggressive interest rate hikes expectations and other factors keeping the market volatile, the recovering labor market and substantial corporate profits have driven the performance of some quality growth stocks like Synopsys (SNPS) and Adobe (ADBE). But which of these two stocks is a better buy now? Read more to find out.
shutterstock.com – StockNews
Since the beginning of the year, the stock market has been quite volatile due to concerns over surging inflation, a war in Eastern Europe, rising energy prices, supply chain disruption, and aggressive monetary policy tightening. However, the U.S. added431,000 jobs in March, bringing the unemployment rate to 3.6%. Moreover, According to data from FactSet, 7% of S&P 500 companies have reported first-quarter results so far, with77% of them topping EPS expectations. So, growth-based companies with solid fundamentals and robust growth prospects could generate market-beating returns in the long run, dodging short-term fluctuations. Therefore, both Synopsys, Inc. (SNPS) and Adobe Inc. (ADBE) should benefit.
SNPS provides electronic design automation software products used to design and test integrated circuits. Its offerings include Fusion Design Platform, Verification Continuum Platform, and FPGA design products. ADBE operates as a diversified software company worldwide. It operates through three segments: Digital Media, Digital Experience, and Publishing and Advertising.
SNPS has lost 19% year-to-date and ADBE is down 25% during that same time period. Which of these two stocks is a better buy now? Let’s find out.
Latest Developments
On March 30, 2022, SNPS announced a new cloud-optimized electronic design automation deployment model that delivers unparalleled levels of chip and system design flexibility via a single-source, pay-as-you-go approach to drive significantly greater productivity and efficiency for increasingly complex chip designs.
On March 22, 2022, Dan Durn, executive vice president and CFO of ADBE, said, “Our momentum, product innovation and immense market opportunity position us for success in 2022 and beyond.”
Recent Financial Results
SNPS’ revenue increased 30.9% year-over-year to $1.27 billion for the fiscal first quarter ended January 31, 2022. The company’s non-GAAP net income came in at $376.90 million, representing a 57.4% year-over-year increase. Also, its non-GAAP EPS came in at $2.40, up 57.9% year-over-year.
ADBE’s revenues increased 9.1% year-over-year to $4.26 billion for the fiscal first quarter ended March 4, 2022. The company’s non-GAAP net income came in at $1.60 billion, representing a 5.7% year-over-year increase. Also, its non-GAAP EPS came in at $3.37, up 7.3% year-over-year.
Past and Expected Financial Performance
SNPS’ EBITDA and leveredFCF grew at CAGRs of 27% and 102.5%, respectively, over the past three years. Analysts expect SNPS’ revenue to increase 14.4% in the current year and 11.4% next year. The company’s EPS is expected to grow 15.5% in the current year and 15.6% next year. Moreover, its EPS is expected to grow at 16.2% per annum over the next five years.
On the other hand, ADBE’s EBITDA and levered FCF grew at CAGRs of 25.6% over the past three years. The company’s revenue is expected to increase 13.1% in the current year and 14.7% next year. Its EPS is expected to grow 9.5% in the current year and 17.9% next year. Also, ADBE’s EPS is expected to increase at 14.3% per annum over the next five years.
Profitability
ADBE’s trailing-12-month revenue is 3.59 times what SNPS generates. ADBE is also more profitable, with a gross profit margin and net income margin of 88.04% and 29.90% compared to SNPS’ 80.89% and 20.18%, respectively
Furthermore, ADBE’s ROE, ROA, and ROTC of 35.34%, 14.54%, and 20.19% are higher than SNPS’ 17.66%, 7.23%, and 10.62%, respectively.
Valuation
In terms of trailing-12-month EV/S, ADBE is currently trading at 11.13x, 20.2% higher than SNPS’ 9.26x. However, SNPS’ trailing-12-month EV/EBITDA ratio of 26.33x is 17% higher than ADBE’s 22.50x.
POWR Ratings
SNPS has an overall rating of A, which equates to a Strong Buy in our proprietary POWR Ratings system. On the other hand, ADBE has an overall rating of C, which translates to Neutral. The POWR Ratings are calculated considering 118 different factors, with each factor weighted to an optimal degree.
SNPS has a B grade for Growth and Sentiment. On the other hand, ADBE has a C grade for Growth and Sentiment.
Of the 159 stocks in theSoftware – Application industry, SNPS is ranked #7. In comparison, ADBE is ranked #39.
Beyond what I’ve stated above, we have also rated the stocks for Quality, Value, Momentum, and Stability.Click here to view all the SNPS ratings. Also, get all the ADBE ratingshere.
The Winner
The reopening economy has been driving the growth prospects of many companies. While both SNPS and ADBE are expected to gain, it is better to bet on SNPS now because of its better financials.
Our research shows that odds of success increase when one invests in stocks with an Overall Rating of Strong Buy or Buy. View all the other top-rated stocks in the Software – Application industryhere.
ADBE shares were trading at $434.40 per share on Tuesday afternoon, up $8.93 (+2.10%). Year-to-date, ADBE has declined -23.39%, versus a -6.37% rise in the benchmark S&P 500 index during the same period.
About the Author: Nimesh Jaiswal
Nimesh Jaiswal’s fervent interest in analyzing and interpreting financial data led him to a career as a financial analyst and journalist. The importance of financial statements in driving a stock’s price is the key approach that he follows while advising investors in his articles.
 shutterstock.com – StockNews