Take Advantage of These 5 ‘Strong Buy’ Stocks Down More Than 10% YTD

Amid deepening supply disruptions and record-high inflation, expected aggressive federal interest rate increases, and the resurgence of COVID-19 cases have been driving market volatility. However, we think quality stocks Agilent (A), Olympus (OCPNY), F5 (FFIV), Jones Lang LaSalle (JLL), and United Therapeutics (UTHR), which are down more than 10% in price year-to-date, could be solid bets now because hopes for an economic recovery still predominate. These stocks are rated Strong Buy in our proprietary rating system. Read on.

shutterstock.com – StockNews

The Russia-Ukraine war has aggravated logistical disruptions worldwide. Furthermore, Citigroup expects the Fed to deliver half-point rate increases at its next four meetings. In addition, as oil and gas prices witness heavy fluctuations amid the resurgence of COVID-19 cases in many countries and Western sanctions on Russia, the market is predicted to remain volatile in the near term. However, chances of an economic rebound have not yet been ruled out.

According to CNBC’s Jim Cramer, investors should always watch for bounce, even when all seems hopeless. Therefore, beaten-down stocks with robust financials might offer solid returns to investors.

Fundamentally strong stocks Agilent Technologies, Inc. (A), Olympus Corporation (OCPNY), F5, Inc. (FFIV), Jones Lang LaSalle Incorporated (JLL), and United Therapeutics Corporation (UTHR) have declined more than 10% in price year-to-date, but they are rated Strong Buy in our proprietary rating system.

Agilent Technologies, Inc. (A)

Santa Clara, Calif.-based provides application-focused solutions to the life sciences, diagnostics, and applied chemical markets worldwide. Its segments are Life Sciences and Applied Markets; Diagnostics and Genomics; and Agilent CrossLab.

On Feb. 22, 2022, Mike McMullen, A’s president and CEO, said, “Building on our first-quarter results, combined with a strong order book, we are raising our full-year outlook, increasing our core growth and non-GAAP EPS expectations. The Agilent portfolio and team have never been stronger. I’m confident we will continue our outstanding execution for the remainder of the year.”

For its fiscal year 2022 first quarter, ended Jan. 31, 2022, A’s net revenue increased 8.1% year-over-year to $1.67 billion. The company’s non-GAAP net income came in at $368 million, up 12.2% year-over-year, while its non-GAAP EPS was  $1.21, up 14.2% year-over-year.

Analysts expect A’s revenue to be $6.14 billion in 2022, representing a 10.3% year-over-year increase. The company’s EPS is also expected to rise 15.1% to $4.41 in 2022. In addition, it has surpassed the consensus EPS estimates in three of the trailing four quarters. The stock has declined 15% in price year-to-date to close Friday’s trading session at $135.71.

A’s strong fundamentals are reflected in its POWR Ratings. The stock has an overall A rating, which indicates a Strong Buy in our proprietary rating system. The POWR Ratings assess stocks by 118 distinct factors, each with its own weighting.

A has a B grade for Growth, Value, Stability, Sentiment, and Quality. It is ranked #2 of 52 stocks within the Medical – Diagnostics/Research industry. Click here to see the additional POWR Ratings for A (Momentum).

Click here to checkout our Healthcare Sector Report for 2022

Olympus Corporation (OCPNY)

Headquartered in Tokyo, Japan, OCPNY manufactures and sells precision machinery and instruments worldwide. It operates through four segments: Endoscopic Solutions Business; Therapeutic Solutions Business; Scientific Solutions Business; and Others.

On Nov. 12, 2021, OCPNY announced the establishment of Olympus Innovation Ventures to invest in pioneering start-ups for improving clinical outcomes at an affordable cost. Nacho Abia, OCPNY’s COO, said, “This effort is another way Olympus demonstrates its commitment to excellence and creating tangible value for providers and patients. We believe we will play a meaningful role in advancing minimally invasive care and new ways to detect, monitor, and treat conditions and diseases.”

OCPNY’s revenue increased 22.6% year-over-year to ¥629.76 billion ($5.12 billion) for the nine months ended Dec.31, 2021. Its profit came in at ¥87.85 billion ($713.57 million), up 5,240.4% year-over-year, while its EPS came in at ¥68.16, up 5,309.5% year-over-year.

Analysts expect OCPNY’s revenue to increase 5.8% year-over-year to $7.55 billion for its fiscal period ending March 31, 2023. Its EPS is estimated to grow 7.2% per annum for the next five years. The stock has declined 18% in price year-to-date to close Friday’s trading session at $18.97.

OCPNY has an overall A rating, which indicates a Strong Buy in our POWR Ratings system. It has a B grade for Value, Stability, and Quality. Within the Medical – Devices & Equipment industry, OCPNY is ranked #5 of 164 stocks. Click here to see the additional POWR Ratings for Growth, Momentum, and Sentiment for OCPNY.

Click here to checkout our Healthcare Sector Report for 2022

F5, Inc. (FFIV)

FFIV provides multi-cloud application security and delivery solutions for the security, performance, and availability of network applications, servers, and storage systems. The  Seattle, Wash., company has partnerships with Amazon Web Services, Microsoft Azure, and Google Cloud Platform.

On Jan. 25, 2022, François Locoh-Donou, F5’s president and CEO, said, “Demand drivers across our business are as strong as they have ever been. Customers increasingly see F5 as an innovator uniquely equipped to help them build and scale their traditional and modern application environments with our software- and systems-based solutions.”

FFIV’s total net revenues for the first quarter, ended Dec. 31, 2021, came in at $687.10 million, up 10% year-over-year. Its net income came in at $93.56 million, up 6.7% year-over-year, while its EPS came in at $1.51, up 7.1% year-over-year.

For its fiscal year 2023, analysts expect FFIV’s revenue to increase 9.5% year-over-year to $3.02 billion. Its EPS is estimated to grow 19.8% to $12.76 in 2023. In addition, it has surpassed the consensus EPS estimates in each of the trailing four quarters. The stock has lost 14.2% year-to-date to close Friday’s trading session at $209.86.

FFIV’s strong fundamentals are reflected in its POWR Ratings. The stock has an overall A rating, which indicates a Strong Buy in our proprietary rating system.

It has an A grade for Quality and a B grade for Growth and Value. Within the Software – Business industry, it is ranked #2 of 59 stocks. Click here to see the additional POWR Ratings for Momentum, Sentiment, and Stability for FFIV.

Click here to check out our Software Industry Report for 2022

Jones Lang LaSalle Incorporated (JLL)

JLL in Chicago is a professional services company that provides real estate and investment management services in the Americas, Europe, the Middle East, Africa, and Asia Pacific. It is a leading professional services firm that specializes in real estate and investment management.

On Feb. 28, 2022, JLL’s CEO, Christian Ulbrich, said, “During the past year, we made incremental investments in our business to drive future growth and increased capital returns to shareholders. As we enter 2022, JLL is well-positioned to seize the significant opportunities across the commercial real estate sector and continue to generate long-term value for stakeholders.”

For the fourth quarter, ended Dec. 31, 2021, JLL’s revenue came in at $5.95 billion, up 22.7% year-over-year. Its adjusted net income was  $447 million, up 62.1% year-over-year, while its adjusted EPS came in at $8.66, up 63.7% year-over-year.

JLL’s revenue is expected to increase 14.3% to $9.96 billion in 2023. Its EPS is expected to grow 9% per annum for the next five years. It surpassed EPS estimates in each of the four trailing quarters. The stock has declined 12.7% in price year-to-date to close Friday’s session at $235.13.

JLL’s POWR Ratings reflect its promising outlook. It has an overall A rating, which represents a Strong Buy in our POWR Ratings system.

JLL has a B grade for Growth and Quality. It is ranked #2 of 45 stocks in the Real Estate Services industry. Click here to see the additional POWR Ratings for JLL (Value, Momentum, Stability, and Sentiment).

United Therapeutics Corporation (UTHR)

UTHR in Silver Spring, Md., is a biotechnology company, engages in the development and commercialization of products to address the unmet medical needs of patients with chronic and life-threatening diseases in the United States and internationally.

On Feb. 24, 2022, Martine Rothblatt, Ph.D., chairperson and CEO of UTHR, said, “We continue to make strong progress with patient growth as we reach 25,000 patients with our therapies by the end of 2025. The recent transplants of our xenoheart and xenokidney products demonstrate the tremendous potential of our business model for the second half of the 2020s and beyond.”

UTHR’s revenues increased 7.9% year-over-year to $415.20 million for the fourth quarter, ended Dec. 31, 2021. Its non-GAAP earnings came in at $168 million, up 12.5% year-over-year, while its non-GAAP EPS came in at $3.51, up 6% year-over-year.

UTHR’s revenue is expected to increase 12.3% year-over-year to $2.08 billion in 2023. Its EPS is estimated to increase 56.2% to $15.71 in 2022. The stock has lost 19.1% year-to-date to close Friday’s session at $174.84.

UTHR has an overall A grade, which equates to a Strong Buy in our POWR Ratings system. Also, it has an A grade for Value and a B grade for Growth and Quality. It is ranked #8 of 422 stocks in the Biotech industry. Click here to see Momentum, Stability, and Sentiment ratings for UTHR


A shares were trading at $136.97 per share on Monday morning, up $1.26 (+0.93%). Year-to-date, A has declined -14.09%, versus a -4.43% rise in the benchmark S&P 500 index during the same period.


About the Author: Riddhima Chakraborty

Riddhima is a financial journalist with a passion for analyzing financial instruments. With a master’s degree in economics, she helps investors make informed investment decisions through her insightful commentaries.

More…

The post Take Advantage of These 5 ‘Strong Buy’ Stocks Down More Than 10% YTD appeared first on StockNews.com

https://www.entrepreneur.com/article/423258


Why Stagflation Concerns Persist and Where the Market Will Go Next

The S&P 500 (SPY) enjoyed a second straight week in the plus column as the rally now has us closer to the all time highs than the previous lows. This is helping thaw investor sentiment with visions of more upside to come. However, before we read a eulogy for the correction, and get back to gung ho bullish, we do need to ponder some of the negatives that are still abounding. Meaning to explore the reasons that some well respected investors are concerned that stagflation and/or a recession are in our future which obviously would not be a positive for stock prices. That is the mission of this week’s commentary to help us plot our path forward. Read on below for more….

shutterstock.com – StockNews

(Please enjoy this updated version of my weekly commentary published March 25th, 2022 from the POWR Value newsletter).

Earlier this week I posted a commentary that contemplated the vital topic of…Is a Recession Coming?

I am going to share the majority of that commentary below followed by the latest information on the economy to see if the recession warning sirens grow louder or softer:

“The place to start this discussion is with the following article published last week on CNBC:

Forecasters see growing chance of a recession as Fed hikes rates this year to fight inflation.

This is a monthly survey of economists to measure the average outlook for the US economy. And here are the key excerpts from that article:

“The probability of a recession in the U.S. was raised to 33% in the next 12 months, up 10 percentage points from the Feb. 1 survey… Respondents debated whether the recent surge in commodity prices would prompt the Fed to hike rates faster because it adds to inflation or raise rates less because they reduce growth… The average GDP forecast for this year slipped by 0.8 percentage point but remains at a slightly above-trend 2.8%. The GDP forecast for 2023 dropped by about a half a point from the last survey to 2.4%.”

Your first reaction is probably a sigh of relief that only 1/3rd of economists has this pessimistic outlook. Now the scarier notion is to find out that historically only 40-50% of economists were predicting a recession before it actually occurred.

Indeed, it is a very inexact science and why the current level of concern is actually quite high.

Now let’s contemplate this very thoughtful piece from one of my favorite market commentators, John Mauldin: Brace for (Recession) Impact

For the past year Mauldin has urged folks to consider the possibility of 1970’s style stagflation. That is an ugly economic environment where a stagnant economy emerges at the same time as high inflation.

And yes at that time it was about surging energy prices (folks my age or older will certainly remember the gas shortages and long lines at the pump across the US).

John originally contemplated the possibility of this happening. Now he fears that the Russia/Ukraine crisis, with related energy shock, was the last piece of the stagflation puzzle.

Is Mauldin right???

That indeed is the $64,000 question (more like $85 trillion question given the size of the world economy).

Now let’s go back to the previous statement…economics is an inexact science. So for as much as I appreciate Mauldin’s contemplation of stagflation…I don’t believe it is a forgone conclusion.

That sentiment is echoed in the previous clips from the economists survey showing the +2.8% GDP growth expectation for this year and +2.4% for next year.

So Reity…why even bring it up?

Because it COULD come true and we would be wise to stay vigilant looking for signs of that potential. That is why we are not back to 100% long the stock market even as we broke above the 200 day moving average today.

…If the threats of stagflation, world crisis and/or recession grows…then we will get more and more defensive.

If these threats prove to be nothing more than false boogeymen…and the economy and bull market stay on track, then we will become more aggressively long the stock market.

Just remember that the most bullish happening right now is we still have historically low interest rates making stocks the MUCH BETTER VALUE than bonds. That is no doubt behind the recent bounce as it was behind the March 2020 bounce when the Coronavirus crisis was far from being solved.

This last part explains our bullish bias now even in the midst of an unclear and unsettling environment.”

End of Previous Commentary. Now on with fresh insights on the economy to see if we are right to stay with our bullish bias in place.

Gladly the economic news looks pretty good starting with the lowest jobless claims report since 1969…yes, 1969.

This important measure of employment health tells you that employers are not yet worried about their business outlook even as inflation rises…supply chain concerns…and all the supposed worries about Russia/Ukraine.

Meaning that if those boogeymen were truly haunting business people it would lead to deterioration of the employment picture…not an improvement like the best jobless claims report in over 50 years.

Next lets check out the broader economic readings found in the PMI Flash report. There we see the Services component on the rise from a heathy 56.5 to an even healthier 58.9.

Same song for Manufacturing which churned out a 58.5 reading versus 57.3 previously.

Add them together and we have a Composite reading of 58.5. And just a reminder, everything above 50 points to economic expansion. And everything north of 55 is a sign of robust improvement.

So here again, if there were even a little bit of signs of weakness they should start creeping into these reports. I am not saying they would dive directly under 50 as proof of problems.

Perhaps seeing it slink lower and lower and thus getting closer to 50 where we would be more worried about a looming correction.

Simply not happening at this moment. So stick will bullish bias. BUT most certainly keep watching these economic readings in weeks and months ahead because we will want to get more defensive at the first serious sign of economic weakness.

What To Do Next?

If you’d like to see more top value stocks, then you should check out our free special report:

7 SEVERELY Undervalued Stocks

What makes these stocks great additions to any portfolio?

First, because they are all undervalued companies with exciting upside potential.

But even more important, is that they are all A rated Strong Buys according to our coveted POWR Ratings system. Yes, that same system where top-rated stocks have averaged a +31.10% annual return.

Click below now to see these 7 stellar value stocks with the right stuff to outperform in the coming months.

7 SEVERELY Undervalued Stocks

All the Best!


Steve Reitmeister
CEO StockNews.com & Editor of POWR Value trading service


SPY shares closed at $452.69 on Friday, up $2.20 (+0.49%). Year-to-date, SPY has declined -4.39%, versus a % rise in the benchmark S&P 500 index during the same period.


About the Author: Steve Reitmeister

Steve is better known to the StockNews audience as “Reity”. Not only is he the CEO of the firm, but he also shares his 40 years of investment experience in the Reitmeister Total Return portfolio. Learn more about Reity’s background, along with links to his most recent articles and stock picks.

More…

The post Why Stagflation Concerns Persist and Where the Market Will Go Next appeared first on StockNews.com

https://www.entrepreneur.com/article/423191


5 Signs of a NEW Stock Market Bubble

Value investors are pounding the table that the stock market (SPY) is already in bubble territory not unlike 1999. Indeed they are right about the lofty valuation levels. But they are wrong that it’s time to get ready for the next bear market to emerge even with rising inflation…even with Russia/Ukraine crisis. Check out Steve Reitmeister’s game plan to ride the bubble up and then parachute out at the right time. Read on for more.

shutterstock.com – StockNews

Spoiler Alert: Yes, we are in the midst of another stock market bubble.

The proof is quite evident in 5 key valuation metrics showing that we are at or above the levels hit during the tech bubble of the late 1990’s. And that is even after the recent correction brought on by the Russia/Ukraine crisis.

This leads to many questions:

  • What is keeping stocks aloft?
  • How long will this bubble last?
  • What is the trading plan to ride stocks higher?
  • And how to parachute out before the bubble explodes?

I answer these questions and more in my latest presentation recorded live at the MoneyShow Virtual Expo this past week entitled: Is THIS Another Stock Market Bubble?

Click Here to Watch Now >>

Just a few more details on the presentation.

I start by reviewing 5 classic valuation metrics which show, beyond a shadow of a doubt, we are very much in bubble territory. In fact, most of these measures are even worse than experienced during the last valuation bubble in 1999 leading to the bear market that began in 2000.

Next we talk about the recent detour from the bubble brought on by the Russia/Ukraine crisis. This includes historical perspective on how military conflicts actually turn out to be bullish for the stock market even after the initial fear that sparks a sell off.

Yes, I know that many are reading this article and assume that an existing bubble means to run for the hills now. However, there is good reason to believe there is another 12-24 months of further price upside to go before the bubble bursts.

So we will talk about the strategies to ride this bubble higher and prepare to parachute out before it explodes. In fact, there is one key metric I can share with you that pretty clearly points out when the bull party will be over and the bear will come out of hibernation.

It’s true that the rising tide raises all boats. So most investors will enjoy gains from the bubble growing ever larger. However, I do share my “Trading Plan to Outperform” by laying out key trading strategies and industry groups to top the market in the year ahead. This analysis includes the stocks to avoid in the coming year.

This culminates in a preview of my top 10 stocks and 4 ETFs for today’s market. The one’s I am recommending to investors to stay ahead of the pack.

All this and more awaits you in this very concise presentation: Is THIS Another Stock Market Bubble?  

Click Here to Watch Now >>


Steve Reitmeister

…but everyone calls me Reity (pronounced “Righty”)
CEO, Stock News Network and Editor, Reitmeister Total Return


SPY shares rose $0.20 (+0.04%) in after-hours trading Thursday. Year-to-date, SPY has declined -4.86%, versus a % rise in the benchmark S&P 500 index during the same period.


About the Author: Steve Reitmeister

Steve is better known to the StockNews audience as “Reity”. Not only is he the CEO of the firm, but he also shares his 40 years of investment experience in the Reitmeister Total Return portfolio. Learn more about Reity’s background, along with links to his most recent articles and stock picks.

More…

The post 5 Signs of a NEW Stock Market Bubble appeared first on StockNews.com

https://www.entrepreneur.com/article/423099


Should I Stay Or Should I Go

Two tried and true ways to tame market uncertainty and make volatility work in your favor.

shutterstock.com – StockNews

The title for this week’s article comes from one of my favorite songs from one of my favorite bands- The Clash. No doubt that the Bulls and Bears have been clashing since the beginning of the year.

Volatility certainly has returned in a big way to the markets. The Fed hiking rates and the ongoing geopolitical turmoil out of Ukraine adds to the uncertainty. Although the VIX has softened recently, it remains at elevated levels. The Average True Range (ATR) in the SPY, a measure of actual volatility, reached the highest levels since the Covid Crisis.

The recent quote below from our Stock News CEO Steve Reitmeister sums it up:

If you enjoy the volatile nature of the current stock market (SPY), then I recommend you get your head examined. For the other 99.9% of you, these are unsettling times and it requires a clear outlook and disciplined approach to navigating these choppy waters. 

I wholeheartedly agree with Steve about having a clear outlook and disciplined approach in any market environment- but especially now.

Maybe it’s my option trader nature to embrace the suck, to borrow that military term. But call me crazy and count me in the 0.1% who enjoy the current volatility. To me, volatility begets opportunity.

The opening line from If- by Rudyard Kipling exemplifies this notion:

If you can keep your head when all about you are losing theirs

Somehow, I have now tied Steve to Rudyard Kipling. Now let’s tie a couple simple and straight-forward option trading strategies to these volatile markets. It is a way to position to profit from uncertainty and better embrace the suck. All while reducing your overall risk.

Option prices are still high. This means favoring option selling strategies when structuring trades. Both of these approaches incorporate selling to take advantage of the historically rich option premiums.

Selling Covered Calls

A covered call is the combination of a long stock postion and a short call position-hence the term covered. It involves buying 100 shares of stock and selling 1 call option for every 100 shares of stock purchased. Most traders tend to sell slightly out-of-the money covered calls to still allow some upside appreciation in the stock.

For example, Apple (AAPL) stock closed at $163.98 on Friday. The June $170 calls closed at $6.30. Buying 100 shares of AAPL stock and selling 1 of the June $170 calls would cost $157.68. This reduces the cost of the AAPL stock purchase by nearly 4%. It does, however, limit gains if AAPL stock gets to above $170-or 3.67% higher.

In essence, you give up some of the upside to protect some of the downside. The upside is greater and the downside is less since option prices are compartaively more expensive now.  You can also sell calls against existing long stock positions to hedge some of the downside in a similar manner.

Selling Puts

Buying puts gives the buyer the right to sell stock at the strike price. Selling puts obligates the seller to be a buyer of  the stock at the strike price. Most traders sell slightly out-of-the money puts to allow for some downside cushion.

Let’s look at selling Microsoft (MSFT) puts. Microsoft closed at $300.43 Friday. The June $285 puts ($15.43 out-of-the-money) closed at roughly $10.50. Selling the June $285 put would bring in $1,050 in option premium ($10.50 x 100). It would also obligate the seller of the put to be a buyer of MSFT stock at $285 if Microsoft was below $285 at June 17 expiration.

Break-even on the trade is the strike price of $285 less the option premium received of $10.50. This equates to $274.50 or 8.3% lower than the current price of MSFT stock.

You get paid up front now to be a buyer of Microsoft later at lower levels. Higher option prices means the amount you get paid upfront is larger and the price you may ultimately buy at is lower. Important to sell puts equal to the number of shares you are willing to buy.

Selling puts is a way to be a buyer on a dip. Selling covered calls pre-positions you to be a seller on a rally. Combining the two strategies allows you to both stay and go at pre-determined levels.

Vital to remember that the other song on the double-sided A single along with “Should I Stay Or Should I Go” was “Straight To Hell”. In this market environment, it is wise to remain fearless but never reckless. Take advantage of the opportunities from volatility in a decisive but disciplined manner with some covered calls or put sales.

POWR Options

What To Do Next?

If you’re looking for the best options trades for today’s market, you should check out our latest presentation How to Trade Options with the POWR Ratings. Here we show you how to consistently find the top options trades, while minimizing risk.

If that appeals to you, and you want to learn more about this powerful new options strategy, then click below to get access to this timely investment presentation now:

How to Trade Options with the POWR Ratings

All the Best!

Tim Biggam

Editor, POWR Options Newsletter


SPY shares closed at $444.52 on Friday, up $3.45 (+0.78%). Year-to-date, SPY has declined -6.41%, versus a % rise in the benchmark S&P 500 index during the same period.


About the Author: Tim Biggam

Tim spent 13 years as Chief Options Strategist at Man Securities in Chicago, 4 years as Lead Options Strategist at ThinkorSwim and 3 years as a Market Maker for First Options in Chicago. He makes regular appearances on Bloomberg TV and is a weekly contributor to the TD Ameritrade Network “Morning Trade Live”. His overriding passion is to make the complex world of options more understandable and therefore more useful to the everyday trader. Tim is the editor of the POWR Options newsletter. Learn more about Tim’s background, along with links to his most recent articles.

More…

The post Should I Stay Or Should I Go appeared first on StockNews.com

https://www.entrepreneur.com/article/422675


Could the Worst of the Stock Market Correction Be Behind Us?

The S&P 500 (SPY) has bounced an impressive +7.2% over the last four sessions. That certainly raises some eyebrows about the possibility that this correction may be over. Whereas we all want it to be true, there is still reason for a dose of caution before giving a eulogy for this correction. We will talk more about the current state of the market, and where we likely head next in this edition of the POWR Value commentary. Read on below for more….

shutterstock.com – StockNews

(Please enjoy this updated version of my weekly commentary published March 18th, 2022 from the POWR Value newsletter).

Market Maxim 1 = Buy the Rumor, Sell the News

Let’s start here. Did the market bounce this week because…

Russia/Ukraine crisis is over? Clearly not

Raging inflation is over? Again, clearly not. Even the Fed is being a bit more vocal about it not being as “transitory” as they previously stated. But if there is a positive to point to, the spike in oil to $125 a barrel earlier in March that quickly abated.

Yet still the price at the pump is shocking to most, which is never a positive for consumer behavior.

The Fed is now being more accommodative? Once again, a hearty NO as they announced on Wednesday their first rate hike in a long time with the intention of another 6 hikes this year given concerns over inflation.

This included a reduction in their economic outlook for the year.

The reason for doing this roll call is because these were also the 3 reasons most oft stated for why the market was in correction mode with fear of even more downside to come.

So if these situations did not improve, then it is a little bit of a head scratcher as to why we have enjoyed such an extended rally from recent bottom.

One theory would be to review classic investment sayings like:

“Be greedy when others are fearful”

“The market climbs a wall of worry”

Both of these harken back to the idea that investors are often forward looking and thus stocks will bounce back BEFORE the proof of improvement is in hand.

Another theory is that to go down much further would be to move into bear market territory. That takes a lot of investor conviction to believe the economy is heading to recession when no such evidence is at hand.

This would lead to a bounce from bottom…but not go much higher until we have more proof that the worst is behind us.

Interestingly we closed the session today above the 50 day moving average (4,432) for the first time in a while. And ever closer to the long term trend line of the 200 day moving average @ 4,470.

I suspect that this bounce is really a combination of these two different theories at play. And that stocks will likely consolidate around the 200 day moving average for a while until more evidence rolls in.

If the bearish trends surrounding Russia/Ukraine crisis and/or inflation worsen, then likely we will retest the recent lows of 4,161…or perhaps finally test the scarier level of 4,000.

On the other hand, the more comfortable we become with the outlook for the economy, even with Russia/Ukraine not resolved, the more likely we are to break above the 200 day moving average.

Perhaps we only make it back to the previous highs of 4,800. That is the current Goldman Sachs view for 2022. Or hopefully a notch higher.

That may not sound like the most robust investing environment. But after 2 years of outsized returns, it is not uncommon for the market to lay an egg as investors squeeze out excesses on overripe stocks.

Gladly, these are the best of times for value investors as the rest of the market comes around to our way of thinking. This explains why we are up +1.82% this year when the S&P 500 is down -6.36% and the famed Ark Innovation Fund (ARKK) is still down -30.47%.

I like our odds to further that over other investors as the year progresses.

What To Do Next?

If you’d like to see more top value stocks, then you should check out our free special report:

7 SEVERELY Undervalued Stocks

What makes these stocks great additions to any portfolio?

First, because they are all undervalued companies with exciting upside potential.

But even more important, is that they are all A rated Strong Buys according to our coveted POWR Ratings system. Yes, that same system where top-rated stocks have averaged a +31.10% annual return.

Click below now to see these 7 stellar value stocks with the right stuff to outperform in the coming months.

7 SEVERELY Undervalued Stocks

All the Best!


Steve Reitmeister

CEO StockNews.com & Editor of POWR Value trading service


SPY shares closed at $444.52 on Friday, up $3.45 (+0.78%). Year-to-date, SPY has declined -6.41%, versus a % rise in the benchmark S&P 500 index during the same period.


About the Author: Steve Reitmeister

Steve is better known to the StockNews audience as “Reity”. Not only is he the CEO of the firm, but he also shares his 40 years of investment experience in the Reitmeister Total Return portfolio. Learn more about Reity’s background, along with links to his most recent articles and stock picks.

More…

The post Could the Worst of the Stock Market Correction Be Behind Us? appeared first on StockNews.com

https://www.entrepreneur.com/article/422657


2 FAANG Stocks Wall Street Predicts Will Rebound by More Than 33%

Despite the expectation that the Fed will raise rates several times this year, investing in quality FAANG stocks could be rewarding as they are expected to generate steady returns. Wall Street analysts expect Amazon (AMZN) and Netflix (NFLX) to surge more than 33% in the near term.

shutterstock.com – StockNews

The tech companies have faced severe selling pressure on concerns over the Fed raising rates several times this year to control multi-decade high inflation. While a rising-interest-rate environment could mar the growth of technology companies, it could be wise to consider FAANG stocks, which represent Meta Platforms (FB), formerly known as Facebook, Amazon (AMZN), Apple (AAPL), Netflix (NFLX), and Alphabet (GOOGL), due to their stable and low-risk nature.

Even though global supply chain disruption could dampen the technology industry’s expansion, increasing demand for advanced technologies amid the accelerating digital transformation should drive its growth.

Given the market dominance of FAANG, analysts are highly optimistic about the near-term performance of AMZN and NFLX. So, it could be wise to add these stocks to your watch list.

Amazon.com, Inc. (AMZN)

E-commerce giant AMZN engages in the retail sale of consumer products and subscriptions internationally. It operates through North America; International; and Amazon Web Services.

On March 01, 2022, AMZN announced that its Luna cloud gaming service is now available for all customers in the mainland United States with an expanded library of games and new features. This could lead to increasing demand for its solution.

AMZN’s net sales increased 9% year-over-year to $137.40 billion for the fourth quarter ended December 31, 2021. The company’s net income grew 98.6% year-over-year to $14.30 billion. Also, its EPS came in at $27.75, up 96.9% year-over-year.

For fiscal 2023, analysts expect AMZN’s EPS and revenue to increase 49% and 17.2% year-over-year to $72.89 and $634.73 billion, respectively. It surpassed Street EPS estimates in three of the trailing four quarters. Wall Street analysts expect the stock to hit $4,192.55 in the near term, which indicates a potential upside of 37.7%.

Netflix, Inc. (NFLX)

NFLX provides entertainment services. It offers TV series, documentaries, and feature films across various genres and languages. The company provides members the ability to receive streaming content through a host of Internet-connected devices.

On March 2, 2022, NFLX announced that it had entered into a combination agreement to acquire Next Games. Michael Verdu, Vice President of Games, NFLX, said, “We are excited for Next Games to join Netflix as a core studio in a strategic region and key talent market, expanding our internal game studio capabilities.”

NFLX’s total revenue increased 16% year-over-year to $7.72 billion for the fiscal fourth quarter ended December 31, 2021. The company’s net income came in at $607 million, representing a 12% year-over-year increase. Also, its EPS came in at $1.33, up 11.76% year-over-year.

Analysts expect NFLX’s EPS and revenue to increase 30.8% and 12.5% year-over-year to $14.40 and $37.58 billion, respectively, in fiscal 2023. It surpassed the consensus EPS estimates in three of the trailing four quarters. Wall Street analysts expect the stock to hit $511.59 in the near term, which indicates a potential upside of 41.1%.


AMZN shares were unchanged in after-hours trading Thursday. Year-to-date, AMZN has declined -5.69%, versus a -7.14% rise in the benchmark S&P 500 index during the same period.


About the Author: Nimesh Jaiswal

Nimesh Jaiswal’s fervent interest in analyzing and interpreting financial data led him to a career as a financial analyst and journalist. The importance of financial statements in driving a stock’s price is the key approach that he follows while advising investors in his articles.

More…

The post 2 FAANG Stocks Wall Street Predicts Will Rebound by More Than 33% appeared first on StockNews.com

https://www.entrepreneur.com/article/422540


Cryptocurrencies in 2022: An Interview with Tim Seymour and Meltem Demirors

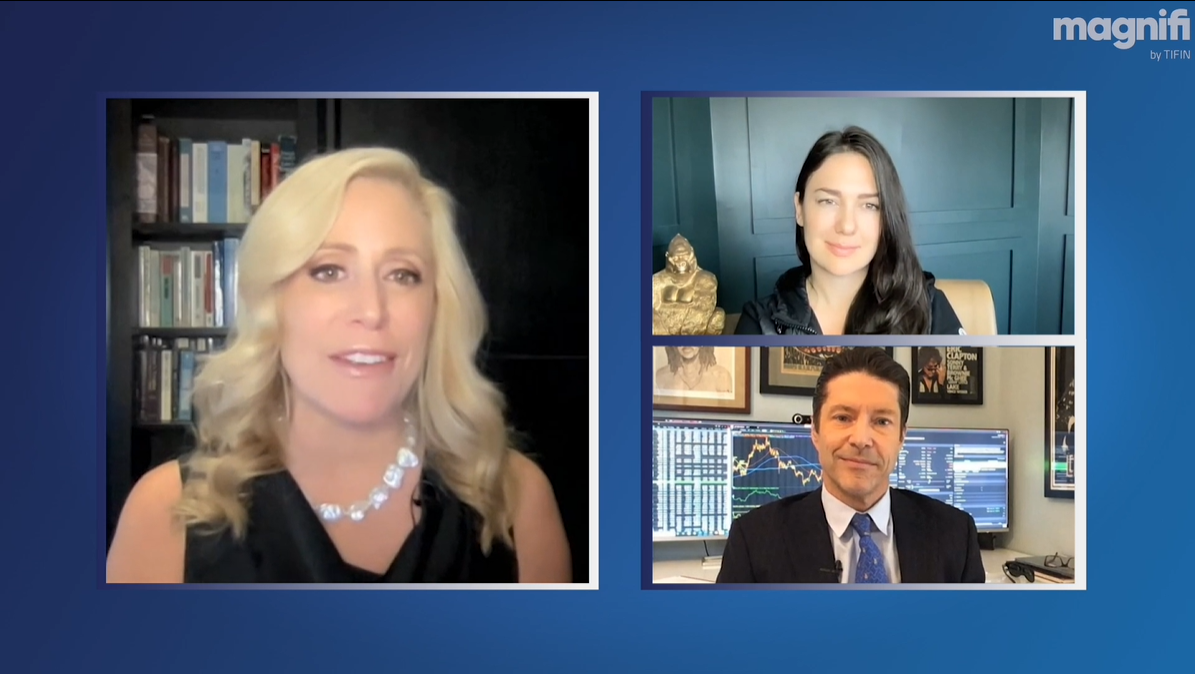
Tim Seymour, founder and Chief Investment Officer of Seymour Asset Management, and Meltem Demirors, Chief Strategy Officer of CoinShares, join Melissa Francis in a discussion about cryptocurrencies.

shutterstock.com – StockNews

Seymour Asset Management CIO Tim Seymour and CoinShares CSO Meltem Demirors join host Melissa Francis, former CNBC, MSNBC, Fox Business, and FOX News anchor, to delve into the nuances of the digital currency market. 

To watch the full interview with Tim and Meltem, in addition to interviews with Jeffrey Gundlach, Kyle Bass and Anthony Scaramucci, check out Magnifi by TIFIN.

Melissa Francis: Welcome back to Magnifi by TIFIN. Today, we are talking crypto and the best way to incorporate it into a portfolio. Tim Seymour is CIO of Seymour Asset Management, and Meltem Demirors as chief strategy officer at CoinShares. Welcome to both of you.

Tim Seymour: Thanks Melissa.

Melissa Francis: You guys have both been pioneers in crypto. But before we get to that event, I want to get your reaction to what you heard Anthony Scaramucci say. Well, let’s start with crypto. I mean, he says he thinks it’s going to get to 100,000 in the next two years. What do you think about that?

Tim Seymour: Meltem, do you want to jump in? I’ll jump in. Yeah, I think we’ve seen a ton of volatility in crypto and Bitcoin markets in the last, probably five years. So the question of calling where 100,000 is the mark, I think the more important dynamic is that prices are moving higher and that the drawdowns of 20% to 40% seem to be somewhat garden variety. I think we’re going to get into this conversation, the fundamentals for owning Bitcoin.

Something I also heard Anthony talking about is the regulatory environment around Bitcoin is something that’s actually a friend to the pricing, and despite the decentralized nation and some of the ethos and the existential reasons for wanting to own Bitcoin, and I get it. Defi to the moon, but Bitcoin’s going higher.

Melissa Francis: Okay. So I didn’t understand the regulatory part of that. You think the regulatory part is going to get worse or better?

Watch the full interview with Tim and Meltem HERE

Tim Seymour: I think regulation is a tailwind. I think it gets better and I think more regulation means more adoption. Look, we know the institutional capital that’s been following it, and that’s certainly the pool of capital that I feel like I’m close to and I sit in the middle of. As far as I know, institutional money managers, they want the ability to invest, they want the ability to not have to CYA in terms of what their compliance teams and what the regulators have done yet to give it a green light. I think there’s a lot of money. I think there is a wall of capital on the sidelines.

Melissa Francis:Meltem, what do you think?

Meltem Demirors: Yeah, so I’ll go with Howard Marks’ advice here. He always says, “You can name a date, but not a price, or you can name a price, but not a date.” I certainly think what I’ve experienced over the last eight years as an investor in this industry is the lows are higher and the highs are higher.

I think if we zoom out and look at Bitcoin in particular, and we look at it over 10 year cycles, what we see here is a market that is very cyclical in nature. In Bitcoin, we go through about these four year cycles that correspond with Bitcoins having, or having in its inflation rate, it’s supply schedule. What’s really important to note is 85% of all Bitcoin that will ever exist have already been mined. The demand for Bitcoin continues to increase if we look at daily trading volumes, if we look at the demand coming from the structured exchange through to product side, which is the business we’re in at CoinShares.

What’s been interesting to note is, again, if we look at investment trends, it’s important to not focus on cycles, right? It’s important to focus on secular trends. If we look at the secular trend, if we look at what’s happening with the digitization in financial services more broadly, if we look at how distribution patterns are changing, what we see it’s no longer just financial institutions who are distributing investment products or financial products to end clients. It’s social media platforms, it’s apps, social trading platforms. So I certainly think, we believe in a future at CoinShares where every company in the world will be a financial services company. The future of financial services looks very different going forward than it did in the past.

The investment tastes of my generation, millennials, are changing and they’re very different, not of their parents. We’re in the midst of the largest wealth generational transfer in history, right? There’s 56 trillion in wealth that will transfer hands over the next 10 years. People want to invest differently.

Watch the full interview with Tim and Meltem HERE

What’s really unique about Bitcoin is Bitcoin is imbued with very specific social and political values, which is quite interesting. We have seen a shift with investors wanting to deploy their capital into things that align with their values.

We see this with the rise of ESG investing, we see this with the rise of investments in tech companies, some of which, like Tesla and others, resemble religions more than they do companies, quite frankly.

Melissa Francis: Or cults.

Meltem Demirors: Yeah. You know what? Cult, religion, I don’t differentiate. It’s all good for us.

Melissa Francis: Oh boy, yeah. So let me, let me stop you for one second there because I want to ask both of you guys if you are a modest investor or you’re someone who’s pitching to a modest investor, in one minute, how do you explain the value of investing in Bitcoin? Why must you do it? Tim, you go first.

Tim Seymour: Well, I’ll just point out that part of the rationale and the raise on debts for Bitcoin is ineffectual central banks around the world. So whether an outright inflation hedge, or again, think of the unfortunate global scenarios, that scenario that’s playing out in Russia, Ukraine. Think about the fact that, probably appropriately, the US, the UK, the EU said they’re going to freeze $300 billion of central bank reserves for Russia.

Look, that’s what should happen in what’s going on with this crisis. I get that. But if I’m another country around the world, then I see the autocracy, the ability of the reserve currency central bank in the United States or the EU, or the Bank of England. Look, that concerns me. And by the way, that’s all very dollar negative in the longer term. We can get into macro and what’s how we’re going to finance the US deficit, but I think this is all an argument for Bitcoin. I think it’s all an argument for why the investment thesis here continues on.

Melissa Francis: So Meltem, it’s basically that central banks and governments around the world are run by propellerheads, as Anthony Scaramucci would say. What’s your one minute argument?

Meltem Demirors: Yeah. It’s actually 10 seconds. Bitcoin is an antidote to chaos and institutional incompetence that you can own in your portfolio. That’s it.

Watch the full interview with Tim and Meltem HERE

Melissa Francis: Wow. That was a good one.

Tim Seymour: What’s a propellerhead, Melissa?

Melissa Francis: I mean, I don’t know. I’m going to have to go back and ask Anthony. It’s something that he’s not, apparently.

Tim Seymour: Of course, of course.

Meltem Demirors: I’m picturing people with the little hats. With the little hat with the thing on top. I don’t even know. Is that what that is?

Melissa Francis: Yeah, so he’s dating himself. He’s dating himself.

Tim Seymour: I don’t think he’d put anything on his head that would mess up his hair. I might not either, for that matter.

Melissa Francis: Great, great point. All right, Meltem, let me ask you. So CoinShares does both passive and active crypto investing. What’s the difference? What makes the most sense for whom?

Meltem Demirors: Yeah, absolutely. So there are very different styles of investing. Passive investing is all about providing exposure to the market beta of crypto and crypto assets. So what that means is investors may, for example, just want exposure to the change in price of Bitcoin. So our Bitcoin ETP is a perfect product for them. It’s a product you can buy through your existing brokerage account. You stick it in your portfolio, you don’t need to do anything differently, you don’t need to open an account on a crypto exchange, you don’t need to get a wallet. You don’t need to do anything. All you do is enter a ticker and all of a sudden you have exposure to Bitcoin’s market beta in your portfolio. So that is a passive product.

There are also indices that we build that are passive in nature, whereas active means that we’re actively changing the composition of the portfolio to reflect changing trends in the market. On the active side, we’ve seen a lot of demand, not only for baskets of crypto assets themselves, but also for baskets of companies in the equity space that derive their value from crypto activities. We have a crypto economy, ETF effectively, that tracks blockchain equities. Today there’s over $100 billion in market cap and publicly traded crypto companies.

We’re one of those. We’re publicly listed, but there’s Coinbase and a number of others.

Watch the full interview with Tim and Meltem HERE

Then the other trend that’s been really exciting on the active side is new opportunities to generate yield. So this is more appealing to debt investors using these new debt markets in the decentralized finance, or defi space.

And then obviously the sexiest thing ever, seeing an absolute explosion of capital inflows, venture capital. Everyone wants to be in early stage tech. It’s where the returns are. So there’s venture capital early stage investing in both digital assets or tokens themselves, as well as companies that are building the infrastructure, the picks and shuttles of this space.

Melissa Francis: Tim, don’t worry about hurting her feelings. She can’t hear you. What did you think of those ideas?

Tim Seymour: I said, “Wow,” when I heard sexy. Look, we’re all here on Magnifi TV and trying to have an interesting afternoon. Look, what I heard her saying about investing in an emerging asset class is really smart. I’m someone that’s been investing in emerging asset classes for most of my career. I was an EM investor, I ran a long short EM fund. I lived in Russia at one point. Now I’ve spent a lot of time. I’m an investor in cannabis.

What I see in new asset classes is that, first of all, active management is highly effective. These are still inefficient markets. Let the professionals do the active managing and let them manage it for you. I think there’s a case to be made here that this market will continue to become more efficient. I do think that there’s a dematic approach you want to take to investing in crypto, and therefore passivity is part of where you really want to be because I think the market will evolve with you.

But this combination of being a passive investor but being tactically active, I think makes a ton of sense here. I think investors have seen where Bitcoin started out to be really the only way to play. If we were having this conversation only three years ago, that probably would’ve been the extent of the conversation. Obviously people know all about Ethereum. I think all those folks watching Magnifi TV, I worry about all the NFT deals you’re seeing. I think you should be better off investing in Ethereum or Solana or proxy plays or something similar because that’s the part of what we’re talking about today that I also think we could wave a caution flag around.

Melissa Francis: Yeah. Meltem, I mean, as long as we’re talking about calculus, what do you think is the better play right now? Is it owning the asset or do you want to go with one of the derivative plays, and what would that be?

Watch the full interview with Tim and Meltem HERE

Meltem Demirors: I think that’s so dependent on your risk appetite as an investor and how much time you want to spend on this. I think the challenge today is owning a passive basket of assets or owning exposure through structured products is a great approach for a family office, an investor, who doesn’t want to change their operational infrastructure, their processes and create new accounts, manage assets in new ways. There is a bit of a learning curve when it comes to active management in this space. You do want to have someone who’s experienced in this, who understands the landscape.

As Tim alluded to, anytime there’s new technology, there’s high utopianism, which we have an abundance of in the crypto space. But there’s also high grift. There’s a lot out there that really has very little merit, that is really about optimizing for outcomes for the founders of these projects. These projects don’t have longevity. And so an active manager can help you avoid those pitfalls.

But it’s important just to be very cognizant of your investing style, your own appetite for risk, your own appetite for volatility. There’s some investors we work with who are very uncomfortable with volatility. So perhaps for them, having exposure to the venture category where they’re locked up for five to seven years, where they’re not subject to this constant market is a better exposure strategy. Some people are very uncomfortable with their reputational risk associated with some of these potential situations where we do have this grift. And perhaps for them, owning a basket of well-established widely traded currencies within a structured product wrapper issued by a reputable regulated financial institution is a better way to go.

So it really is a productive question. There’s no prescriptive, one size fits all formula. It’s really, I think, a product of how you operate, what your comfort level is with engaging with this new asset class and all of its different channels through which you can get exposure.

And then lastly, just really thinking about what you, either individually or as an organization, have the capacity to actually do on a day to day, month to month, year to year basis.

Melissa Francis: No, that’s a great point. Tim, kind of along those lines, where are you seeing value right now that’s not crypto?

Watch the full interview with Tim and Meltem HERE

Tim Seymour: Interesting. Well, first of all, I think one of the rallying points around crypto and what we talked about with the ethos of a world war, central banks may have lost control. There is chaos as Meltem pointed out. I think hard assets are clearly a place where people want to be. As someone that’s invested, again, in different cycles of the commodities world, this is clearly a place where I think we are seeing hard assets, but resources and that trade, it continues to be a place that’s very interesting.

This isn’t too us about supply disruption from Eastern Europe, and everyone’s heard the math, the numbers around… Ukraine is basically the fourth largest net commodity exporter. This is a case where think of the structural under investment that has gone into copper mines and gold mines and iron ore mines, and frankly, the villainization of certain parts of the commodity chain over the few years by multiple administrations. I think you’ve left us with a place globally where commodities, and again, if you’ve traded commodities, these are long tail cycles. Well, guess what? The last commodity cycle started in 2002 and actually went through the crisis of 2008 and actually caught some fresh life through 2011 or 12. But ultimately it really died there and left a lot of investors holding the bag.

Remember, again, a lot of these companies were run for bond holders, for the owners of the companies themselves, not for equity shareholders. What you’re seeing in equities, especially in the energy sector, and I think in the resource sector now, is these are companies that are actually run for equity investors because they have to be because we’re not falling for the drill to infinity anymore and that growth with a balance sheet that doesn’t make sense is something that works.

So again, I like PGMs here. I think gold is going higher. I think people have been shocked that gold hasn’t done more here. Look at the three year chart on gold. It’s also been volatile. But gold is a store of value. Gold is the ultimate inflation hedge. And yes, I believe inflation is going to be higher for longer and we could have that whole discussion. But no, it’s not transitory services inflation, which is ultimately a great thing when you think about the labor force and where lower to middle class folks are finally getting a living wage. Well, there’s a major delay in what that means in terms of the inflationary impact of that. This is perfect for gold. And I think gold is where central banks are diversifying. I think they are diversifying in Bitcoin and other crypto. I think that’s something that we need to think about.

Melissa Francis: All right. All right, real quick I want to get some predictions from you guys about year end. You can pick a commodity or if you want to do crypto, just give me a good prediction. Meltem, what do you think?

Meltem Demirors: Yeah, I have three sectors I’m looking at. The future of the digital world, which we are on screens from the moment we wake up to the moment we go to bed and in our sleep we’re being tracked by digital devices, it’s about three material inputs. Number one is… CLICK HERE to watch the rest of this interview at Magnifi by TIFIN


GBTC shares were trading at $25.83 per share on Monday morning, up $0.32 (+1.25%). Year-to-date, GBTC has declined -24.58%, versus a -10.73% rise in the benchmark S&P 500 index during the same period.


About the Author: StockNews Staff

The StockNews Staff is led by a team of investment experts including CEO, Steve Reitmeister and trading legend Adam Mesh. The goal of our commentary is to provide you with valuable insights to make more successful investment decisions.

More…

The post Cryptocurrencies in 2022: An Interview with Tim Seymour and Meltem Demirors appeared first on StockNews.com

https://www.entrepreneur.com/article/422204


Rivian vs. NIO: Which Electric Vehicle Stock is a Better Buy?

In this article I’ll analyze and compare Rivian Automotive (RIVN) and NIO (NIO) to determine which electric vehicle manufacturer is currently a better buy.

shutterstock.com – StockNews

With more than 6.6 million EVs being sold worldwide in 2021, the electric vehicle (EV) industry is expanding rapidly. This figure indicates over a 100% increase compared to 2020. Besides, EV market share surged from 4.11% in 2020 to 8.57% in 2021, confirming current trends toward EV adoption. 

The demand for low emission vehicles should accelerate in the forthcoming years, thus enabling the global EV market to grow at a CAGR of 22.6% to $802.81 billion by 2027. 

In today’s article, I intend to analyze and compare two EV stocks: Rivian Automotive, Inc. (RIVN) and NIO Inc. (NIO), to determine which one is currently the better investment.

Founded in 2009, Rivian develops and manufactures electric pickup trucks and sports utility vehicles. RIVN became public through a traditional IPO on November 10th, 2021, by selling 153 million shares at $78.00 a share. NIO Inc. is a Shanghai-based company that develops, manufactures, and sells electric vehicles (EVs) in China, targeting the luxury electric SUVs segment. The company also offers a state-of-the-art subscription-based model for its batteries. 

Year-To-Date (YTD), shares of Rivian Automotive dropped about 60%, and NIO stock lost around 44% over the same period.  

Recent Developments 

On March 1st, NIO reported delivery numbers for February. Despite the global supply chain disruptions, the company delivered 6,131 EVs in February, which is a 9.9% year-over-year increase. However, this figure is down 36% on a month-over-month basis. The shipments consisted of 1,084 ES8s, 3,309 ES6s, and 1,738 EC6s. It is also important to note that total deliveries hit 15,783 vehicles in 2022, up 23.3% year-over-year. 

On March 2nd, Rivian announced a 20% price increase on its flagship quad-motor models amid inflationary pressures and higher component costs. As a result, the price for quad-motor versions of its electric R1T pickup increased from $67,500 to $79,500, while the quad-motor R1S SUV base price increased from $70,000 to $84,500. The company’s stock price decreased by over 11% following the announcement. 

Recent Financial Performance & Analysts Estimates

Yesterday, on March 10th, Rivian’s shares dropped over 12% during the post-market trading session after the company had reported a lower than expected Q4 earnings report and weak 2022 production guidance. More precisely, the company’s fourth-quarter revenue stood at $54 million, driven by the delivery of 909 vehicles. However, RIVN failed to meet Wall Street revenue estimates, missing consensus by $6.72 million. Besides, RIVN disclosed a Non-GAAP EPS of ($4.83), missing Wall Street projections by $2.47. 

The company’s Adjusted EBITDA loss stood at $1.11 billion compared to $341 million in Q4 2020. Besides, Rivian guides 2022 Adjusted EBITDA to be $4.75 billion, which is an over 70% increase as compared to $2.79 billion in 2021. In addition, the company plans to produce 25,000 vehicles in 2022 amid supply chain challenges. 

For the current quarter, analysts project Rivian’s earnings to come in at ($1.20) per share. Its revenue for the first quarter of 2022 is expected to stand at $317.88 million.

NIO Inc. last issued its earnings results on Tuesday, November 9th. In the third quarter, the company’s total revenue increased 128% year-over-year to $1.52 billion, topping Wall Street’s revenue estimates by $50 million. Its vehicle sales came in at $1.34 billion, representing a 100.2% year-over-year increase. The company’s net loss has been reported at $569.7 million in Q3, down 42.9% compared to the year-ago figure. Consequently, NIO’s Non-GAAP EPS stood at ($0.06), beating analysts’ consensus by $0.04.

Besides, the company intends to recognize fourth-quarter revenue in the range between $1.46 billion and $1.57 billion. A ($0.16) consensus EPS estimate for the fourth quarter, ending December 31st, 2021, represents a moderate 0.74% decrease year-over-year. At the same time, its revenue for Q4 is expected to increase 50.20% year-over-year to $1.54 billion.

Comparing Options Market Sentiment

Looking at the June 17th, 2022 option chain for both RIVN and NIO, we can determine options market sentiment by comparing the calls/puts ratio. In RIVN’s case, the open calls/open puts ratio at the $45.00 strike price comes in at 0.17x, implying a strong bearish options market sentiment. When it comes to NIO, the open calls/open puts ratio at the $22.50 strike price stands at 1.19x, showing a bullish market sentiment.  

The Bottom Line 

I think NIO is currently a better long-term buy. Despite ongoing supply chain challenges, the company’s shipment figures for February and YTD look solid. Furthermore, NIO financials and forward growth potential look more persuasive. Finally, NIO has substantially better options market sentiment at the moment.


RIVN shares were trading at $38.09 per share on Friday morning, down $3.07 (-7.46%). Year-to-date, RIVN has declined -63.27%, versus a -10.34% rise in the benchmark S&P 500 index during the same period.


About the Author: Oleksandr Pylypenko

Oleksandr Pylypenko has more than 5 years of experience as an investment analyst and financial journalist. He has previously been a contributing writer for Seeking Alpha, Talks Market, and Market Realist.

More…

The post Rivian vs. NIO: Which Electric Vehicle Stock is a Better Buy? appeared first on StockNews.com

https://www.entrepreneur.com/article/422066


Wall Street is Bullish on These 2 Crypto Stocks: CleanSpark and Riot Blockchain

Cryptocurrencies have experienced tremendous volatility since the beginning of the year, dragging crypto-related stocks down in price. However, President Biden’s executive order this week to examine the risks and scope of cryptocurrencies could renew investors’ attention on crypto-related stocks. Wall Street analysts are bullish on Riot Blockchain (RIOT) and CleanSpark (CLSK). So, these stocks could be good additions to one’s watchlist. Let’s discuss.

shutterstock.com – StockNews

Cryptocurrencies have been exhibiting significant volatility since the beginning of the year. The Fed’s forthcoming interest rate increases, and multi-year-high inflation are the primary reasons behind this volatility. Furthermore, the Russia-Ukraine war has also fostered volatility in cryptocurrencies. This, along with the stock market sell-offs, has led to many crypto-related stocks suffering a downtrend.

Last year was a breakout year for cryptocurrencies, which experienced significant volatility and delivered strong returns. Popular cryptocurrencies, such as Bitcoin (BTC) and Ethereum (ETH), steered several investors to massive profits. Due to the growing popularity and acceptability of cryptocurrencies, President Biden this week signed an executive order to examine the risks and benefits of cryptocurrencies. The order has called on Federal agencies to take a unified approach in regulating and overseeing digital assets.

While the near-term prospects for digital currencies look uncertain, the executive order could renew investors’ attention on crypto stocks. Indeed, Wall Street analysts are bullish on crypto stocks Riot Blockchain, Inc. (RIOT) and CleanSpark, Inc. (CLSK). So, it could be wise to add these stocks to one’s watchlist.

Riot Blockchain, Inc. (RIOT)

RIOT is involved in cryptocurrency mining and the overall blockchain system through various investments. The Castle Rock, Colo.-based company has deployed approximately 8,000 application-specific integrated circuit miners at its cryptocurrency mining facility in Oklahoma. In addition, its subsidiary Tess Inc. seeks to develop a blockchain-based escrow service for wholesale telecom carriers.

On Dec. 1, 2021, RIOT announced that it had acquired Ferrie Franzmann Industries, LLC (ESS Metron) for roughly $50 million. ESS Metron designs and produces highly engineered electrical equipment solutions that are highly useful for deploying bitcoin mining operations at scale. This acquisition is vital for RIOT because it will likely complement its ongoing infrastructure expansion to 700 MW and significantly improve its internal engineering capabilities.

RIOT’s total revenue for its fiscal third quarter, ended Sept.30, 2021, increased 2,532.3% year-over-year to $64.80 million. The company’s mining revenue grew 2,099% year-over-year to $53.60 million. In addition, its adjusted EBITDA came in at $37.57 million compared to a $0.40 million loss in the year-ago period.

Analysts expect RIOT’s EPS and revenue for its fiscal year 2021 to increase 233.3% and 1,644.5%, respectively, year-over-year to $0.40 and $210.75 million. The stock surpassed the Street’s EPS estimates in three of the trailing four quarters. And over the past year, the stock has declined 70.7% in price to close the last trading session at $16.51. However, Wall Street analysts expect the stock to hit $44.75 in the near term, indicating a potential 171% upside.

CleanSpark, Inc. (CLSK)

CLSK in Woods Cross, Utah, provides bitcoin mining and energy technology solutions worldwide. The company provides software and technology solutions that are focused on solving modern energy challenges. It operates in the Digital Currency Mining and Energy segments. The Digital Currency Mining segment mines for bitcoin, while the Energy segment provides engineering, design and software, custom hardware, and other solutions for microgrids and distributed energy systems to military, commercial, and residential customers.

On Oct. 12, 2021, CLSK announced the purchase of 4,500 units of Antminer S19 bitcoin mining machine, partially funded through its bitcoin holdings. According to CLSK, its sustainable bitcoin mining capacity will increase by a computing power of 450 PH/S, equivalent to its current capacity, after the new machines are operational. New mining machines should help the company increase its revenues. CEO of CLSK Zach Bradford said, “By making a conscious effort to reinvest in additional production, we are taking a market-based approach to our mining operations and maximizing value for our shareholders.”

For its fiscal first quarter, ended Dec. 31, 2021, CLSK’s revenues increased 1,726.8% year-over-year to $41.24 million. The company’s adjusted EBITDA came in at $24.10 million, compared to a $2.74 million adjusted EBITDA loss in the year-ago period. Also, its net income came in at $14.48 million, compared to a $7.16 million net loss in the year-ago period.

For its fiscal year 2022, CLSK’s EPS and revenue are expected to increase 277.3% and 269.5%, respectively, year-over-year to $1.33 and $182.65 million. And over the past year, the stock has gained 58.8% in price to close the last trading session at $11.09. However, Wall Street analysts expect the stock to hit $23 in the near term, indicating a potential 107.4% upside.


RIOT shares were trading at $15.87 per share on Friday morning, down $0.64 (-3.88%). Year-to-date, RIOT has declined -28.93%, versus a -10.34% rise in the benchmark S&P 500 index during the same period.


About the Author: Dipanjan Banchur

Since he was in grade school, Dipanjan was interested in the stock market. This led to him obtaining a master’s degree in Finance and Accounting. Currently, as an investment analyst and financial journalist, Dipanjan has a strong interest in reading and analyzing emerging trends in financial markets.

More…

The post Wall Street is Bullish on These 2 Crypto Stocks: CleanSpark and Riot Blockchain appeared first on StockNews.com

https://www.entrepreneur.com/article/422065


Should You Buy the Dip in Healthcare Trust of America?

Shares of medical REIT Healthcare Trust of America (HTA) slumped in price after the company’s reverse merger with Healthcare Realty Trust. And as the company’s profit margins take a hit due to increased operating costs derived from several macroeconomic headwinds, is HTA an ideal investment bet now? Read more to learn our view.

shutterstock.com – StockNews

Healthcare Trust of America, Inc. (HTA) is the largest dedicated owner and operator of medical office buildings in the U.S. As of September 30, 2021, HTA’s assets comprised approximately 25.80 million square feet of gross leasable area (GLA) and $7.70 billion worth investments in medical office buildings. The Scottsdale, Ariz.-based company has an ISS Governance QualityScore of 1, indicating low governance risk.

On February 18, HTA announced plans to merge with Healthcare Realty Trust Incorporated. Following the merger, HTA shareholders are set to receive a total implied value of $35.08 per share, including a special dividend of $4.82 per share. The newly merged company has a pro forma equity market cap of $11.60 billion and an EV of $17.60 billion.

However, shares of HTA declined 1.6% in price following the announcement of the merger. This is because HTA shareholders are slated to receive only the special dividend payout, because the business combination is structured as a reverse merger, with HTA buying Healthcare Realty Trust’s shares. Also, the stock has declined 9.7% in price year-to-date.

Here is what could shape HTA’s performance in the near term:

Mixed Financials

HTA’s revenues have increased 4.6% year-over-year to $195.70 million in its fiscal fourth quarter, ended Dec. 31, 2021. This can be attributed to a 3.6% rise in rental income and a 2211.1% improvement in interest and other operating income. The company’s quarterly dividend payout increased by $0.05 to $0.325 in the last quarter.

However, the company’s net income has declined 41.7% from the same period last year to $16.61 million due to a 10.4% rise in total expenses. Its FFO came in at $0.07, down 46.2% from the prior-year quarter. Furthermore, HTA’s net operating cash flow declined marginally year-over-year to $385.62 million.

Stable Growth

Analysts expect HTA’s revenues to rise 2.8% in its fiscal year 2022 first quarter (ending March), 5.2% in the second quarter (ending June 2022), and 5% in the current year. The consensus FFO estimates indicate a 3.2% year-over-year improvement in the current quarter, a 3.9% rise in the next quarter, and a 3.4% increase in fiscal 2022. In addition, the Street expects the company’s revenue and FFO to increase 6.9% and 3.7%, respectively, next year.

Stretched Valuation

In terms of forward P/AFFO, HTA is currently trading at 20.41x, which is 7.4% higher than the 19x industry average. Its 16.91 forward P/FFO multiple is slightly higher than the 2.30 industry average.

In addition, the stock’s trailing-12-month Price/Rental revenue and Price/Cash Flow ratios of 9.18 and 18.18, respectively, compare with the 8.62 and 17.27 industry averages. Furthermore, HTA’s 22.84 trailing-12-month EV/EBITDA multiple is 3.7% higher than the 22.04 industry average.

Consensus Rating and Price Target Indicate Potential Upside

Among the six Wall Street analysts that rated HTA, one rated it Buy while four rated it Hold. The 12-month median price target of $34.20 indicates an 11.7% potential upside from yesterday’s closing price of $30.61. The price targets range from a low of $30.00 to a high of $38.00.

POWR Ratings Reflect Uncertainty

HTA has an overall C rating, which translates to Neutral in our proprietary POWR Ratings system. The POWR Ratings are calculated by considering 118 distinct factors, with each factor weighted to an optimal degree.

HTA has a B grade for Growth but a D for Value and Quality. The company’s revenues have increased at a 3.3% CAGR over the past three years and at a 10.8% CAGR over the past five years, which is in sync with its Growth grade. However, the stock’s premium valuation justifies the Value grade. In addition, HTA’s 3.05% trailing-12-month ROE is 40.5% lower than the 5.12% industry average, and in sync with the Quality grade.

Among the 17 stocks in the D-rated REITs – Healthcare industry, HTA is ranked #13.

Beyond what I have stated above, view HTA ratings for Sentiment, Stability, and Momentum here.

Bottom Line

HTA’s recent merger is expected to significantly boost the company’s domestic market presence. However, with declining profit margins and operating cash flows, the fund outflow resulting from this merger could harm the company’s working capital fund availability in the near term. Furthermore, we think that as the broader market weakness continues, investors should wait until the REIT giant’s cash flows stabilize before investing in the stock.

How Does Healthcare Trust of America (HTA) Stack Up Against its Peers?

While HTA has a C rating in our proprietary rating system, one might want to consider looking at its industry peers, Universal Health Realty Income Trust (UHT) and NorthWest Healthcare Properties Real Estate Investment Trust (NWHUF), which have a B (Buy) rating.


HTA shares were trading at $30.57 per share on Friday morning, down $0.04 (-0.13%). Year-to-date, HTA has declined -7.55%, versus a -9.91% rise in the benchmark S&P 500 index during the same period.


About the Author: Aditi Ganguly

Aditi is an experienced content developer and financial writer who is passionate about helping investors understand the do’s and don’ts of investing. She has a keen interest in the stock market and has a fundamental approach when analyzing equities.

More…

The post Should You Buy the Dip in Healthcare Trust of America? appeared first on StockNews.com

https://www.entrepreneur.com/article/422064