Comcast vs. DISH Network: Which Stock is a Better Buy?

With more people choosing to cut the cord, cable and satellite TV stocks like Comcast (CMCSA) or Dish TV (DISH) may not be as risk-proof as previously believed. But which of these two stocks is a better buy now? Read more to find out.

shutterstock.com – StockNews

Comcast Corporation (CMCSA) operates as a media and technology company worldwide. It operates through Cable Communications, Media, Studios, Theme Parks, and Sky segments. On the other hand, DISH Network Corporation (DISH) provides pay-TV services in the United States. The company operates in two segments, Pay-TV and Wireless. It offers video services under the DISH TV brand.

The entertainment providers are in high demand due to the rising trend of watching videos and series online and increasing disposable income. Moreover, the advancements in television technology and growing internet penetration across the globe are expected to drive the entertainment industry’s growth. According to a report by Market Reports World, the global entertainment and media market is expected to grow at a CAGR of 5.9% during 2022-2028. Therefore, both CMCSA and DISH should benefit.

DISH has gained 2.3% over the past three months versus CMCSA’s negative returns.

But which of these two stocks is a better buy now? Let’s find out.

Latest Developments

On January 27, 2022, CMCSA announced that it increased its dividend by $0.08 to $1.08 per share on an annualized basis, up 8% year-over-year. Following the increase, the Board of Directors declared a quarterly cash dividend of $0.27 a share on the company’s common stock, payable on April 27, 2022, to shareholders of record as of the close of business on April 6, 2022.

On February 23, 2022, DISH announced using the ServiceNow (NOW) Platform to standardize network and service operations on America’s first Smart Network. Jeff McSchooler, EVP, Wireless Network Operations, DISH, said, “Not only will this partnership streamline our network operations, but it also provides a long-term opportunity to help us deepen our services and offerings, delivering better network experiences over our SMART 5G™ Network.”

Recent Financial Results

CMCSA’s revenue increased 9.5% year-over-year to $30.34 billion for the fiscal fourth quarter ended December 31, 2021. The company’s adjusted net income grew 35.1% year-over-year to $3.53 billion. Also, its adjusted EPS came in at $0.77, up 37.5% year-over-year.

DISH’s revenues decreased 2.4% year-over-year to $4.45 billion for the fiscal fourth quarter ended December 31, 2021. The company’s net income declined 24.7% year-over-year to $552 million. Also, its EPS came in at $0.87, down 29.8% year-over-year.

Past and Expected Financial Performance

CMCSA’s revenue and EPS grew at CAGRs of 7.2% and 6.3%, respectively, over the past three years. Analysts expect CMCSA’s revenue to increase 14% for the quarter ending March 31, 2022, and 5.4% in fiscal 2022. The company’s EPS is expected to grow 5.3% for the quarter ending March 31, 2022, and 9.6% in fiscal 2022. Moreover, its EPS is expected to grow at a rate of 11.9% per annum over the next five years.

On the other hand, DISH’s revenue and EPS grew at CAGRs of 9.5% and 8.1%, respectively, over the past three years. The company’s revenue is expected to increase 0.3% for the quarter ending March 31, 2022, but decrease 4% in fiscal 2022. Its EPS is expected to decline 22.2% for the quarter ending March 31, 2022, and 26.1% in fiscal 2022. Also, DISH’s EPS is expected to decrease at a rate of 26.6% per annum over the next five years.

Profitability

CMCSA’s trailing-12-month revenue is 6.50 times what DISH generates. CMCSA is also more profitable with a gross profit margin and EBITDA margin of 66.96% and 29.75% compared to DISH’s 34.35% and 21.97%, respectively

Furthermore, CMCSA’s ROA and ROTC of 4.73% and 6.32% are higher than DISH’s 4.64% and 5.82%, respectively.

Valuation

In terms of forward non-GAAP P/E, CMCSA is currently trading at 13.13x, 24.7% higher than DISH’s 10.53x. However, DISH’s forward EV/EBITDA ratio of 10.12x is 20.3% higher than CMCSA’s 8.41x.

POWR Ratings

CMCSA has an overall rating of B, which equates to a Buy in our proprietary POWR Ratings system. On the other hand, DISH has an overall rating of D, which translates to a Sell. The POWR Ratings are calculated considering 118 different factors, with each factor weighted to an optimal degree.

CMCSA has a B grade for Stability, in sync with its beta of 0.92. In comparison, DISH has a C grade for Stability, consistent with its beta of 2.04.

Moreover, CMCSA has a grade of B for Quality. This is justified given CMCSA’s 66.96% trailing-12-month gross profit margin, 30.9% higher than the industry average of 51.16%. On the other hand, DISH has a Quality grade of D, in sync with its 34.35% trailing-12-month gross profit margin, 32.9% lower than the industry average of 51.16%.

Of the nine stocks in the Entertainment – TV & Internet Providers industry, CMCSA is ranked first. In comparison, DISH is ranked last.

Beyond what I’ve stated above, we have also rated the stocks for Growth, Value, Momentum, and Sentiment. Click here to view all the CMCSA Ratings. Also, get all the DISH ratings here.

The Winner

Since the entertainment industry is expected to grow exponentially, both CMCSA and DISH should benefit. However, it is better to bet on CMCSA now because of its robust financials, higher profit margin, and better growth prospects.

Our research shows that odds of success increase when one invests in stocks with an Overall Rating of Strong Buy or Buy. View all the other top-rated stocks in the Entertainment – TV & Internet Providers industry here.


CMCSA shares were trading at $46.63 per share on Wednesday afternoon, up $0.24 (+0.52%). Year-to-date, CMCSA has declined -6.89%, versus a -7.71% rise in the benchmark S&P 500 index during the same period.


About the Author: Nimesh Jaiswal

Nimesh Jaiswal’s fervent interest in analyzing and interpreting financial data led him to a career as a financial analyst and journalist. The importance of financial statements in driving a stock’s price is the key approach that he follows while advising investors in his articles.

More…

The post Comcast vs. DISH Network: Which Stock is a Better Buy? appeared first on StockNews.com

https://www.entrepreneur.com/article/421244
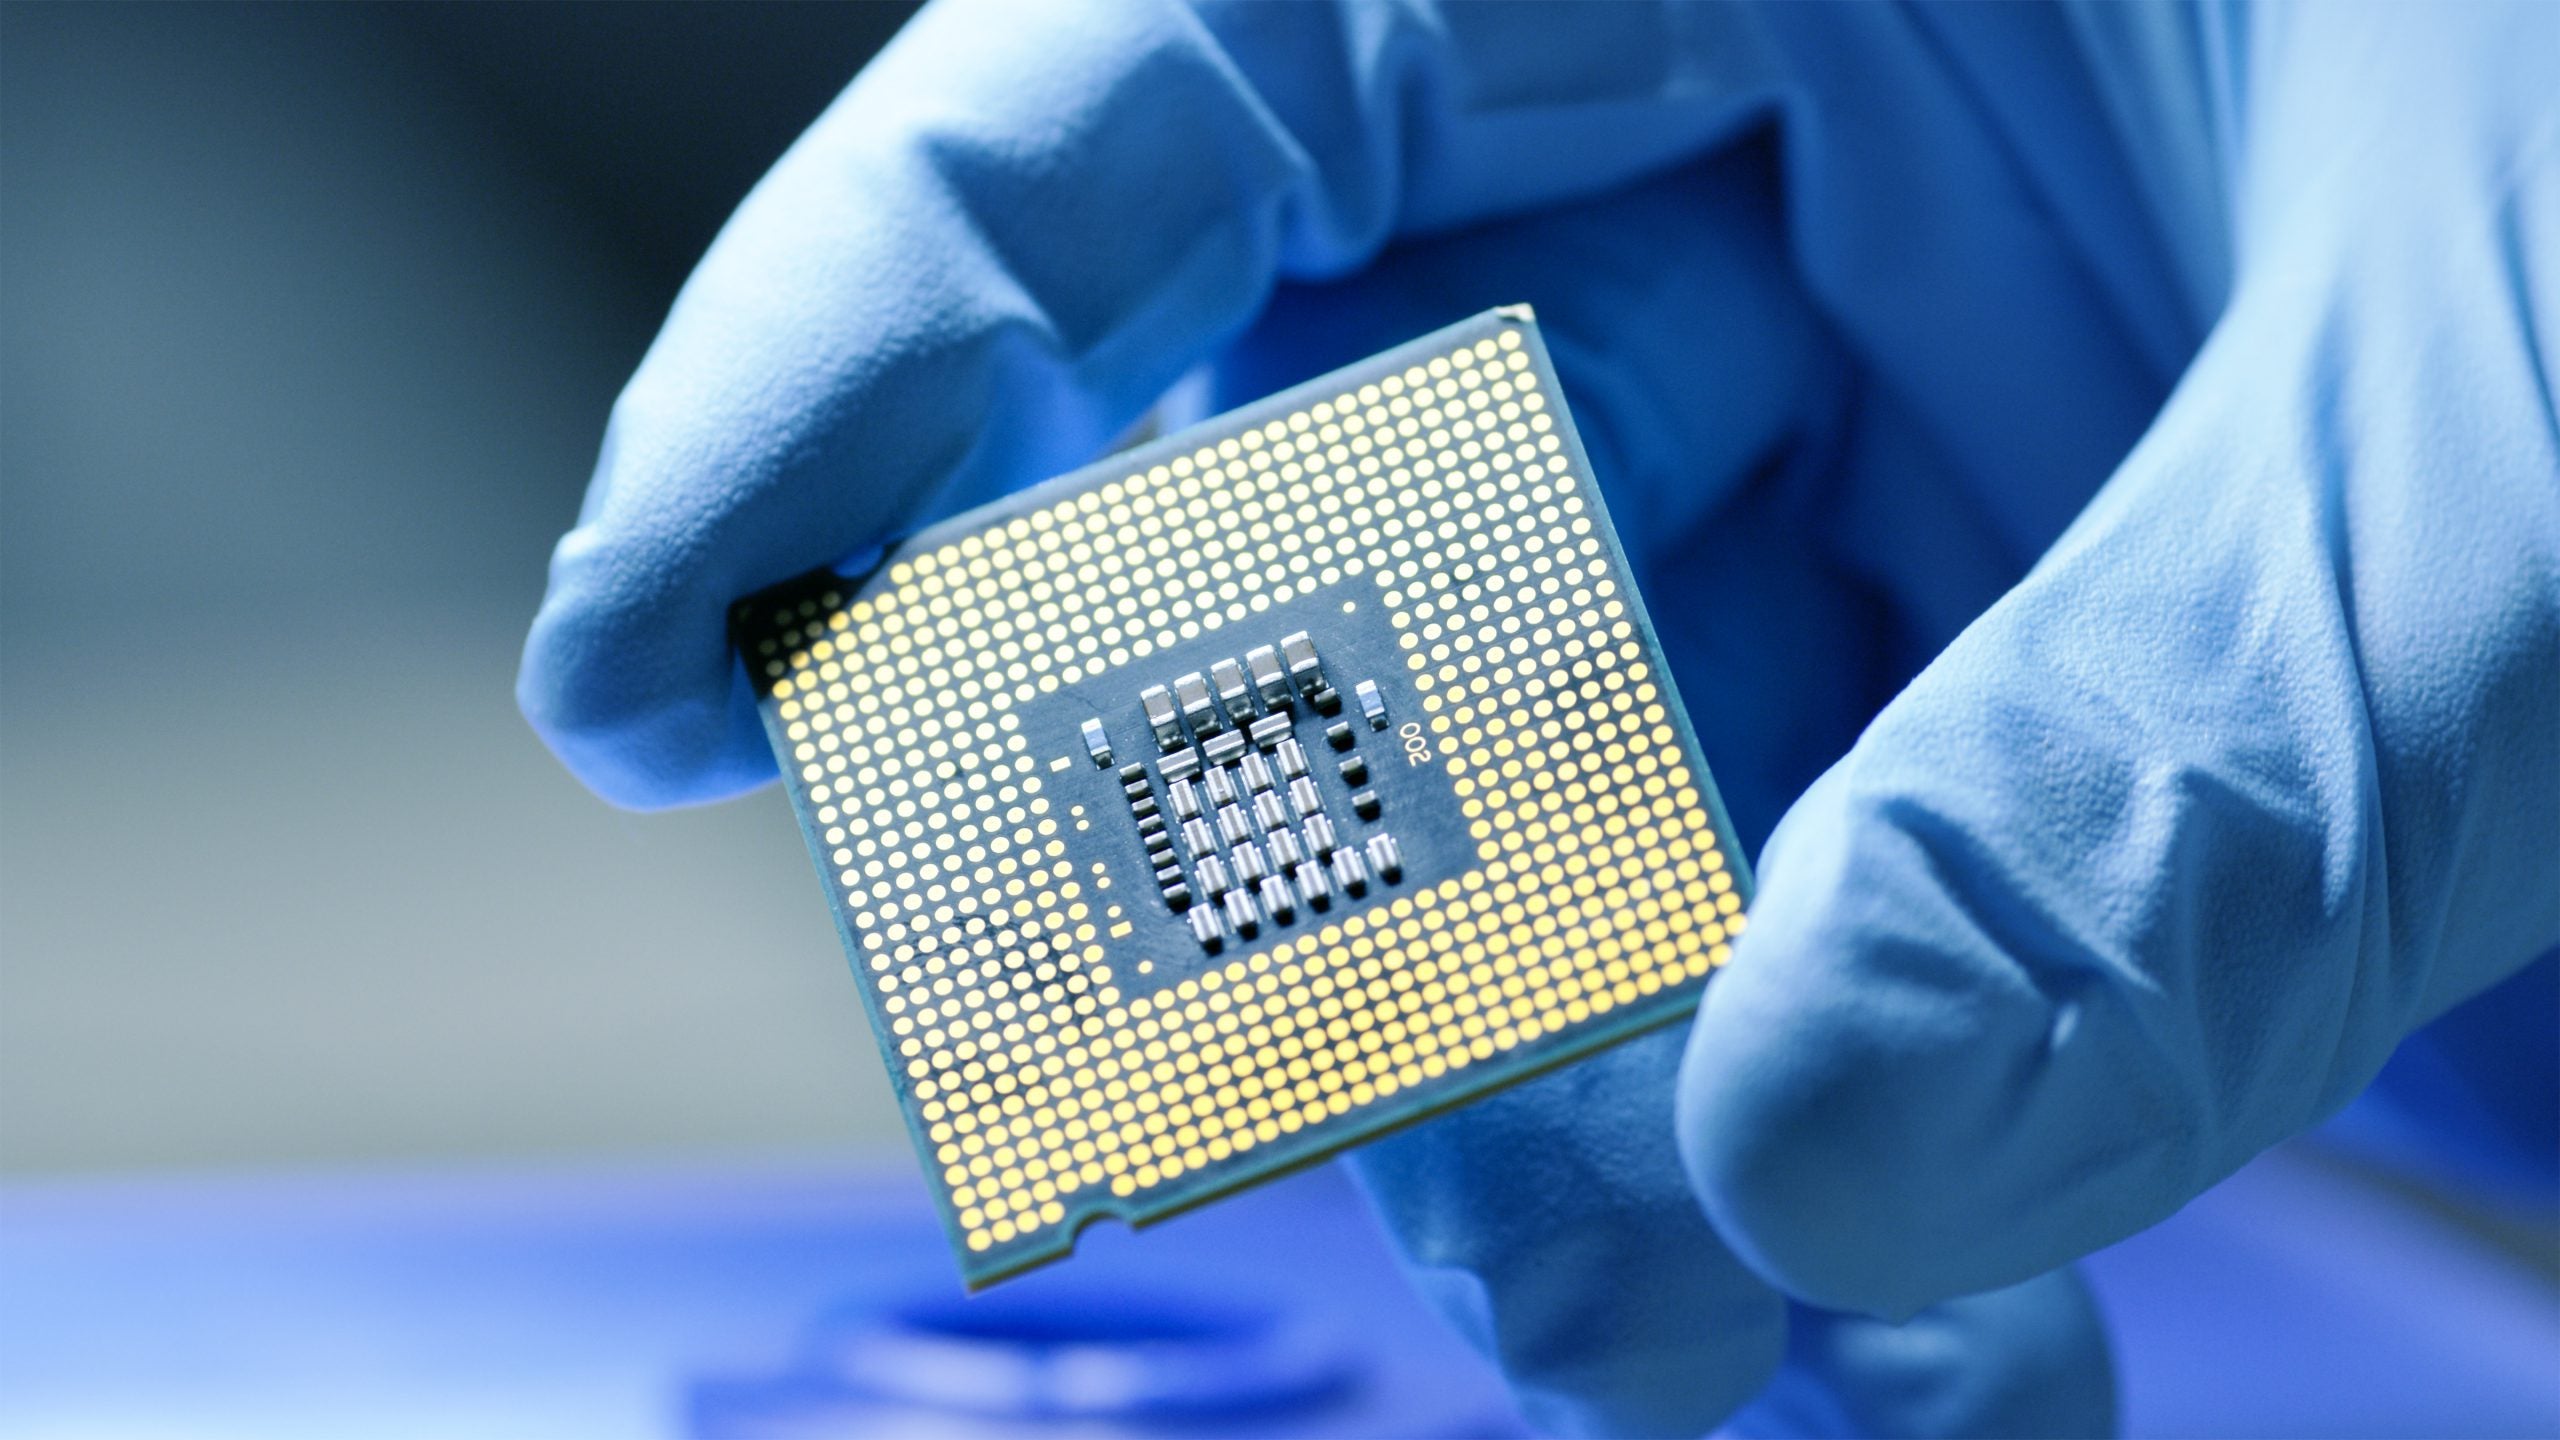


NVIDIA vs. Micron Technology: Which Chip Stock is a Better Buy?

The global semiconductor chip market has expanded considerably over the past year and is expected to continue growing, driven by robust demand across industries. So, well-known companies in this space, NVIDIA (NVDA) and Micron Technology (MU), should benefit from this tailwind. But, which of these stocks is a better buy now? Read more to learn our view.

shutterstock.com – StockNews

NVIDIA Corporation (NVDA) in Santa Clara, Calif., is a visual computing company that operates worldwide under Graphics and Compute & Networking segments. In comparison, Micron Technology, Inc. (MU) in Boise, Idaho, operates as a designer, manufacturer, and seller of storage products globally through its Compute and Networking Business Unit; Mobile Business Unit; Storage Business Unit; and Embedded Business Unit.

The Semiconductor Industry Association (SIA) announced that global semiconductor industry sales in 2021 totaled $555.90 billion, representing a 26.2% increase from the prior year. In 2021, the industry shipped a record 1.15 trillion semiconductor units as chip companies geared up production to address the global chip shortage.

However, Ukraine supplies more than 90% of United States semiconductor neon, used in lasers for chipmaking, and Russia is the source of 35% of its palladium. Hence, the ongoing conflict could create supply strains. However, due to raw material stockpiling and diversified procurement, disruptions are expected to be limited. Furthermore, semiconductor sales are expected to grow 11% in 2022 to a record $680.60 billion. So, both NVDA and MU are well-known players in the industry and are expected to gain substantially from the industry’s growth. NVDA shares have gained 77.8% in price over the past year, while MU has declined 2.9% over the same period. However, MU’s shares have gained 20.1% over the past six months, while NVDA’s shares gained 7.7%. Over the past month, NVDA has declined marginally, while MU has gained 8%.

Click here to checkout our Semiconductor Industry Report for 2022

But which stock is a better buy now? Let’s find out.

Latest Developments

On February 16, Jaguar Land Rover announced the formation of a multi-year strategic partnership with NVDA to jointly develop and deliver next-generation automated driving systems and AI-enabled services and experiences for its customers. NVDA might stand to benefit from this partnership.

On January 11, MU announced that it began volume shipments of its 176-layer QLC NAND SSD and unveiled its 2400 PCIe Gen4 Client SSD. These improvements are expected to usher QLC SSDs into the client PC market. This could prove to be profitable for the company.

Recent Financial Results

MU’s revenue increased 33.2% year-over-year to $7.69 billion in its fiscal first quarter, ended December 2. Its non-GAAP net income rose 175.5% from the prior-year quarter to $2.47 billion, while non-GAAP EPS improved 176.9% from the same period in the prior year to $2.16.

For its fiscal fourth quarter, ended January 30, NVDA’s revenue increased 52.8% year-over-year to $7.64 billion. Its non-GAAP net income and non-GAAP net income per share improved 71.2% and 69.2%, respectively, from the same period in the prior year to $3.35 billion and $1.32.

Past and Expected Financial Performance

MU’s revenue has grown at a 17.9% CAGR over the past five years. Its total assets have grown at an 11.2% CAGR over the past three years. Analysts expect MU’s EPS to increase 16.5% in the quarter ending May 2022, 49% for the fiscal year 2022, and 33.1% for the fiscal year 2023. The Street expects its revenue to rise 16.7% for its fiscal year 2022 and 20.8% for its fiscal year 2023. MU’s EPS is expected to grow 23.8% per annum over the next five years.

In comparison, NVDA’s revenue has grown at a 31.3% CAGR over the past five years, while its total assets have grown at a 49.3% CAGR over the past three years. The consensus EPS estimate for the quarter ending April 2022, its fiscal year 2023, and fiscal year 2024 indicates increases of 41.8%, 26.4%, and 19.8%, respectively. Analysts expect its revenue to rise 43.3%, 28.9%, and 17.3% respectively over the same periods. NVDA’s EPS is projected to grow 30.2% per annum over the next five years.

Profitability

NVDA is more profitable in terms of its gross profit margin and net income margin of 64.93% and 36.23%, respectively, compared to MU’s 41.53% and 24.86%.

Furthermore, NVDA’s ROE, ROA, and ROTC of 44.83%, 17.2%, and 19.95%, respectively, compare with MU’s 17.16%, 9.34%, and 10.67%.

Thus, NVDA is more profitable here.

Valuation

In terms of forward non-GAAP PEG, MU is currently trading at 0.45x, which is 74.9% lower than that of NVDA, which is trading at 1.79x. And MU’s 2.99 forward EV/Sales multiple is 82.6% lower than NVDA’s 17.18 multiple. In terms of its forward EV/EBITDA, MU is trading at 5.30x, which is 86.6% lower than NVDA’s 39.61x.

Thus, MU is relatively affordable here.

POWR Ratings

MU has an overall A rating, which equates to Strong Buy in our proprietary POWR Rating system. In contrast, NVDA has an overall rating of C, which translates to Neutral. The POWR Ratings are calculated by considering 118 different factors, with each factor weighted to an optimal degree.

MU has a Value grade of B, which is consistent with its 8.32 forward EV/EBIT multiple, which is 51.3% lower than the 17.09 industry average. In comparison, NVDA has a D grade for Value. This is justified because its EV/EBIT of 35.98x is 110.5% higher than the industry average.

Both stocks have a B grade for Sentiment, in sync with the favorable analysts’ expectations about their revenue and EPS growth.

In the 97-stock Semiconductor & Wireless Chip industry, MU is ranked #5, while NVDA is ranked #61. The industry is rated B.

In addition to the POWR Rating grades we’ve stated above, one can see the additional Growth, Momentum, Quality, and Stability ratings for MU here and for NVDA, here.

Winner

The semiconductor industry has shown substantial growth, bolstered by strong demand over the past year. Furthermore, the industry is expected to keep growing with above-average growth in all major product categories. Given the industry’s solid growth prospect, both NVDA and MU should benefit. However, we think MU’s relatively cheaper valuation makes it a better bet than NVDA now.

Our research shows that odds of success increase when one invests in stocks with an Overall Rating of Strong Buy or Buy. View all the top-rated stocks in the Semiconductor & Wireless Chip industry here.

Click here to checkout our Semiconductor Industry Report for 2022


NVDA shares were trading at $233.65 per share on Tuesday afternoon, down $10.20 (-4.18%). Year-to-date, NVDA has declined -20.56%, versus a -9.47% rise in the benchmark S&P 500 index during the same period.


About the Author: Anushka Dutta

Anushka is an analyst whose interest in understanding the impact of broader economic changes on financial markets motivated her to pursue a career in investment research.

More…

The post NVIDIA vs. Micron Technology: Which Chip Stock is a Better Buy? appeared first on StockNews.com

https://www.entrepreneur.com/article/421138


Markets Bid Up from Session Lows; ZM, HPQ Beat Earnings

This story originally appeared on Zacks

Market indexes raced northward in the final minutes of regular trading today, with mixed results on either side of within 1%. The Dow, which had been -589 points at its intraday low, came in -179 points or -0.53%. Big banks with Russian exposure — Goldman Sachs GS and JPMorgan JPM — helped lead the index down. The S&P 500 came in -0.26% on the day. Both indexes finished lower for the first regular session in the past three.
The Nasdaq, on the other hand, gained +0.41% after wallowing in the red a little more than an hour before the close. The small-cap Russell 2000 was up +0.35% on the day. Both indexes are up for a third-straight day, although all four major indexes close its second month in a row in the red.
Treasury yields dropped, and the 10-year and 2-year track slightly closer together today — 1.83% and 1.45%, respectively. Russian banks being taken off the SWIFT program looks to be the biggest instigator in shakiness regarding financials; mostly, we see uncertainty planting the flag today — there doesn’t seem to be a lot of clarity where things go from here. Much of it rests on what Russian leader Vladimir Putin decides to do as his invasion of Ukraine brings the impact of world sanctions against his country.
Energy was the only sector to gain today, and clearly we’ve seen strength in oil & gas going back prior to the Ukraine invasion. But solar power companies also posted strong gains, as alternative sources of energy not only look increasingly viable these days, but increasingly necessary. Environmentalists have been sounding this horn for decades, of course; now geopolitical experts are weighing in on it, as well.
Zoom Video ZM beat estimates on both top and bottom lines in its Q4 report: earnings of $1.29 per share on sales of $1.07 billion outpaced the $1.07 per share and $1.05 billion, respectively. Yet earnings guidance for Q1 is a big pullback to 86-88 cents ($1.03 per share had been the Zacks consensus), with downgrades in revenue and full-year guidance, as well. Zoom shares dropped as much as -11% in late trading; the stock is already down -28% year to date and -67.6% from a year ago.
Zoom did announce a $1 billion share buyback program, which certainly the company expects to stem the tide of selling. In fact, the late-session selling has abated notably: ZM shares are now -4.5% after hours. The company has never missed an earnings estimate going back to the company’s 2019 IPO.
Hewlett-Packard HPQ also reported earnings after the closing bell this Monday: earnings of $1.10 per share beat the $1.04 estimate in the company’s fiscal Q1, as revenues of $17.03 billion swept past expectations for $16.76 billion. Its PCs business outperformed expectations — $12.2 billion versus $11.6 billion anticipated — while its printing business lagged somewhat. Shares are relatively flat on the news after jumping initially. Shares are down -9.6% year to date but +16% from a year ago.
Questions or comments about this article and/or its author? Click here>>

– Zacks

Just Released: Zacks Top 10 Stocks for 2022

In addition to the investment ideas discussed above, would you like to know about our 10 top buy-and-hold tickers for the entirety of 2022?

Last year’s 2021 Zacks Top 10 Stocks portfolio returned gains as high as +147.7%. Now a brand-new portfolio has been handpicked from over 4,000 companies covered by the Zacks Rank. Don’t miss your chance to get in on these long-term buys

Access Zacks Top 10 Stocks for 2022 today >>

Want the latest recommendations from Zacks Investment Research? Today, you can download 7 Best Stocks for the Next 30 Days. Click to get this free report
 
The Goldman Sachs Group, Inc. (GS): Free Stock Analysis Report
 
JPMorgan Chase & Co. (JPM): Free Stock Analysis Report
 
HP Inc. (HPQ): Free Stock Analysis Report
 
Zoom Video Communications, Inc. (ZM): Free Stock Analysis Report
 
To read this article on Zacks.com click here.
 
Zacks Investment Research
 
Want the latest recommendations from Zacks Investment Research? Today, you can download 7 Best Stocks for the Next 30 Days. Click to get this free report

https://www.entrepreneur.com/article/421021


BioNTech SE Sponsored ADR (BNTX) Gains As Market Dips: What You Should Know

This story originally appeared on Zacks

BioNTech SE Sponsored ADR (BNTX) closed the most recent trading day at $150.81, moving +0.13% from the previous trading session. This change outpaced the S&P 500’s 0.24% loss on the day. Meanwhile, the Dow lost 0.49%, and the Nasdaq, a tech-heavy index, lost 0.04%.

– Zacks

Heading into today, shares of the company had lost 7.15% over the past month, lagging the Medical sector’s gain of 2.6% and the S&P 500’s gain of 0.73% in that time.

Wall Street will be looking for positivity from BioNTech SE Sponsored ADR as it approaches its next earnings report date. This is expected to be March 30, 2022. The company is expected to report EPS of $8.12, up 334.22% from the prior-year quarter. Meanwhile, the Zacks Consensus Estimate for revenue is projecting net sales of $4.58 billion, up 1012.76% from the year-ago period.

Any recent changes to analyst estimates for BioNTech SE Sponsored ADR should also be noted by investors. These revisions typically reflect the latest short-term business trends, which can change frequently. As a result, we can interpret positive estimate revisions as a good sign for the company’s business outlook.

Research indicates that these estimate revisions are directly correlated with near-term share price momentum. We developed the Zacks Rank to capitalize on this phenomenon. Our system takes these estimate changes into account and delivers a clear, actionable rating model.

Ranging from #1 (Strong Buy) to #5 (Strong Sell), the Zacks Rank system has a proven, outside-audited track record of outperformance, with #1 stocks returning an average of +25% annually since 1988. Over the past month, the Zacks Consensus EPS estimate has moved 2.75% higher. BioNTech SE Sponsored ADR currently has a Zacks Rank of #3 (Hold).

Valuation is also important, so investors should note that BioNTech SE Sponsored ADR has a Forward P/E ratio of 4.5 right now. This represents a discount compared to its industry’s average Forward P/E of 16.74.

The Medical – Biomedical and Genetics industry is part of the Medical sector. This group has a Zacks Industry Rank of 153, putting it in the bottom 40% of all 250+ industries.

The Zacks Industry Rank gauges the strength of our industry groups by measuring the average Zacks Rank of the individual stocks within the groups. Our research shows that the top 50% rated industries outperform the bottom half by a factor of 2 to 1.

Be sure to follow all of these stock-moving metrics, and many more, on Zacks.com.

Just Released: Zacks Top 10 Stocks for 2022

In addition to the investment ideas discussed above, would you like to know about our 10 top buy-and-hold tickers for the entirety of 2022?

Last year’s 2021 Zacks Top 10 Stocks portfolio returned gains as high as +147.7%. Now a brand-new portfolio has been handpicked from over 4,000 companies covered by the Zacks Rank. Don’t miss your chance to get in on these long-term buys

Access Zacks Top 10 Stocks for 2022 today >>

Want the latest recommendations from Zacks Investment Research? Today, you can download 7 Best Stocks for the Next 30 Days. Click to get this free report
 
BioNTech SE Sponsored ADR (BNTX): Free Stock Analysis Report
 
To read this article on Zacks.com click here.
 
Zacks Investment Research

https://www.entrepreneur.com/article/421022


Honeywell International Inc. (HON) Gains As Market Dips: What You Should Know

This story originally appeared on Zacks

Honeywell International Inc. (HON) closed the most recent trading day at $189.84, moving +0.68% from the previous trading session. This move outpaced the S&P 500’s daily loss of 0.24%. Elsewhere, the Dow lost 0.49%, while the tech-heavy Nasdaq lost 0.04%.

– Zacks

Coming into today, shares of the company had lost 6.65% in the past month. In that same time, the Conglomerates sector lost 1.44%, while the S&P 500 gained 0.73%.

Wall Street will be looking for positivity from Honeywell International Inc. as it approaches its next earnings report date. In that report, analysts expect Honeywell International Inc. to post earnings of $1.87 per share. This would mark a year-over-year decline of 2.6%. Meanwhile, the Zacks Consensus Estimate for revenue is projecting net sales of $8.41 billion, down 0.48% from the year-ago period.

HON’s full-year Zacks Consensus Estimates are calling for earnings of $8.64 per share and revenue of $36.17 billion. These results would represent year-over-year changes of +7.2% and +5.17%, respectively.

It is also important to note the recent changes to analyst estimates for Honeywell International Inc.These revisions typically reflect the latest short-term business trends, which can change frequently. As such, positive estimate revisions reflect analyst optimism about the company’s business and profitability.

Research indicates that these estimate revisions are directly correlated with near-term share price momentum. Investors can capitalize on this by using the Zacks Rank. This model considers these estimate changes and provides a simple, actionable rating system.

The Zacks Rank system, which ranges from #1 (Strong Buy) to #5 (Strong Sell), has an impressive outside-audited track record of outperformance, with #1 stocks generating an average annual return of +25% since 1988. Within the past 30 days, our consensus EPS projection has moved 3.73% lower. Honeywell International Inc. is currently a Zacks Rank #4 (Sell).

Looking at its valuation, Honeywell International Inc. is holding a Forward P/E ratio of 21.82. This valuation marks a premium compared to its industry’s average Forward P/E of 17.44.

It is also worth noting that HON currently has a PEG ratio of 2.28. The PEG ratio is similar to the widely-used P/E ratio, but this metric also takes the company’s expected earnings growth rate into account. The Diversified Operations industry currently had an average PEG ratio of 1.48 as of yesterday’s close.

The Diversified Operations industry is part of the Conglomerates sector. This group has a Zacks Industry Rank of 105, putting it in the top 42% of all 250+ industries.

The Zacks Industry Rank gauges the strength of our industry groups by measuring the average Zacks Rank of the individual stocks within the groups. Our research shows that the top 50% rated industries outperform the bottom half by a factor of 2 to 1.

Be sure to follow all of these stock-moving metrics, and many more, on Zacks.com.

Just Released: Zacks Top 10 Stocks for 2022

In addition to the investment ideas discussed above, would you like to know about our 10 top buy-and-hold tickers for the entirety of 2022?

Last year’s 2021 Zacks Top 10 Stocks portfolio returned gains as high as +147.7%. Now a brand-new portfolio has been handpicked from over 4,000 companies covered by the Zacks Rank. Don’t miss your chance to get in on these long-term buys

Access Zacks Top 10 Stocks for 2022 today >>

Want the latest recommendations from Zacks Investment Research? Today, you can download 7 Best Stocks for the Next 30 Days. Click to get this free report
 
Honeywell International Inc. (HON): Free Stock Analysis Report
 
To read this article on Zacks.com click here.

https://www.entrepreneur.com/article/421023


Lululemon (LULU) Gains As Market Dips: What You Should Know

This story originally appeared on Zacks

Lululemon (LULU) closed at $319.94 in the latest trading session, marking a +0.74% move from the prior day. This move outpaced the S&P 500’s daily loss of 0.24%. Elsewhere, the Dow lost 0.49%, while the tech-heavy Nasdaq lost 0.04%.

– Zacks

Coming into today, shares of the athletic apparel maker had gained 0.53% in the past month. In that same time, the Consumer Discretionary sector gained 1.86%, while the S&P 500 gained 0.73%.

Wall Street will be looking for positivity from Lululemon as it approaches its next earnings report date. In that report, analysts expect Lululemon to post earnings of $3.27 per share. This would mark year-over-year growth of 26.74%. Meanwhile, the Zacks Consensus Estimate for revenue is projecting net sales of $2.13 billion, up 23.37% from the year-ago period.

Investors should also note any recent changes to analyst estimates for Lululemon. These recent revisions tend to reflect the evolving nature of short-term business trends. As such, positive estimate revisions reflect analyst optimism about the company’s business and profitability.

Research indicates that these estimate revisions are directly correlated with near-term share price momentum. We developed the Zacks Rank to capitalize on this phenomenon. Our system takes these estimate changes into account and delivers a clear, actionable rating model.

The Zacks Rank system, which ranges from #1 (Strong Buy) to #5 (Strong Sell), has an impressive outside-audited track record of outperformance, with #1 stocks generating an average annual return of +25% since 1988. The Zacks Consensus EPS estimate has moved 0.1% higher within the past month. Lululemon is currently a Zacks Rank #3 (Hold).

Looking at its valuation, Lululemon is holding a Forward P/E ratio of 34.82. This valuation marks a premium compared to its industry’s average Forward P/E of 12.42.

It is also worth noting that LULU currently has a PEG ratio of 1.9. The PEG ratio is similar to the widely-used P/E ratio, but this metric also takes the company’s expected earnings growth rate into account. The Textile – Apparel industry currently had an average PEG ratio of 1.02 as of yesterday’s close.

The Textile – Apparel industry is part of the Consumer Discretionary sector. This group has a Zacks Industry Rank of 26, putting it in the top 11% of all 250+ industries.

The Zacks Industry Rank includes is listed in order from best to worst in terms of the average Zacks Rank of the individual companies within each of these sectors. Our research shows that the top 50% rated industries outperform the bottom half by a factor of 2 to 1.

Make sure to utilize Zacks.com to follow all of these stock-moving metrics, and more, in the coming trading sessions.

Just Released: Zacks Top 10 Stocks for 2022

In addition to the investment ideas discussed above, would you like to know about our 10 top buy-and-hold tickers for the entirety of 2022?

Last year’s 2021 Zacks Top 10 Stocks portfolio returned gains as high as +147.7%. Now a brand-new portfolio has been handpicked from over 4,000 companies covered by the Zacks Rank. Don’t miss your chance to get in on these long-term buys

Access Zacks Top 10 Stocks for 2022 today >>

Want the latest recommendations from Zacks Investment Research? Today, you can download 7 Best Stocks for the Next 30 Days. Click to get this free report
 
lululemon athletica inc. (LULU): Free Stock Analysis Report
 
To read this article on Zacks.com click here.

https://www.entrepreneur.com/article/421025


NextEra Energy (NEE) Gains As Market Dips: What You Should Know

This story originally appeared on Zacks

NextEra Energy (NEE) closed the most recent trading day at $78.27, moving +1.44% from the previous trading session. This move outpaced the S&P 500’s daily loss of 0.24%. Elsewhere, the Dow lost 0.49%, while the tech-heavy Nasdaq lost 0.04%.

– Zacks

Coming into today, shares of the parent company of Florida Power & Light Co. Had gained 6.43% in the past month. In that same time, the Utilities sector gained 0.47%, while the S&P 500 gained 0.73%.

Wall Street will be looking for positivity from NextEra Energy as it approaches its next earnings report date. In that report, analysts expect NextEra Energy to post earnings of $0.66 per share. This would mark a year-over-year decline of 1.49%.

NEE’s full-year Zacks Consensus Estimates are calling for earnings of $2.77 per share and revenue of $22.75 billion. These results would represent year-over-year changes of +8.63% and +33.29%, respectively.

Investors might also notice recent changes to analyst estimates for NextEra Energy. These revisions typically reflect the latest short-term business trends, which can change frequently. With this in mind, we can consider positive estimate revisions a sign of optimism about the company’s business outlook.

Our research shows that these estimate changes are directly correlated with near-term stock prices. Investors can capitalize on this by using the Zacks Rank. This model considers these estimate changes and provides a simple, actionable rating system.

The Zacks Rank system ranges from #1 (Strong Buy) to #5 (Strong Sell). It has a remarkable, outside-audited track record of success, with #1 stocks delivering an average annual return of +25% since 1988. Over the past month, the Zacks Consensus EPS estimate remained stagnant. NextEra Energy is currently a Zacks Rank #3 (Hold).

Investors should also note NextEra Energy’s current valuation metrics, including its Forward P/E ratio of 27.82. This represents a premium compared to its industry’s average Forward P/E of 18.05.

Investors should also note that NEE has a PEG ratio of 3.15 right now. This metric is used similarly to the famous P/E ratio, but the PEG ratio also takes into account the stock’s expected earnings growth rate. The Utility – Electric Power industry currently had an average PEG ratio of 3.27 as of yesterday’s close.

The Utility – Electric Power industry is part of the Utilities sector. This industry currently has a Zacks Industry Rank of 209, which puts it in the bottom 18% of all 250+ industries.

The Zacks Industry Rank includes is listed in order from best to worst in terms of the average Zacks Rank of the individual companies within each of these sectors. Our research shows that the top 50% rated industries outperform the bottom half by a factor of 2 to 1.

You can find more information on all of these metrics, and much more, on Zacks.com.

Just Released: Zacks Top 10 Stocks for 2022

In addition to the investment ideas discussed above, would you like to know about our 10 top buy-and-hold tickers for the entirety of 2022?

Last year’s 2021 Zacks Top 10 Stocks portfolio returned gains as high as +147.7%. Now a brand-new portfolio has been handpicked from over 4,000 companies covered by the Zacks Rank. Don’t miss your chance to get in on these long-term buys

Access Zacks Top 10 Stocks for 2022 today >>

Want the latest recommendations from Zacks Investment Research? Today, you can download 7 Best Stocks for the Next 30 Days. Click to get this free report
 
NextEra Energy, Inc. (NEE): Free Stock Analysis Report
 
To read this article on Zacks.com click here.
 
Zacks Investment Research

https://www.entrepreneur.com/article/421026


Dow Inc. (DOW) Dips More Than Broader Markets: What You Should Know

This story originally appeared on Zacks

Dow Inc. (DOW) closed at $58.96 in the latest trading session, marking a -1.16% move from the prior day. This move lagged the S&P 500’s daily loss of 0.24%. Elsewhere, the Dow lost 0.49%, while the tech-heavy Nasdaq lost 0.04%.

– Zacks

Coming into today, shares of the materials science had lost 0.65% in the past month. In that same time, the Basic Materials sector gained 7.21%, while the S&P 500 gained 0.73%.

Wall Street will be looking for positivity from Dow Inc. as it approaches its next earnings report date. This is expected to be April 21, 2022. In that report, analysts expect Dow Inc. to post earnings of $1.92 per share. This would mark year-over-year growth of 41.18%. Meanwhile, the Zacks Consensus Estimate for revenue is projecting net sales of $14.25 billion, up 19.92% from the year-ago period.

DOW’s full-year Zacks Consensus Estimates are calling for earnings of $6.72 per share and revenue of $55.84 billion. These results would represent year-over-year changes of -25.17% and +1.58%, respectively.

Investors might also notice recent changes to analyst estimates for Dow Inc.These recent revisions tend to reflect the evolving nature of short-term business trends. As a result, we can interpret positive estimate revisions as a good sign for the company’s business outlook.

Based on our research, we believe these estimate revisions are directly related to near-team stock moves. To benefit from this, we have developed the Zacks Rank, a proprietary model which takes these estimate changes into account and provides an actionable rating system.

Ranging from #1 (Strong Buy) to #5 (Strong Sell), the Zacks Rank system has a proven, outside-audited track record of outperformance, with #1 stocks returning an average of +25% annually since 1988. Within the past 30 days, our consensus EPS projection has moved 1.85% higher. Dow Inc. currently has a Zacks Rank of #3 (Hold).

In terms of valuation, Dow Inc. is currently trading at a Forward P/E ratio of 8.88. This represents a discount compared to its industry’s average Forward P/E of 12.77.

Also, we should mention that DOW has a PEG ratio of 0.3. This popular metric is similar to the widely-known P/E ratio, with the difference being that the PEG ratio also takes into account the company’s expected earnings growth rate. The Chemical – Diversified was holding an average PEG ratio of 1.08 at yesterday’s closing price.

The Chemical – Diversified industry is part of the Basic Materials sector. This group has a Zacks Industry Rank of 152, putting it in the bottom 41% of all 250+ industries.

The Zacks Industry Rank includes is listed in order from best to worst in terms of the average Zacks Rank of the individual companies within each of these sectors. Our research shows that the top 50% rated industries outperform the bottom half by a factor of 2 to 1.

Be sure to follow all of these stock-moving metrics, and many more, on Zacks.com.

Just Released: Zacks Top 10 Stocks for 2022

In addition to the investment ideas discussed above, would you like to know about our 10 top buy-and-hold tickers for the entirety of 2022?

Last year’s 2021 Zacks Top 10 Stocks portfolio returned gains as high as +147.7%. Now a brand-new portfolio has been handpicked from over 4,000 companies covered by the Zacks Rank. Don’t miss your chance to get in on these long-term buys

Access Zacks Top 10 Stocks for 2022 today >>

Want the latest recommendations from Zacks Investment Research? Today, you can download 7 Best Stocks for the Next 30 Days. Click to get this free report
 
Dow Inc. (DOW): Free Stock Analysis Report
 
To read this article on Zacks.com click here.
 
Zacks Investment Research

https://www.entrepreneur.com/article/421028


Bank of America (BAC) Dips More Than Broader Markets: What You Should Know

This story originally appeared on Zacks

In the latest trading session, Bank of America (BAC) closed at $44.20, marking a -1.82% move from the previous day. This change lagged the S&P 500’s daily loss of 0.24%. Elsewhere, the Dow lost 0.49%, while the tech-heavy Nasdaq lost 0.04%.

– Zacks

Coming into today, shares of the nation’s second-largest bank had lost 1.85% in the past month. In that same time, the Finance sector gained 0.89%, while the S&P 500 gained 0.73%.

Investors will be hoping for strength from Bank of America as it approaches its next earnings release, which is expected to be April 18, 2022. On that day, Bank of America is projected to report earnings of $0.79 per share, which would represent a year-over-year decline of 8.14%. Meanwhile, the Zacks Consensus Estimate for revenue is projecting net sales of $23.44 billion, up 2.69% from the year-ago period.

Looking at the full year, our Zacks Consensus Estimates suggest analysts are expecting earnings of $3.28 per share and revenue of $93.81 billion. These totals would mark changes of -8.12% and +5.27%, respectively, from last year.

Any recent changes to analyst estimates for Bank of America should also be noted by investors. These revisions help to show the ever-changing nature of near-term business trends. As such, positive estimate revisions reflect analyst optimism about the company’s business and profitability.

Research indicates that these estimate revisions are directly correlated with near-term share price momentum. Investors can capitalize on this by using the Zacks Rank. This model considers these estimate changes and provides a simple, actionable rating system.

The Zacks Rank system, which ranges from #1 (Strong Buy) to #5 (Strong Sell), has an impressive outside-audited track record of outperformance, with #1 stocks generating an average annual return of +25% since 1988. Within the past 30 days, our consensus EPS projection has moved 1.24% higher. Bank of America is holding a Zacks Rank of #3 (Hold) right now.

Looking at its valuation, Bank of America is holding a Forward P/E ratio of 13.71. This represents a premium compared to its industry’s average Forward P/E of 13.58.

Investors should also note that BAC has a PEG ratio of 1.96 right now. This popular metric is similar to the widely-known P/E ratio, with the difference being that the PEG ratio also takes into account the company’s expected earnings growth rate. The Banks – Major Regional industry currently had an average PEG ratio of 1.7 as of yesterday’s close.

The Banks – Major Regional industry is part of the Finance sector. This group has a Zacks Industry Rank of 85, putting it in the top 34% of all 250+ industries.

The Zacks Industry Rank gauges the strength of our industry groups by measuring the average Zacks Rank of the individual stocks within the groups. Our research shows that the top 50% rated industries outperform the bottom half by a factor of 2 to 1.

You can find more information on all of these metrics, and much more, on Zacks.com.

Just Released: Zacks Top 10 Stocks for 2022

In addition to the investment ideas discussed above, would you like to know about our 10 top buy-and-hold tickers for the entirety of 2022?

Last year’s 2021 Zacks Top 10 Stocks portfolio returned gains as high as +147.7%. Now a brand-new portfolio has been handpicked from over 4,000 companies covered by the Zacks Rank. Don’t miss your chance to get in on these long-term buys

Access Zacks Top 10 Stocks for 2022 today >>

Want the latest recommendations from Zacks Investment Research? Today, you can download 7 Best Stocks for the Next 30 Days. Click to get this free report
 
Bank of America Corporation (BAC): Free Stock Analysis Report
 
To read this article on Zacks.com click here.

https://www.entrepreneur.com/article/421027


Wells Fargo (WFC) Dips More Than Broader Markets: What You Should Know

This story originally appeared on Zacks

In the latest trading session, Wells Fargo (WFC) closed at $53.37, marking a -1.37% move from the previous day. This move lagged the S&P 500’s daily loss of 0.24%. At the same time, the Dow lost 0.49%, and the tech-heavy Nasdaq lost 0.04%.

– Zacks

Prior to today’s trading, shares of the biggest U.S. mortgage lender had lost 0.15% over the past month. This has lagged the Finance sector’s gain of 0.89% and the S&P 500’s gain of 0.73% in that time.

Wells Fargo will be looking to display strength as it nears its next earnings release. In that report, analysts expect Wells Fargo to post earnings of $0.83 per share. This would mark a year-over-year decline of 20.95%. Meanwhile, the Zacks Consensus Estimate for revenue is projecting net sales of $17.92 billion, down 0.8% from the year-ago period.

Looking at the full year, our Zacks Consensus Estimates suggest analysts are expecting earnings of $3.95 per share and revenue of $73.46 billion. These totals would mark changes of -20.2% and -5.85%, respectively, from last year.

It is also important to note the recent changes to analyst estimates for Wells Fargo. These recent revisions tend to reflect the evolving nature of short-term business trends. As such, positive estimate revisions reflect analyst optimism about the company’s business and profitability.

Our research shows that these estimate changes are directly correlated with near-term stock prices. Investors can capitalize on this by using the Zacks Rank. This model considers these estimate changes and provides a simple, actionable rating system.

Ranging from #1 (Strong Buy) to #5 (Strong Sell), the Zacks Rank system has a proven, outside-audited track record of outperformance, with #1 stocks returning an average of +25% annually since 1988. The Zacks Consensus EPS estimate has moved 1.46% higher within the past month. Wells Fargo is currently a Zacks Rank #1 (Strong Buy).

In terms of valuation, Wells Fargo is currently trading at a Forward P/E ratio of 13.69. Its industry sports an average Forward P/E of 13.58, so we one might conclude that Wells Fargo is trading at a premium comparatively.

Investors should also note that WFC has a PEG ratio of 1.34 right now. This popular metric is similar to the widely-known P/E ratio, with the difference being that the PEG ratio also takes into account the company’s expected earnings growth rate. The Banks – Major Regional industry currently had an average PEG ratio of 1.7 as of yesterday’s close.

The Banks – Major Regional industry is part of the Finance sector. This industry currently has a Zacks Industry Rank of 85, which puts it in the top 34% of all 250+ industries.

The Zacks Industry Rank gauges the strength of our individual industry groups by measuring the average Zacks Rank of the individual stocks within the groups. Our research shows that the top 50% rated industries outperform the bottom half by a factor of 2 to 1.

Make sure to utilize Zacks.com to follow all of these stock-moving metrics, and more, in the coming trading sessions.

Just Released: Zacks Top 10 Stocks for 2022

In addition to the investment ideas discussed above, would you like to know about our 10 top buy-and-hold tickers for the entirety of 2022?

Last year’s 2021 Zacks Top 10 Stocks portfolio returned gains as high as +147.7%. Now a brand-new portfolio has been handpicked from over 4,000 companies covered by the Zacks Rank. Don’t miss your chance to get in on these long-term buys

Access Zacks Top 10 Stocks for 2022 today >>

Want the latest recommendations from Zacks Investment Research? Today, you can download 7 Best Stocks for the Next 30 Days. Click to get this free report
 
Wells Fargo & Company (WFC): Free Stock Analysis Report
 
To read this article on Zacks.com click here.

https://www.entrepreneur.com/article/421029