Same Old Same Old in the Stock Market

We all have unique strengths and weaknesses. I would like to think that my strength is making sense of a highly irrational stock market and charting a course to outperform (you, of course, should be the final judge on that front). My weakness is that I truly hate repeating myself. That said, today I will attempt to look though a fresh lens at what I have been saying over the last week or so. Read on below for more….

shutterstock.com – StockNews

(Please enjoy this updated version of my weekly commentary published February 18th, 2022 from the POWR Value newsletter).

Part of my job is to come up with fresh commentary twice a week to explain a market that oft times is playing like a warped record.

That task weighs on me heavily today as there is not much more to say beyond what has already been said…

What I said in POWR Value commentary last week is still 100% true today: Read that commentary here.

And that sits on top of my unchanged bullish market outlook shared in detail in the Platinum members webinar on 2/7: Watch that here.

Just for clarity, we do have inflation…but it is natural in a rebounding economy and it will moderate.

And just for clarity, the Fed will raise rates…but that is still from the lowest levels in HUMAN HISTORY.

So until rates get above the historic norms of 3.5% on the 10 year Treasury…then lets stop wasting time talking about it like it’s a problem…cuz it ain’t!

And yes, I fully expect Russia to not give a hoot about what the rest world thinks and will in time invade the Ukraine.

But the likelihood of that affecting the US economy in any meaningful way, is incredibly low.

Add to that the historical fact that warfare is actually bullish and I am not even the slightest bit interested in becoming bearish at this time.

And as Forest Gump would oft state…”that’s all I gotta say about that”.

 What To Do Next?

If you’d like to see more top value stocks, then you should check out our free special report:

7 SEVERELY Undervalued Stocks

What makes these stocks great additions to any portfolio?

First, because they are all undervalued companies with exciting upside potential.

But even more important, is that they are all A rated Strong Buys according to our coveted POWR Ratings system. Yes, that same system where top-rated stocks have averaged a +31.10% annual return.

Click below now to see these 7 stellar value stocks with the right stuff to outperform in the coming months.

7 SEVERELY Undervalued Stocks

All the Best!

Steve Reitmeister
CEO StockNews.com & Editor of POWR Value trading service


SPY shares closed at $434.23 on Friday, down $-2.83 (-0.65%). Year-to-date, SPY has declined -8.58%, versus a % rise in the benchmark S&P 500 index during the same period.


About the Author: Steve Reitmeister

Steve is better known to the StockNews audience as “Reity”. Not only is he the CEO of the firm, but he also shares his 40 years of investment experience in the Reitmeister Total Return portfolio. Learn more about Reity’s background, along with links to his most recent articles and stock picks.

More…

The post Same Old Same Old in the Stock Market appeared first on StockNews.com

https://www.entrepreneur.com/article/419619



Will ETFs Gain From Improving US Industrial Output in January?

The latest data on U.S. industrial output seems to be encouraging amid improving labor market and easing pandemic conditions. Per the Fed’s recently-released data, total industrial production rose 1.4% in January. A 0.2% rise in manufacturing output compared favorably with a revised decline of 0.1% in December. Going on, there was a 9.9% jump in utility production. The dropping temperature in January led to an increased demand for heating. Moreover, mining production witnessed a 1% gain mainly on strength in the oil and gas sector.

– Zacks

Considering the latest data release, investors can track ETFs like The Industrial Select Sector SPDR Fund (XLI), Vanguard Industrials ETF (VIS), Fidelity MSCI Industrials Index ETF (FIDU) and iShares U.S. Industrials ETF (IYJ), which might gain from improving industrial output.

Total industrial production increased 4.1% from the year-ago figure in January. According to the Fed’s report, the durable and the nondurable manufacturing indexes along with the other manufacturing (publishing and logging) inched up nearly 0.2% each.

Going on, capacity utilization for the industrial sector rose 1% in January to 77.6%. The manufacturing capacity utilization for the industry, which is the measure for studying how efficiently firms are utilizing their resources, increased 0.1% in January to 77.3%, which is 1.8 percentage points above its pre-pandemic level, per the Fed’s report.

Present U.S. Economic Scenario

Market gyrations have been a common phenomenon in 2022. After some rally so far in February, major broader indices continue ending in the red due to red-hot inflation readings and intensifying geopolitical tensions. A solid fourth-quarter earnings season and an improving labor market helped keep market participants upbeat.

Global markets are again hurt by the escalating tensions between Russia and Ukraine on Feb 17. This led to an increase in oil prices as well. The market participants were already dealing with red-hot inflation readings as the consumer price index (CPI) jumped 7.5% year over year in January, marking the largest 12-month gain since February 1982. The high inflation has set the stage for the first interest rate hike as soon as March.

The core inflation index, which excludes volatile components such as food and energy prices, rose 6% year over year, marking the highest growth since August 1982. Energy prices remained a key contributor to the inflation numbers, with a 27% year-over-year increase.

U.S. consumers are feeling the heat of the continuously rising inflation levels. The University of Michigan’s preliminary consumer sentiment dropped to 61.7 in early February from a final reading of 67.2 last month. The metric, which witnessed the lowest level since October 2011, lagged the market forecast of a slight rise to 67.5, per the Reuters survey on economists.

Meanwhile, the strong jobs report for January has supported some market optimism. The U.S. economy added 467,000 jobs in January 2022, surpassing market expectations of a rise of 150,000. The upside was largely driven by easing business restrictions amid the reopening of economies and accelerated coronavirus vaccine rollout. January figures stood out to be pleasantly surprising as the Omicron coronavirus variant weighed on the jobs market. The ADP report also showed that private companies cut 301,000 jobs.

The improving jobs report also signals a higher possibility of the Federal Reserve hiking the benchmark interest rates in March. This is preparing investors for the upcoming rate hike, supporting market movements.

Industrial ETFs in Focus

In the current scenario, we believe it is prudent to discuss ETFs that have relatively high exposure to industrial companies:

The Industrial Select Sector SPDR Fund XLI           

The Industrial Select Sector SPDR Fund seeks to provide investment results that, before expenses, match the performance of the Industrial Select Sector Index. The Industrial Select Sector SPDR Fund has AUM of $16.53 billion and its expense ratio is 0.10% (read: How Are Industrial ETFs Reacting to Mixed Q4 Earnings?).

Vanguard Industrials ETF VIS                   

Vanguard Industrials ETF offers exposure to the industrial sector and follows the MSCI US Investable Market Industrials 25/50 Index. Vanguard Industrials ETF manages an AUM of $4.60 billion and its expense ratio is 0.10%.

Fidelity MSCI Industrials Index ETF FIDU

The Fidelity MSCI Industrials Index ETF seeks to provide investment returns that match, before fees and expenses, the performance of the MSCI USA IMI Industrials Index. Fidelity MSCI Industrials Index ETF has AUM of $835.5 million and its expense ratio, 0.08%.

iShares U.S. Industrials ETF IYJ

The iShares U.S. Industrials ETF seeks to track the investment results of the Russell 1000 Industrials 40 Act 15/22.5 Daily Capped Index. iShares U.S. Industrials ETF has AUM of $1.51 billion and its expense ratio is 0.41%, as stated in the prospectus.

Want key ETF info delivered straight to your inbox?

Zacks’ free Fund Newsletter will brief you on top news and analysis, as well as top-performing ETFs, each week.

Get it free >>

Want the latest recommendations from Zacks Investment Research? Today, you can download 7 Best Stocks for the Next 30 Days. Click to get this free report
 
Vanguard Industrials ETF (VIS): ETF Research Reports
 
Industrial Select Sector SPDR ETF (XLI): ETF Research Reports
 
iShares U.S. Industrials ETF (IYJ): ETF Research Reports
 
Fidelity MSCI Industrials Index ETF (FIDU): ETF Research Reports
 
To read this article on Zacks.com click here.
 
Zacks Investment Research

https://www.entrepreneur.com/article/419575


Focusing on the Retail Sector as Q4 Earnings Season Winds Down

Walmart’s WMT quarterly report showed that it was able to work through the supply-chain challenges and keep its shelves fully stocked.

– Zacks

Walmart had to spend more to keep shelves stocked and stores staffed, with supply-chain costs coming in $400 million more than it had budgeted, with the Omicron surge significantly adding to its Covid-specific paid-leave costs. As had been the case in the preceding period, Walmart benefited from +26% more inventory on hand during the reported quarter.

The market appreciated Walmart’s ability to navigate this difficult operating environment in an otherwise robust consumer-spending backdrop, as the January Retail Sales report showed. It will be interesting to see if retail operators like Home Depot (HD), Lowe’s (LOW), Macy’s (M) and others that are reporting results this week will get the same treatment.

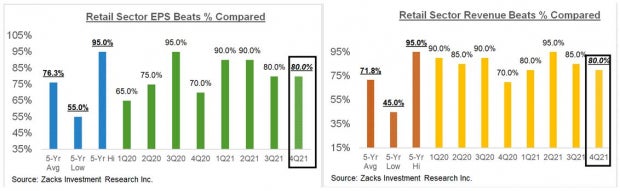
With respect to the Retail sector 2021 Q4 earnings season scorecard, we now have results from 20 of the 34 retailers in the S&P 500 index. Total Q4 earnings for these retailers are up +53.6% from the same period last year on +7.5% higher revenues, with 80% beating EPS estimates and an equal proportion beating revenue estimates. The comparison charts below put the Q4 beats percentages for these retailers in a historical context.

Zacks Investment Research
Image Source: Zacks Investment Research

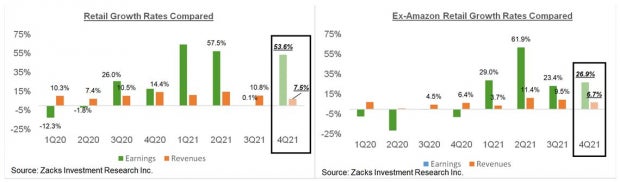
With respect to the earnings and revenue growth rates, Amazon’s blockbuster numbers play a significant role in the strong year-over-year growth rate for the sector (Amazon is part of the Zacks Retail sector and not the Zacks Technology sector). The two comparison charts below show the Q4 earnings and revenue growth relative to other recent periods, both with Amazon’s results (left side chart) and without Amazon’s numbers (right side chart).

Zacks Investment Research
Image Source: Zacks Investment Research

This Week’s Reporting Docket

We have more than 700 companies on deck to report results this week, including 53 S&P 500 members. Notable companies reporting this week, aside from the aforementioned retailers, are Live Nation Entertainment (LYV), Bookings Holdings (BKNG), Medtronic (MDT) and others.

Q4 Earnings Season Scorecard

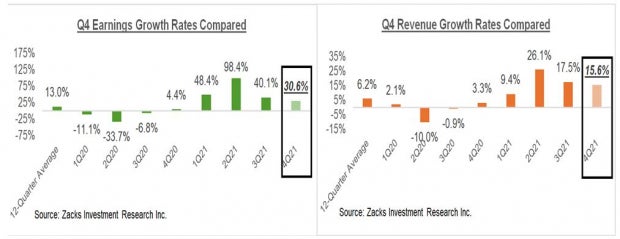
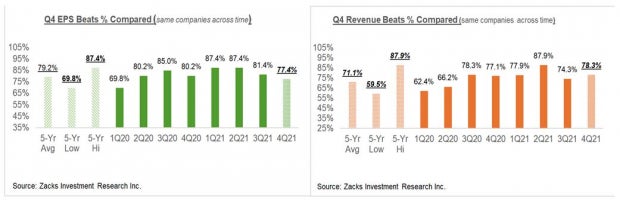
Including all the results that came out through Friday, February 18th, we now have Q4 results from 420 S&P 500 members or 84% of the index’s total membership. Total earnings (or aggregate net income) for these 420 companies are up +30.6% from the same period last year on +15.6% lower revenues, with 77.4% beating EPS estimates and 78.3% beating revenue estimates.

The two sets of comparison charts below put the Q4 results from these 420 index members in a historical context, which should give us a sense how the Q4 earnings season is tracking at this stage relative to other recent periods.

The first set of charts compare the earnings and revenue growth rates for these 420 index members.

Zacks Investment Research
Image Source: Zacks Investment Research

The second set of charts compares the proportion of these 420 index members beating EPS and revenue estimates.

Zacks Investment Research
Image Source: Zacks Investment Research

As you can see from the above comparison, the Q4 numbers not only represent a growth deceleration from the pace of the first three quarters of the year, but also in terms of the beats percentages, particularly EPS beats percentages.

In fact, Q4 revenue beats exceed the Q4 EPS beats percentage. The most logical explanation for this anomaly is the impact of ongoing inflationary trends and other logistical bottlenecks that appear to have been bigger headwinds than analysts had been expecting. Revenues remain strong, a reflection of continued strong demand, but margins have been under pressure as a result of a bigger than expected rise in costs. 

Expectations for Q4 & Beyond

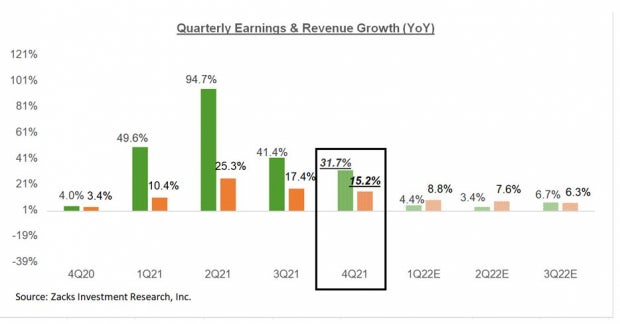
Looking at the quarter as a whole, combining the actual results that have come out with estimates for the still-to-come companies, total Q4 earnings for the S&P 500 index are expected to be up +31.7% from the same period last year on +15.2% higher revenues.

The chart below presents the earnings and revenue growth picture on a quarterly basis, with expectations for 2021 Q4 contrasted with the actual growth achieved over the preceding four quarters and estimates for the following three.

Zacks Investment Research
Image Source: Zacks Investment Research

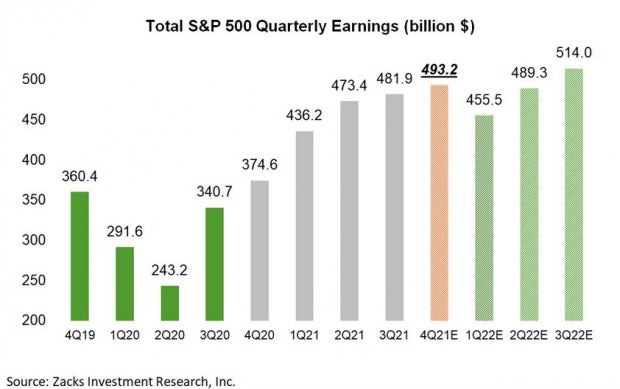
Please note that while the year-over-year earnings growth rate has been coming down, the overall dollar value of earnings remains very high. In fact, the aggregate earnings total for 2021 Q4 is on track to reach a new all-time quarterly record, as the chart below shows.

Zacks Investment Research
Image Source: Zacks Investment Research

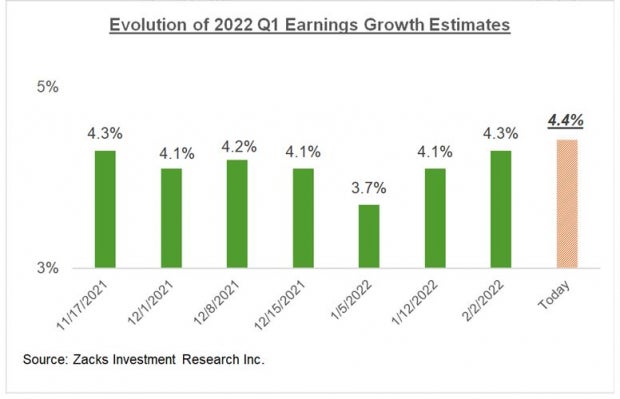
For the current period, total S&P 500 earnings are expected to increase +4.4% from the same period last year on +8.4% higher revenues. The chart below shows the revisions trend for the current period.

Zacks Investment Research
Image Source: Zacks Investment Research

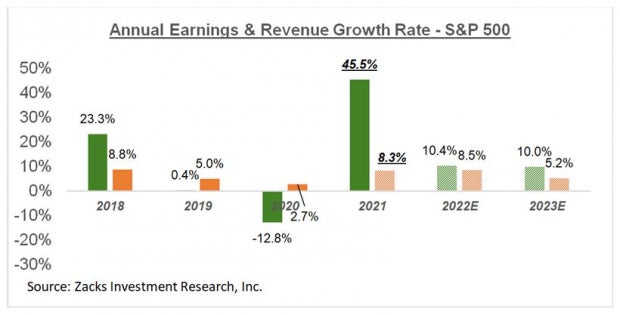
The chart below shows the comparable picture on an annual basis.

Zacks Investment Research
Image Source: Zacks Investment Research

For a detailed look at the overall earnings picture, including expectations for the coming periods, please check out our weekly Earnings Trends report >>>>Record Earnings in Q4 Despite Economic Headwinds 

Infrastructure Stock Boom to Sweep America

A massive push to rebuild the crumbling U.S. infrastructure will soon be underway. It’s bipartisan, urgent, and inevitable. Trillions will be spent. Fortunes will be made.

The only question is “Will you get into the right stocks early when their growth potential is greatest?”

Zacks has released a Special Report to help you do just that, and today it’s free.Discover 5 special companies that look to gain the most from construction and repair to roads, bridges, and buildings, plus cargo hauling and energy transformation on an almost unimaginable scale.

Download FREE: How To Profit From Trillions On Spending For Infrastructure >>

Want the latest recommendations from Zacks Investment Research? Today, you can download 7 Best Stocks for the Next 30 Days. Click to get this free report
 
Walmart Inc. (WMT): Free Stock Analysis Report
 
To read this article on Zacks.com click here.
 
Zacks Investment Research

https://www.entrepreneur.com/article/419570


Greenbrier Companies (GBX) Gains As Market Dips: What You Should Know

This story originally appeared on Zacks

In the latest trading session, Greenbrier Companies (GBX) closed at $43.25, marking a +0.25% move from the previous day. This move outpaced the S&P 500’s daily loss of 0.72%. At the same time, the Dow lost 0.68%, and the tech-heavy Nasdaq lost 0.66%.

– Zacks

Prior to today’s trading, shares of the maker of railroad freight car equipment had gained 10.28% over the past month. This has outpaced the Transportation sector’s loss of 1.56% and the S&P 500’s loss of 5.92% in that time.

Greenbrier Companies will be looking to display strength as it nears its next earnings release. The company is expected to report EPS of $0.10, up 135.71% from the prior-year quarter. Meanwhile, the Zacks Consensus Estimate for revenue is projecting net sales of $578.8 million, up 95.79% from the year-ago period.

Looking at the full year, our Zacks Consensus Estimates suggest analysts are expecting earnings of $2.28 per share and revenue of $2.58 billion. These totals would mark changes of +107.27% and +47.43%, respectively, from last year.

It is also important to note the recent changes to analyst estimates for Greenbrier Companies. These recent revisions tend to reflect the evolving nature of short-term business trends. As such, positive estimate revisions reflect analyst optimism about the company’s business and profitability.

Our research shows that these estimate changes are directly correlated with near-term stock prices. Investors can capitalize on this by using the Zacks Rank. This model considers these estimate changes and provides a simple, actionable rating system.

Ranging from #1 (Strong Buy) to #5 (Strong Sell), the Zacks Rank system has a proven, outside-audited track record of outperformance, with #1 stocks returning an average of +25% annually since 1988. Within the past 30 days, our consensus EPS projection has moved 0.33% higher. Greenbrier Companies is currently sporting a Zacks Rank of #3 (Hold).

Investors should also note Greenbrier Companies’s current valuation metrics, including its Forward P/E ratio of 18.9. This represents a premium compared to its industry’s average Forward P/E of 11.98.

Investors should also note that GBX has a PEG ratio of 2.7 right now. This metric is used similarly to the famous P/E ratio, but the PEG ratio also takes into account the stock’s expected earnings growth rate. GBX’s industry had an average PEG ratio of 1.09 as of yesterday’s close.

The Transportation – Equipment and Leasing industry is part of the Transportation sector. This industry currently has a Zacks Industry Rank of 33, which puts it in the top 13% of all 250+ industries.

The Zacks Industry Rank gauges the strength of our individual industry groups by measuring the average Zacks Rank of the individual stocks within the groups. Our research shows that the top 50% rated industries outperform the bottom half by a factor of 2 to 1.

To follow GBX in the coming trading sessions, be sure to utilize Zacks.com.

Infrastructure Stock Boom to Sweep America

A massive push to rebuild the crumbling U.S. infrastructure will soon be underway. It’s bipartisan, urgent, and inevitable. Trillions will be spent. Fortunes will be made.

The only question is “Will you get into the right stocks early when their growth potential is greatest?”

Zacks has released a Special Report to help you do just that, and today it’s free.Discover 5 special companies that look to gain the most from construction and repair to roads, bridges, and buildings, plus cargo hauling and energy transformation on an almost unimaginable scale.

Download FREE: How To Profit From Trillions On Spending For Infrastructure >>

Want the latest recommendations from Zacks Investment Research? Today, you can download 7 Best Stocks for the Next 30 Days. Click to get this free report
 
Greenbrier Companies, Inc. The (GBX): Free Stock Analysis Report
 
To read this article on Zacks.com click here.

https://www.entrepreneur.com/article/419562


How Will Telecom ETFs React to Decent Q4 Earnings?

This story originally appeared on Zacks

Increasing digitization trends and the virtual modes of communication continue to support the telecom sector amid the ongoing health crisis. The pandemic has been a blessing in disguise for the e-commerce industry as people continue are practicing social distancing and shopping online for all essentials, especially food item.

– Zacks

This has resulted in increasing demand for high-speed Internet connection and stable connectivity. Firms are working toward improving data traffic management as people continue to work from home and prefer limited and small gatherings.

Companies are also preparing their fiber optic networks to support 4G LTE and 5G wireless standards as well as wireline connections. The introduction of 5G smartphones is likely to encourage telecom operators to make the 5G network more pervasive. Players in the sector are trying to redefine business plans to optimize efficiencies and operations and reduce costs while supporting employees and customers with several financial packages.

Let’s look at some big telecom earnings releases and see if these can impact ETFs exposed to the space.

Earnings in Focus

On Jan 26, AT&T Inc. T reported fourth-quarter 2021 results, where adjusted earnings and revenues beat the Zacks Consensus Estimate. Excluding non-recurring items, adjusted earnings in the quarter were 78 cents per share compared with 75 cents a year ago. The bottom line surpassed the Zacks Consensus Estimate by a couple of cents. Quarterly GAAP operating revenues slid 10.4% year over year to $40.96 billion and surpassed the Zacks Consensus Estimate of $40.42 billion.

For full-year 2022, AT&T expects adjusted earnings in the range of $3.10 to $3.15 per share. Revenues are likely to grow by low single digits. The company expects free cash flow in the vicinity of $23 billion.

On Jan 25, Verizon Communications Inc. VZ reported strong fourth-quarter 2021 adjusted earnings of $1.31 per share and beat the Zacks Consensus Estimate by 3 cents. Quarterly aggregate operating revenues declined 1.8% year over year to $34.07 billion. However, the metric surpassed the Zacks Consensus Estimate of $33.83 billion.

For 2022, Verizon expects organic service and other revenue growth at about 3%. On a reported basis, which includes the net impact of the sale of Verizon Media and the company’s ownership of TracFone, service and other revenue growth is expected between 1% and 1.5%. Reported wireless service revenue growth is projected in the range of 9-10%. Excluding the impact of the TracFone acquisition, wireless service revenues are expected to grow at least 3%.

On Feb 9, Lumen Technologies LUMN reported weak fourth-quarter 2021 results, with the bottom and the top line lagging the Zacks Consensus Estimate. Quarterly adjusted net income came in at $522 million or 51 cents per share compared with $453 million or 42 cents per share in the prior-year quarter. The bottom line missed the Zacks Consensus Estimate by 4 cents. Quarterly total revenues dropped 5.4% year over year to $4.85 billion. The top line lagged the consensus estimate of $4.86 billion.

For 2022, Lumen expects adjusted EBITDA in the range of $6.5-$6.7 billion. Free cash flow is projected between $1.6 billion and $1.8 billion. Capital expenditures are estimated between $3.2 billion and $3.4 billion. The effective income tax rate for the full year is estimated to be nearly 26%.

ETF Angle

In the current scenario, let’s discuss ETFs with relatively high exposure to the companies discussed.

iShares U.S. Telecommunications ETF IYZ

This ETF provides exposure to U.S. companies that provide telephone and internet products, services, and technologies. It has AUM of $358.7 million and charges 42 basis points (bps) as fees per year. It holds about 21 securities in its basket and puts about 22.7% weight in the in-focus companies. IYZ has a Zacks ETF Rank #3 (Hold), with a Medium-risk outlook.

Vanguard Communication Services ETF VOX

This ETF is one of the most popular funds in the communication services space. It has AUM of $3.78 billion and charges 10 bps as fees per year. It comprises 113 holdings, with the above-mentioned companies taking about 9.9% of the fund. VOX has a Zacks ETF Rank #3, with a Medium-risk outlook (read: Stocks & ETFs to Gain From Final Nod for Infrastructure Bill).

Fidelity MSCI Communication Services Index ETF FCOM

This ETF provides exposure to the communication services sector in the U.S. equity market at a really low expense ratio. It has AUM of $766.8 million and charges 8 bps as fees per year. It holds about 114 securities in its basket, with the above-mentioned companies taking about 9.9% weight in the fund. FCOM has a Zacks ETF Rank #3 with a Medium-risk outlook (read: Meta Platforms Sinks Post Dismal Q4 Earnings: ETFs in Focus).

Want key ETF info delivered straight to your inbox?

Zacks’ free Fund Newsletter will brief you on top news and analysis, as well as top-performing ETFs, each week.

Get it free >>

Want the latest recommendations from Zacks Investment Research? Today, you can download 7 Best Stocks for the Next 30 Days. Click to get this free report
 
AT&T Inc. (T): Free Stock Analysis Report
 
Verizon Communications Inc. (VZ): Free Stock Analysis Report
 
Vanguard Communication Services ETF (VOX): ETF Research Reports
 
Fidelity MSCI Communication Services Index ETF (FCOM): ETF Research Reports
 
iShares U.S. Telecommunications ETF (IYZ): ETF Research Reports
 
Lumen Technologies, Inc. (LUMN): Free Stock Analysis Report
 
To read this article on Zacks.com click here.
 
Zacks Investment Research

https://www.entrepreneur.com/article/419366


SJW (SJW) Misses Q4 Earnings and Revenue Estimates

This story originally appeared on Zacks

SJW (SJW) came out with quarterly earnings of $0.42 per share, missing the Zacks Consensus Estimate of $0.48 per share. This compares to earnings of $0.46 per share a year ago. These figures are adjusted for non-recurring items.

– Zacks

This quarterly report represents an earnings surprise of -12.50%. A quarter ago, it was expected that this parent of San Jose Water Co. Would post earnings of $0.71 per share when it actually produced earnings of $0.64, delivering a surprise of -9.86%.

Over the last four quarters, the company has not been able to surpass consensus EPS estimates.

SJW, which belongs to the Zacks Utility – Water Supply industry, posted revenues of $139.74 million for the quarter ended December 2021, missing the Zacks Consensus Estimate by 0.81%. This compares to year-ago revenues of $135.7 million. The company has topped consensus revenue estimates just once over the last four quarters.

The sustainability of the stock’s immediate price movement based on the recently-released numbers and future earnings expectations will mostly depend on management’s commentary on the earnings call.

SJW shares have lost about 11.9% since the beginning of the year versus the S&P 500’s decline of -6.1%.

What’s Next for SJW?

While SJW has underperformed the market so far this year, the question that comes to investors’ minds is: what’s next for the stock?

There are no easy answers to this key question, but one reliable measure that can help investors address this is the company’s earnings outlook. Not only does this include current consensus earnings expectations for the coming quarter(s), but also how these expectations have changed lately.

Empirical research shows a strong correlation between near-term stock movements and trends in earnings estimate revisions. Investors can track such revisions by themselves or rely on a tried-and-tested rating tool like the Zacks Rank, which has an impressive track record of harnessing the power of earnings estimate revisions.

Ahead of this earnings release, the estimate revisions trend for SJW: favorable. While the magnitude and direction of estimate revisions could change following the company’s just-released earnings report, the current status translates into a Zacks Rank #2 (Buy) for the stock. So, the shares are expected to outperform the market in the near future. You can see the complete list of today’s Zacks #1 Rank (Strong Buy) stocks here.

It will be interesting to see how estimates for the coming quarters and current fiscal year change in the days ahead. The current consensus EPS estimate is $0.09 on $118 million in revenues for the coming quarter and $2.40 on $600.94 million in revenues for the current fiscal year.

Investors should be mindful of the fact that the outlook for the industry can have a material impact on the performance of the stock as well. In terms of the Zacks Industry Rank, Utility – Water Supply is currently in the bottom 32% of the 250 plus Zacks industries. Our research shows that the top 50% of the Zacks-ranked industries outperform the bottom 50% by a factor of more than 2 to 1.

Essential Utilities (WTRG), another stock in the same industry, has yet to report results for the quarter ended December 2021. The results are expected to be released on February 23.

This water utility is expected to post quarterly earnings of $0.43 per share in its upcoming report, which represents a year-over-year change of -6.5%. The consensus EPS estimate for the quarter has remained unchanged over the last 30 days.

Essential Utilities’ revenues are expected to be $497 million, up 4.9% from the year-ago quarter.

7 Best Stocks for the Next 30 Days

Just released: Experts distill 7 elite stocks from the current list of 220 Zacks Rank #1 Strong Buys. They deem these tickers “Most Likely for Early Price Pops.”

Since 1988, the full list has beaten the market more than 2X over with an average gain of +25.4% per year. So be sure to give these hand-picked 7 your immediate attention. 

See them now >>

Want the latest recommendations from Zacks Investment Research? Today, you can download 7 Best Stocks for the Next 30 Days. Click to get this free report
 
SJW Group (SJW): Free Stock Analysis Report
 
Essential Utilities Inc. (WTRG): Free Stock Analysis Report
 
To read this article on Zacks.com click here.
 
Zacks Investment Research

https://www.entrepreneur.com/article/419365


Ritchie Bros. (RBA) Misses Q4 Earnings and Revenue Estimates

This story originally appeared on Zacks

Ritchie Bros. (RBA) came out with quarterly earnings of $0.50 per share, missing the Zacks Consensus Estimate of $0.58 per share. This compares to earnings of $0.49 per share a year ago. These figures are adjusted for non-recurring items.

– Zacks

This quarterly report represents an earnings surprise of -13.79%. A quarter ago, it was expected that this heavy equipment auctioneer would post earnings of $0.35 per share when it actually produced earnings of $0.44, delivering a surprise of 25.71%.

Over the last four quarters, the company has surpassed consensus EPS estimates two times.

Ritchie Bros., which belongs to the Zacks Auction and Valuation Services industry, posted revenues of $359.37 million for the quarter ended December 2021, missing the Zacks Consensus Estimate by 8.30%. This compares to year-ago revenues of $383.41 million. The company has topped consensus revenue estimates two times over the last four quarters.

The sustainability of the stock’s immediate price movement based on the recently-released numbers and future earnings expectations will mostly depend on management’s commentary on the earnings call.

Ritchie Bros. Shares have lost about 5.3% since the beginning of the year versus the S&P 500’s decline of -6.1%.

What’s Next for Ritchie Bros.

While Ritchie Bros. Has outperformed the market so far this year, the question that comes to investors’ minds is: what’s next for the stock?

There are no easy answers to this key question, but one reliable measure that can help investors address this is the company’s earnings outlook. Not only does this include current consensus earnings expectations for the coming quarter(s), but also how these expectations have changed lately.

Empirical research shows a strong correlation between near-term stock movements and trends in earnings estimate revisions. Investors can track such revisions by themselves or rely on a tried-and-tested rating tool like the Zacks Rank, which has an impressive track record of harnessing the power of earnings estimate revisions.

Ahead of this earnings release, the estimate revisions trend for Ritchie Bros. Unfavorable. While the magnitude and direction of estimate revisions could change following the company’s just-released earnings report, the current status translates into a Zacks Rank #4 (Sell) for the stock. So, the shares are expected to underperform the market in the near future. You can see the complete list of today’s Zacks #1 Rank (Strong Buy) stocks here.

It will be interesting to see how estimates for the coming quarters and current fiscal year change in the days ahead. The current consensus EPS estimate is $0.37 on $383.36 million in revenues for the coming quarter and $2.27 on $1.68 billion in revenues for the current fiscal year.

Investors should be mindful of the fact that the outlook for the industry can have a material impact on the performance of the stock as well. In terms of the Zacks Industry Rank, Auction and Valuation Services is currently in the bottom 12% of the 250 plus Zacks industries. Our research shows that the top 50% of the Zacks-ranked industries outperform the bottom 50% by a factor of more than 2 to 1.

Hackett Group (HCKT), another stock in the broader Zacks Business Services sector, has yet to report results for the quarter ended December 2021. The results are expected to be released on February 22.

This consulting company is expected to post quarterly earnings of $0.29 per share in its upcoming report, which represents a year-over-year change of +26.1%. The consensus EPS estimate for the quarter has remained unchanged over the last 30 days.

Hackett Group’s revenues are expected to be $65.85 million, up 11.2% from the year-ago quarter.

7 Best Stocks for the Next 30 Days

Just released: Experts distill 7 elite stocks from the current list of 220 Zacks Rank #1 Strong Buys. They deem these tickers “Most Likely for Early Price Pops.”

Since 1988, the full list has beaten the market more than 2X over with an average gain of +25.4% per year. So be sure to give these hand-picked 7 your immediate attention. 

See them now >>

Want the latest recommendations from Zacks Investment Research? Today, you can download 7 Best Stocks for the Next 30 Days. Click to get this free report
 
Ritchie Bros. Auctioneers Incorporated (RBA): Free Stock Analysis Report
 
The Hackett Group, Inc. (HCKT): Free Stock Analysis Report
 
To read this article on Zacks.com click here.
 
Zacks Investment Research

https://www.entrepreneur.com/article/419355


Sixth Street (TSLX) Surpasses Q4 Earnings and Revenue Estimates

This story originally appeared on Zacks

Sixth Street (TSLX) came out with quarterly earnings of $0.63 per share, beating the Zacks Consensus Estimate of $0.53 per share. This compares to earnings of $0.50 per share a year ago. These figures are adjusted for non-recurring items.

– Zacks

This quarterly report represents an earnings surprise of 18.87%. A quarter ago, it was expected that this business development company would post earnings of $0.51 per share when it actually produced earnings of $0.55, delivering a surprise of 7.84%.

Over the last four quarters, the company has surpassed consensus EPS estimates three times.

Sixth St, which belongs to the Zacks Financial – Mortgage & Related Services industry, posted revenues of $78.32 million for the quarter ended December 2021, surpassing the Zacks Consensus Estimate by 13.48%. This compares to year-ago revenues of $62.2 million. The company has topped consensus revenue estimates three times over the last four quarters.

The sustainability of the stock’s immediate price movement based on the recently-released numbers and future earnings expectations will mostly depend on management’s commentary on the earnings call.

Sixth St shares have added about 0.7% since the beginning of the year versus the S&P 500’s decline of -6.1%.

What’s Next for Sixth St?

While Sixth St has outperformed the market so far this year, the question that comes to investors’ minds is: what’s next for the stock?

There are no easy answers to this key question, but one reliable measure that can help investors address this is the company’s earnings outlook. Not only does this include current consensus earnings expectations for the coming quarter(s), but also how these expectations have changed lately.

Empirical research shows a strong correlation between near-term stock movements and trends in earnings estimate revisions. Investors can track such revisions by themselves or rely on a tried-and-tested rating tool like the Zacks Rank, which has an impressive track record of harnessing the power of earnings estimate revisions.

Ahead of this earnings release, the estimate revisions trend for Sixth St: mixed. While the magnitude and direction of estimate revisions could change following the company’s just-released earnings report, the current status translates into a Zacks Rank #3 (Hold) for the stock. So, the shares are expected to perform in line with the market in the near future. You can see the complete list of today’s Zacks #1 Rank (Strong Buy) stocks here.

It will be interesting to see how estimates for the coming quarters and current fiscal year change in the days ahead. The current consensus EPS estimate is $0.51 on $70.17 million in revenues for the coming quarter and $2.05 on $286.96 million in revenues for the current fiscal year.

Investors should be mindful of the fact that the outlook for the industry can have a material impact on the performance of the stock as well. In terms of the Zacks Industry Rank, Financial – Mortgage & Related Services is currently in the bottom 44% of the 250 plus Zacks industries. Our research shows that the top 50% of the Zacks-ranked industries outperform the bottom 50% by a factor of more than 2 to 1.

One other stock from the same industry, Ocwen Financial (OCN), is yet to report results for the quarter ended December 2021.

This mortgage servicer is expected to post quarterly earnings of $2.46 per share in its upcoming report, which represents a year-over-year change of +396.4%. The consensus EPS estimate for the quarter has remained unchanged over the last 30 days.

Ocwen Financial’s revenues are expected to be $52.17 million, down 77.4% from the year-ago quarter.

7 Best Stocks for the Next 30 Days

Just released: Experts distill 7 elite stocks from the current list of 220 Zacks Rank #1 Strong Buys. They deem these tickers “Most Likely for Early Price Pops.”

Since 1988, the full list has beaten the market more than 2X over with an average gain of +25.4% per year. So be sure to give these hand-picked 7 your immediate attention. 

See them now >>

Want the latest recommendations from Zacks Investment Research? Today, you can download 7 Best Stocks for the Next 30 Days. Click to get this free report
 
Sixth Street Specialty Lending, Inc. (TSLX): Free Stock Analysis Report
 
Ocwen Financial Corporation (OCN): Free Stock Analysis Report
 
To read this article on Zacks.com click here.
 
Zacks Investment Research

https://www.entrepreneur.com/article/419356


MVB Financial (MVBF) Tops Q4 Earnings and Revenue Estimates

This story originally appeared on Zacks

MVB Financial (MVBF) came out with quarterly earnings of $0.77 per share, beating the Zacks Consensus Estimate of $0.25 per share. This compares to earnings of $0.97 per share a year ago. These figures are adjusted for non-recurring items.

– Zacks

This quarterly report represents an earnings surprise of 208%. A quarter ago, it was expected that this company would post earnings of $0.49 per share when it actually produced earnings of $0.92, delivering a surprise of 87.76%.

Over the last four quarters, the company has surpassed consensus EPS estimates three times.

MVB Financial, which belongs to the Zacks Financial – Miscellaneous Services industry, posted revenues of $36.05 million for the quarter ended December 2021, surpassing the Zacks Consensus Estimate by 19.75%. This compares to year-ago revenues of $34.26 million. The company has topped consensus revenue estimates three times over the last four quarters.

The sustainability of the stock’s immediate price movement based on the recently-released numbers and future earnings expectations will mostly depend on management’s commentary on the earnings call.

MVB Financial shares have lost about 5.7% since the beginning of the year versus the S&P 500’s decline of -6.1%.

What’s Next for MVB Financial?

While MVB Financial has outperformed the market so far this year, the question that comes to investors’ minds is: what’s next for the stock?

There are no easy answers to this key question, but one reliable measure that can help investors address this is the company’s earnings outlook. Not only does this include current consensus earnings expectations for the coming quarter(s), but also how these expectations have changed lately.

Empirical research shows a strong correlation between near-term stock movements and trends in earnings estimate revisions. Investors can track such revisions by themselves or rely on a tried-and-tested rating tool like the Zacks Rank, which has an impressive track record of harnessing the power of earnings estimate revisions.

Ahead of this earnings release, the estimate revisions trend for MVB Financial: mixed. While the magnitude and direction of estimate revisions could change following the company’s just-released earnings report, the current status translates into a Zacks Rank #3 (Hold) for the stock. So, the shares are expected to perform in line with the market in the near future. You can see the complete list of today’s Zacks #1 Rank (Strong Buy) stocks here.

It will be interesting to see how estimates for the coming quarters and current fiscal year change in the days ahead. The current consensus EPS estimate is $0.23 on $30.2 million in revenues for the coming quarter and $1.29 on $129.4 million in revenues for the current fiscal year.

Investors should be mindful of the fact that the outlook for the industry can have a material impact on the performance of the stock as well. In terms of the Zacks Industry Rank, Financial – Miscellaneous Services is currently in the top 26% of the 250 plus Zacks industries. Our research shows that the top 50% of the Zacks-ranked industries outperform the bottom 50% by a factor of more than 2 to 1.

Another stock from the same industry, Oportun Financial Corporation (OPRT), has yet to report results for the quarter ended December 2021. The results are expected to be released on February 24.

This company is expected to post quarterly earnings of $0.71 per share in its upcoming report, which represents a year-over-year change of +18.3%. The consensus EPS estimate for the quarter has remained unchanged over the last 30 days.

Oportun Financial Corporation’s revenues are expected to be $185.48 million, up 31.7% from the year-ago quarter.

7 Best Stocks for the Next 30 Days

Just released: Experts distill 7 elite stocks from the current list of 220 Zacks Rank #1 Strong Buys. They deem these tickers “Most Likely for Early Price Pops.”

Since 1988, the full list has beaten the market more than 2X over with an average gain of +25.4% per year. So be sure to give these hand-picked 7 your immediate attention. 

See them now >>

Want the latest recommendations from Zacks Investment Research? Today, you can download 7 Best Stocks for the Next 30 Days. Click to get this free report
 
Mvb Financial Corp. (MVBF): Free Stock Analysis Report
 
Oportun Financial Corporation (OPRT): Free Stock Analysis Report
 
To read this article on Zacks.com click here.
 
Zacks Investment Research

https://www.entrepreneur.com/article/419357


AptarGroup (ATR) Tops Q4 Earnings and Revenue Estimates

This story originally appeared on Zacks

AptarGroup (ATR) came out with quarterly earnings of $0.93 per share, beating the Zacks Consensus Estimate of $0.92 per share. This compares to earnings of $0.92 per share a year ago. These figures are adjusted for non-recurring items.

– Zacks

This quarterly report represents an earnings surprise of 1.09%. A quarter ago, it was expected that this maker of consumer-product dispensing systems would post earnings of $0.94 per share when it actually produced earnings of $0.94, delivering no surprise.

Over the last four quarters, the company has surpassed consensus EPS estimates two times.

AptarGroup, which belongs to the Zacks Containers – Paper and Packaging industry, posted revenues of $813.99 million for the quarter ended December 2021, surpassing the Zacks Consensus Estimate by 1.93%. This compares to year-ago revenues of $749.33 million. The company has topped consensus revenue estimates three times over the last four quarters.

The sustainability of the stock’s immediate price movement based on the recently-released numbers and future earnings expectations will mostly depend on management’s commentary on the earnings call.

AptarGroup shares have lost about 6.4% since the beginning of the year versus the S&P 500’s decline of -6.1%.

What’s Next for AptarGroup?

While AptarGroup has underperformed the market so far this year, the question that comes to investors’ minds is: what’s next for the stock?

There are no easy answers to this key question, but one reliable measure that can help investors address this is the company’s earnings outlook. Not only does this include current consensus earnings expectations for the coming quarter(s), but also how these expectations have changed lately.

Empirical research shows a strong correlation between near-term stock movements and trends in earnings estimate revisions. Investors can track such revisions by themselves or rely on a tried-and-tested rating tool like the Zacks Rank, which has an impressive track record of harnessing the power of earnings estimate revisions.

Ahead of this earnings release, the estimate revisions trend for AptarGroup: unfavorable. While the magnitude and direction of estimate revisions could change following the company’s just-released earnings report, the current status translates into a Zacks Rank #4 (Sell) for the stock. So, the shares are expected to underperform the market in the near future. You can see the complete list of today’s Zacks #1 Rank (Strong Buy) stocks here.

It will be interesting to see how estimates for the coming quarters and current fiscal year change in the days ahead. The current consensus EPS estimate is $0.98 on $785.89 million in revenues for the coming quarter and $4.10 on $3.32 billion in revenues for the current fiscal year.

Investors should be mindful of the fact that the outlook for the industry can have a material impact on the performance of the stock as well. In terms of the Zacks Industry Rank, Containers – Paper and Packaging is currently in the top 17% of the 250 plus Zacks industries. Our research shows that the top 50% of the Zacks-ranked industries outperform the bottom 50% by a factor of more than 2 to 1.

Another stock from the broader Zacks Industrial Products sector, Chart Industries (GTLS), has yet to report results for the quarter ended December 2021. The results are expected to be released on February 24.

This equipment maker for the energy sector is expected to post quarterly earnings of $0.67 per share in its upcoming report, which represents a year-over-year change of -47.2%. The consensus EPS estimate for the quarter has been revised 2% higher over the last 30 days to the current level.

Chart Industries’ revenues are expected to be $375.03 million, up 20.1% from the year-ago quarter.

7 Best Stocks for the Next 30 Days

Just released: Experts distill 7 elite stocks from the current list of 220 Zacks Rank #1 Strong Buys. They deem these tickers “Most Likely for Early Price Pops.”

Since 1988, the full list has beaten the market more than 2X over with an average gain of +25.4% per year. So be sure to give these hand-picked 7 your immediate attention. 

See them now >>

Want the latest recommendations from Zacks Investment Research? Today, you can download 7 Best Stocks for the Next 30 Days. Click to get this free report
 
AptarGroup, Inc. (ATR): Free Stock Analysis Report
 
Chart Industries, Inc. (GTLS): Free Stock Analysis Report
 
To read this article on Zacks.com click here.
 
Zacks Investment Research

https://www.entrepreneur.com/article/419359