Quality Stocks In…Garbage Stocks Out!
Stocks keep flirting with the all time highs for the S&P 500 (SPY) and keep falling short. Meaning this is proving to be a stubborn level of resistance at 4,800. Why is that happening? And when will stocks finally break above? 43 year investment veteran Steve Reitmeister shares his view including a preview of his favorite stock picks now. Read on below for the answers.
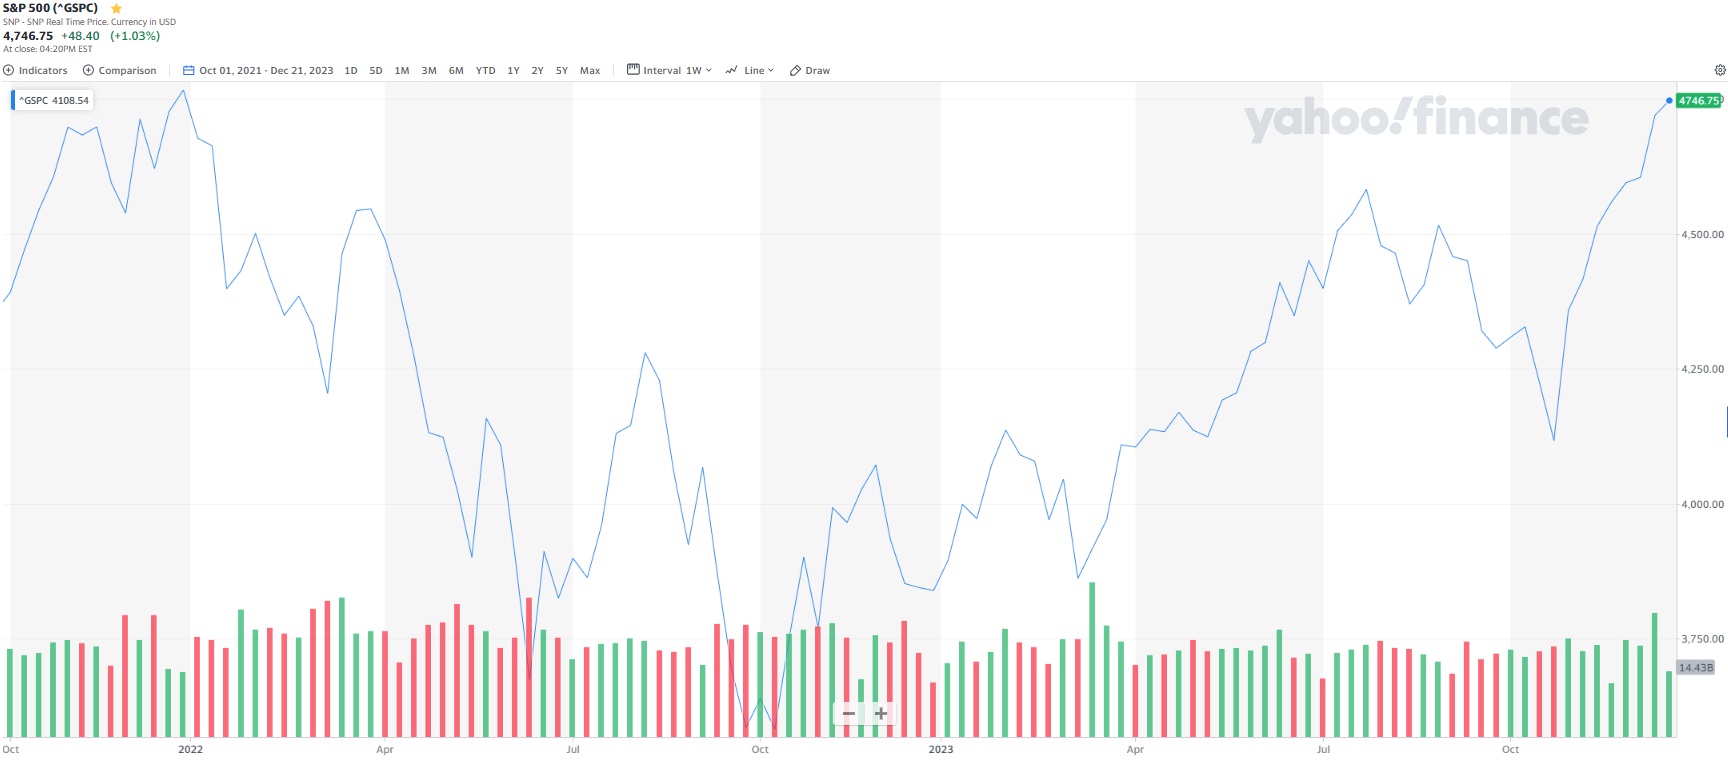
As suspected, the market is not ready to make new highs above 4,796 for the S&P 500 (SPY).
That was quite evident Thursday as stocks jumped out of bed in the morning to touch those previous highs only to find stubborn resistance with the broad market heading lower from there.
Why are stocks struggling at this level?
And what is an investor to do about it?
The answers to those vital questions will be at the heart of today’s commentary.
Market Commentary
Some investment writers will have a fairly short hand, and highly inaccurate, way to describe what happened on Thursday.
They will tell you that the CPI inflation reading was hotter than expected on Thursday morning. And that caused the stock market sell off that followed.
That is simply not true.
Here is what really happened. The CPI report came out an hour before the market open. And yet still the market leapt higher out of the gate. But once it touched the hem of the previous highs (4,796) a more than 1% intraday sell off that ensued.
That pain is not so evident in the late session bounce and modest loss for S&P 500. Yet is a lot more apparent in the -0.7% showing for the small caps in the Russell 2000 on the session.
Thus, the problem for lack of further stock advance is not about CPI report. Just a statement that investors are not prepared to breakthrough resistance to make new highs.
So, what is holding stocks back?
I discussed that in greater detail in my last commentary: When Will the Bull Market Run Again?
The essence of the story is that investors have less clarity on the next moves for the Fed than they had after the November and December meetings that sparked a tremendous end of year rally. Unfortunately, there has been a mixed bag of inflation and economic data that calls into question when rate cuts will begin.
At the earliest those cuts could come at the March 20th meeting. But I sense that the more readings we get like Thursday’s CPI report, or last Fridays stronger than expected employment report…the more likely those first cuts get pushed off to either the May 1st or June 12th Fed meetings.
Digging into the CPI reading we find that inflation was expected to come in at 3.1% yet spiked to 3.4% on this reading. Core CPI was even worse at 3.9% year over year. Just still too far away from the Fed’s target of 2%.
For the “wonks” out there you should dig into the Sticky Price resources created by the Atlanta Fed. To put it plainly, sticky inflation remains too sticky. The main elements are housing and wages that are not coming down as quickly as expected.
When you appreciate the conservative nature of the Fed…and that they state over and over again that they are “data dependent”, then its hard to look at the recent data and assume they are ready to lower rates any time soon.
Long story short, I don’t think that investors are ready for the next bull run to make new highs until they are more certain WHEN the Fed will finally start cutting rates. That delays the next upside move to March 20th at the earliest with May or June becoming all the more likely.
Hard to complain about settling into a trading range for a while given the tremendous pace of gains to end 2023. So this seems like a reasonable time for stocks to rest before making the next big move.
The upside of the current range connects with the aforementioned all time high of 4,796…but really easier to think of the lid as 4,800.
On the downside, that is a bit harder to infer. Typically trading ranges are 3-5% from top to bottom. So, for quick math let’s say around 4,600 on the bottom. This also represents the previous resistance point that took a long time to finally break above in early December.
The good news is that I expect quality stocks to prevail even in a range bound market. Meaning that last year pretty much any piece of beaten down junk was bid higher. That party is OVER!
Instead, when you have a pretty fully valued market as we have now, then there will be a greater eye towards quality of fundamentals and value proposition. I spelled that out pretty completely in last week’s article: Is 2024 Prime Time for Value Stocks?
The answer to the question posed in the headline is…YES. Meaning that 2024 is lining up nicely for value stocks.
Case in point being the early results this year with our Top 10 Value strategy up +3.70% through Wednesday’s close vs. breakeven for S&P 500 and -2.80% for the small caps in the Russell 2000.
I strongly believe that edge for value will continue as the year rolls on. And the best way to take advantage of that is spelled out in the next section…
What To Do Next?
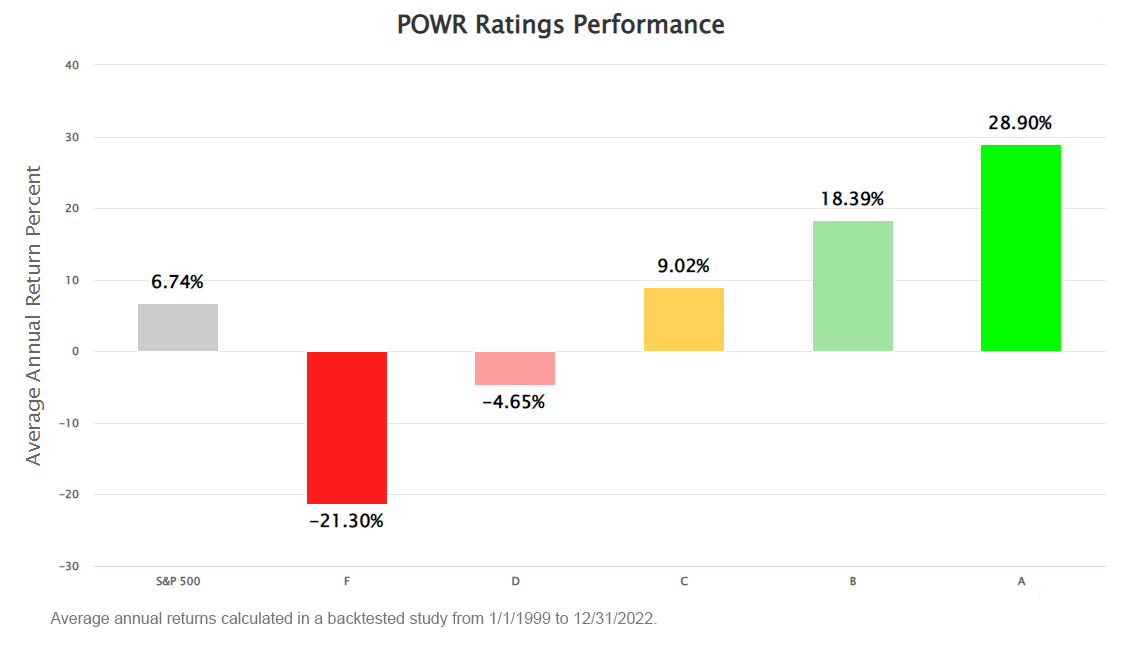
Discover my current portfolio of value stocks packed to the brim with the outperforming benefits found in our exclusive POWR Ratings model.
This includes direct access to our Top 10 Value Stocks strategy that is hot out of the gates in 2024 with plenty more room to run.
If you are curious to learn more, and want to lean into my 43 years of investment experience, then please click the link below to get started now.
Steve Reitmeister’s Trading Plan & Top Picks >
Wishing you a world of investment success!

Steve Reitmeister…but everyone calls me Reity (pronounced “Righty”)
CEO, StockNews.com and Editor, Reitmeister Total Return
SPY shares were trading at $475.88 per share on Friday afternoon, down $0.47 (-0.10%). Year-to-date, SPY has gained 0.12%, versus a % rise in the benchmark S&P 500 index during the same period.
About the Author: Steve Reitmeister

Steve is better known to the StockNews audience as “Reity”. Not only is he the CEO of the firm, but he also shares his 40 years of investment experience in the Reitmeister Total Return portfolio. Learn more about Reity’s background, along with links to his most recent articles and stock picks.
The post Quality Stocks In…Garbage Stocks Out! appeared first on StockNews.com
https://www.entrepreneur.com/finance/quality-stocks-ingarbage-stocks-out/468307