First Solar (FSLR) closed the most recent trading day at $68.23, moving -1.56% from the previous trading session. This change lagged the S&P 500’s 0.38% loss on the day. Meanwhile, the Dow lost 0.5%, and the Nasdaq, a tech-heavy index, lost 0.05%.
– Zacks
Heading into today, shares of the largest U.S. solar company had lost 16.51% over the past month, lagging the Oils-Energy sector’s gain of 8.31% and the S&P 500’s loss of 6.25% in that time.
Investors will be hoping for strength from First Solar as it approaches its next earnings release. On that day, First Solar is projected to report earnings of $1.07 per share, which would represent a year-over-year decline of 0.93%. Meanwhile, our latest consensus estimate is calling for revenue of $918.43 million, up 50.75% from the prior-year quarter.
Any recent changes to analyst estimates for First Solar should also be noted by investors. These recent revisions tend to reflect the evolving nature of short-term business trends. With this in mind, we can consider positive estimate revisions a sign of optimism about the company’s business outlook.
Our research shows that these estimate changes are directly correlated with near-term stock prices. We developed the Zacks Rank to capitalize on this phenomenon. Our system takes these estimate changes into account and delivers a clear, actionable rating model.
The Zacks Rank system, which ranges from #1 (Strong Buy) to #5 (Strong Sell), has an impressive outside-audited track record of outperformance, with #1 stocks generating an average annual return of +25% since 1988. Over the past month, the Zacks Consensus EPS estimate has moved 6.23% lower. First Solar is currently a Zacks Rank #5 (Strong Sell).
Valuation is also important, so investors should note that First Solar has a Forward P/E ratio of 35.4 right now. For comparison, its industry has an average Forward P/E of 31.88, which means First Solar is trading at a premium to the group.
It is also worth noting that FSLR currently has a PEG ratio of 4.81. The PEG ratio is similar to the widely-used P/E ratio, but this metric also takes the company’s expected earnings growth rate into account. Solar stocks are, on average, holding a PEG ratio of 1.74 based on yesterday’s closing prices.
The Solar industry is part of the Oils-Energy sector. This industry currently has a Zacks Industry Rank of 216, which puts it in the bottom 16% of all 250+ industries.
The Zacks Industry Rank gauges the strength of our individual industry groups by measuring the average Zacks Rank of the individual stocks within the groups. Our research shows that the top 50% rated industries outperform the bottom half by a factor of 2 to 1.
You can find more information on all of these metrics, and much more, on Zacks.com.
Just Released: Zacks Top 10 Stocks for 2022
In addition to the investment ideas discussed above, would you like to know about our 10 top buy-and-hold tickers for the entirety of 2022?
Last year’s 2021 Zacks Top 10 Stocks portfolio returned gains as high as +147.7%. Now a brand-new portfolio has been handpicked from over 4,000 companies covered by the Zacks Rank. Don’t miss your chance to get in on these long-term buys
Want the latest recommendations from Zacks Investment Research? Today, you can download 7 Best Stocks for the Next 30 Days. Click to get this free report
Why Investors Are Watching These Penny Stocks Right Now
Right now, penny stocks and blue chips are wildly popular for all types of investors. Although the stock market has been highly volatile over the past few months, there are still plenty of opportunities to make money with penny stocks.
PennyStocks.com – PennyStocks
As a result, now is the time to find the best penny stocks to buy. And while it can seem challenging, with the correct information and strategy by your side, it can be much easier than previously imagined. So, as we delve deeper into February, let’s take a look at five must-watch penny stocks for your list.
The month of February has been a big one for MannKind Corp. Shares of the inhaled therapeutics development company have only closed red 2 of the nine total trading days of the month. MannKind is commercializing Afrezza, which is its first FDA-approved product. Afrezza is an inhaled rapid-acting mealtime insulin and is available by prescription in the U.S.
One of the more recent catalysts for MNKD stock is that it’s one of the penny stocks with insider buying this quarter. Officers and Directors bought thousands of shares before the books officially closed in January. This was also just before MannKind was granted a new U.S. Patent, #11,241,549, titled “Dry powder inhaler and system for drug delivery.”
Heading into the week, if MNKD stock is on your list, keep Thursday in mind. On February 17, CEO Michael Castagna PharmD participates in the SVB Leerink Global Healthcare Conference.
2. TC Biopharma Holdings Ltd. (NASDAQ: TCBP)
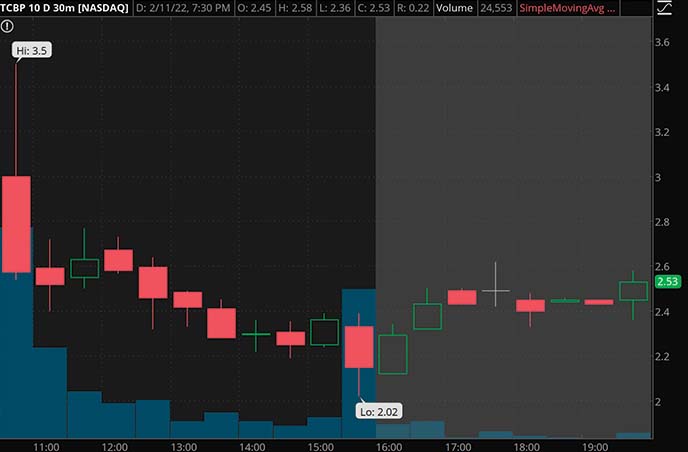
Shares of newly public biotech company TC Biopharma had a lackluster debut last week. However, heading into Valentine’s Day week, it could remain on the radar. The company’s efforts in T cell therapies have gained it some attention. In particular, TC’s treatments using gamma-delta T cells target indications for acute myeloid leukemia. The company is currently undertaking two clinical trials for its platform, including a Phase 2b/3 trial for OmnImmune (TCB 008-001) in AML and a Phase 1 trial for ImmuniStim (TCB 008-002) in Covid patients.
Despite the flopped IPO debut, TCBP stock seems to have caught the attention of traders hunting for low float penny stocks. Initially, the company offered fewer than 5 million shares with warrants for purchasing up to 8.2 million shares. By all accounts, even with the warrants, TCBP meets the definition of a low float stock. These have become well-known for volatile moves in the market under certain circumstances.
Furthermore, since the offering is expected to close by February 15th. If TCBP stock is on your watch list for this week, it may be important to keep Tuesday’s date in mind.
3. Ambev ADR (NYSE: ABEV)
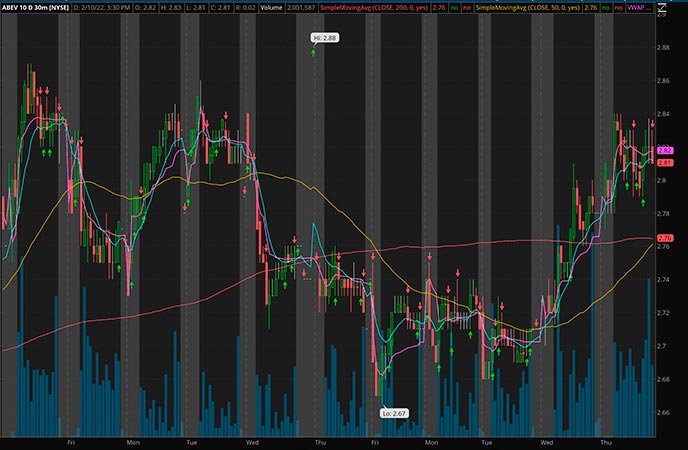
Ambev ADR is a penny stock that we have covered extensively over the past few months. And in that time, we’ve begun to see a slight bullish turnaround for the company. With a 1.2% gain on February 10th and a one-month gain of almost 10%, it’s clear investors are interested in the company right now.
It is tough to say whether or not ABEV stock is worth it as the company has not rereleased any information in the past few months. However, we can look at some recent metrics to see whether ABEV stock is worth watching. Before going any further, it’s worth discussing what Ambev does.
Through its various subsidiaries, Ambev produces both alcoholic and non-alcoholic beverages. This includes beer, malt, and some food products as well. While you may not have heard of Ambev, you’ve likely heard of some of its brands. This includes Budweiser, Extra, Lipton Iced Tea, Pepsi-Cola, and much more. As a result of the sheer popularity of the brands that Ambev represents, it has seen significant sales in the past few years.
Now, Covid has had a sizable impact on Ambev at large during that time. It’s worth noting that in both times of economic prosperity and turmoil, we tend to see high sales of alcohol. This has benefitted Ambev, but we’ve also seen production and distribution issues resulting from Covid disruptions. So, with all of this in mind, does ABEV stock belong on your list of penny stocks to watch or not?
4. Southwestern Energy Company (NYSE: SWN)
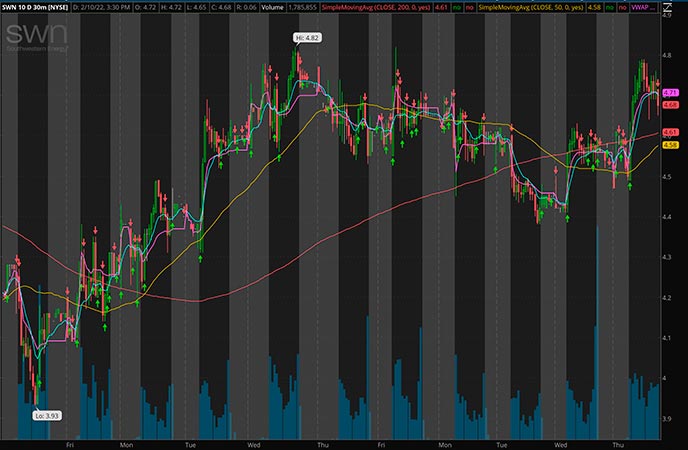
Southwestern Energy is another penny stock that we have discussed quite frequently in the past few months. And with a five-day gain of more than 3%, many investors are watching SWN stock right now. While this may not seem like a lot, it is substantial considering the broader losses we’ve witnessed across the market.
There are a few reasons why SWN stock may be growing right now. The most obvious has to do with the company’s announcement on February 8th. On the 8th, it stated that it had expanded its RSG well certification monitoring program. Now, it will include its newly acquired Haynesville position and its other programs.
“Southwestern Energy’s commitment to obtain third-party certification for our entire portfolio across Appalachia and Haynesville allows our stakeholders to receive independent verification that all of SWN’s production meets and exceeds the highest and most rigorous RSG standards.
The ability to monitor emissions from our operations at the pad level is a clear differentiator and will allow SWN to efficiently and effectively reduce emissions.”
The CEO of Southwestern Energy Company, Bill Way
This is exciting news for the company and shows just how quickly it is growing and its commitment to innovation. With prominent bullish sentiment surrounding the energy industry right now, it’s clear that SWN stock could be worth keeping an eye on. So, whether it deserves a spot on your penny stocks watchlist or not is up to you.
5. New Gold Inc. (NYSE: NGD)
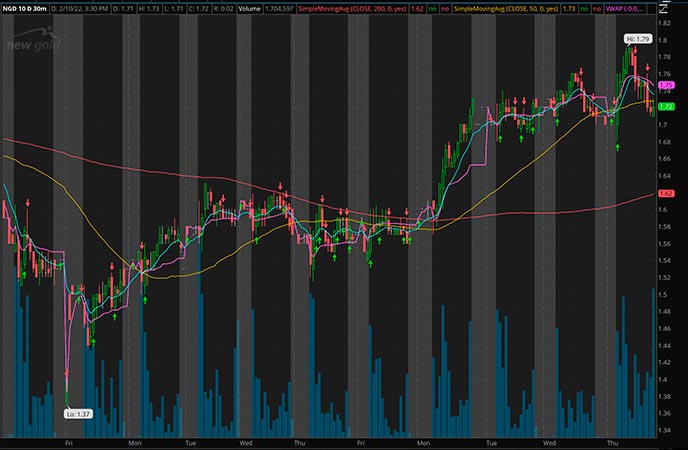
New Gold Inc. is another penny stock gaining momentum over the past few trading sessions. And with heightened volume and a booming gold market, there is a lot to consider with NGD stock. Before we get any further into it, it’s worth looking at what New Gold Inc. does. As its name suggests, New Gold Inc. is a producer of gold ore. In addition to this, the company produces copper and several other precious metals. Its assets are based in Canada, where it has the Rainy River gold mine and the New Afton copper-gold mine.
These investments have helped diversify the company’s holdings in the past few years and present investors with an interesting opportunity. The most recent news from New Gold Inc. came on January 12th. On the 12th, it announced updated gold production guidance alongside the data of its Q4 financial result release and operational outlook. The report states that it will be presenting these results on February 23rd at 8:30 AM EST.
“2021 was not without its challenges for New Gold, but we continued to execute on our plans, with the fourth quarter representing our strongest quarter of the year, allowing us to meet our updated consolidated gold equivalent production guidance.”
The CEO of New Gold, Renaud Adams
So, with all of this exciting news in mind, does NGD deserve a spot on your penny stocks watchlist?
Can Penny Stocks Continue to See Bullish Momentum?
With so many penny stocks to choose from, it can seem like a daunting task to pick just a handful for your watchlist. However, because there are many penny stocks to buy, making money with small caps can be entirely possible.
This means using things like news to your advantage and having a consistent trading strategy. These two things will give you the greatest chance of profitability when trading penny stocks. So, with all of that in mind, do you think that penny stocks can continue to see bullish momentum or not?
If you enjoyed this article and you’re interested in learning how to trade so you can have the best chance to profit consistently then you need to checkout this YouTube channel. CLICK HERE RIGHT NOW!!
https://www.entrepreneur.com/article/418391
How To Make Good Money Picking Bad Stocks
Using puts to profit from a plunge in a lower cost lower risk manner.
shutterstock.com – StockNews
All of us are likely very familiar with the never-ending hunt trying to pick what stock will be the next Amazon, Tesla or Apple. But not nearly as many are familiar with trying to find which stock will be the next bad apple.
The old market adage says that stocks go up the escalator and down the elevator. This means that rises in equity prices tend to be slow and steady while drops tend to be swift and violent. Certainly, the price action witnessed in January will attest to that.
2022 may finally be the year that stock gains start to flatten out, especially given the big gains seen over the past few years. The tide that lifted all ships-the Federal Reserve-is set on raising rates and removing liquidity for the foreseeable future. This will be a decided headwind for stocks.
This doesn’t mean that all stocks will go nowhere in 2022. Quite the contrary. In every market there are big winners and big losers. It just means that now you need to really do some deeper digging to uncover those hidden gems-and sift out the fool’s gold.
You can try to do the all the number crunching and hard work yourself. Or you can do what I do and have all the work done for me by using the POWR ratings. It is a time-tested and more importantly battle tested way to find the future big winners and big losers alike.
The historic performance of the POWR ratings versus the S&P 500 since 1999 is shown below.
If you do the math, the A rated Strong Buy stocks outperformed the S&P 500 by an astounding 23.12% since 1999. The F rated Strong Sell stocks underperformed by an even greater degree, dropping 26.94% compared to the S&P 500. This means the power of POWR stocks is even more powerful in picking bad stocks.
Instead of shorting stocks to profit from a drop, POWR Options uses the ratings but buys puts instead. This lower risk, higher potential profit approach reduces the angst and eliminates the higher margin requirements needed for shorting a stock.
A recent look at our latest trade in Royal Carribean Cruises (RCL) on February 10 may shed some light.
RCL is an F rated Strong Sell stock in an F rated Industry. It had rallied sharply off the recent lows but was approaching resistance at $90. Shares were overbought on a technical basis. RCL had just reported earnings that missed on both the top and bottom line-yet the stock moved higher.
Implied volatility (IV) was cheap at only the 19th percentile following earnings. This set up ideally for a bearish put trade.
POWR Options recommended buying the June $80 puts for $4.00 per contract-or $400 per option. Our bearish expectations were immediately realized the following day as RCL dropped 4.41% from $88.05 on Thursday’s close to $83.96 on Friday.
The June $80 puts were closed out at $5.00 on Friday for a nice one-day gain of 25%-or over 5 times more than stock drop of 4.41%. This highlights the leverage effect that options can provide to propel profits much higher than stocks.
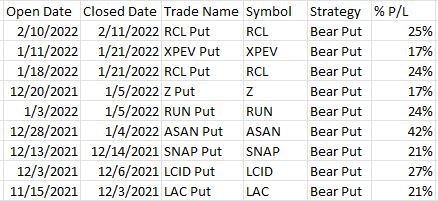
Of course, not every trade works out this quickly, or this well. But since the POWR Options program began last November, there have been a total of nine bearish put trades. All nine of these trades were closed out for a gain. The results are shown below.
The average holding period was just under 7 days with an average gain of 24.1%. Not bad for a week’s work. Plus, each trade could have been done with an average cost of just under $550. Perfect for smaller accounts or as a performance booster for larger accounts.
Combining bearish positions along with bullish trades is even more critical now that stocks seem to have finally found some resistance. Higher interest rates along with historically stretched valuations make it more of a stock pickers market. Using the POWR ratings to uncover these winners and losers and POWR Options to lower the risk and increase the potential return is more vital now than ever.
POWR Options
What To Do Next?
If you’re looking for the best options trades for today’s market, you should check out our latest presentation How to Trade Options with the POWR Ratings. Here we show you how to consistently find the top options trades, while minimizing risk.
If that appeals to you, and you want to learn more about this powerful new options strategy, then click below to get access to this timely investment presentation now:
RCL shares closed at $83.96 on Friday, down $-3.87 (-4.41%). Year-to-date, RCL has gained 9.18%, versus a -7.26% rise in the benchmark S&P 500 index during the same period.
About the Author: Tim Biggam
Tim spent 13 years as Chief Options Strategist at Man Securities in Chicago, 4 years as Lead Options Strategist at ThinkorSwim and 3 years as a Market Maker for First Options in Chicago. He makes regular appearances on Bloomberg TV and is a weekly contributor to the TD Ameritrade Network “Morning Trade Live”. His overriding passion is to make the complex world of options more understandable and therefore more useful to the everyday trader. Tim is the editor of the POWR Options newsletter. Learn more about Tim’s background, along with links to his most recent articles.
Did you do a double take on today’s headline – “Sell the Rumor, Buy the News”? Yes, it is the inverse of the standard investor wisdom to buy the rumor, and sell the news. But in this case, with the growing concern of Russia invading the Ukraine investors are pressing the sell button once again. However, as I will share in detail below, that is a poor idea because war is not actually a negative for the economy and the S&P 500 (SPY). More on that and other timely investment matters will be discussed in this week’s POWR Value commentary. Read on below….
shutterstock.com – StockNews
(Please enjoy this updated version of my weekly commentary published February 11th, 2022 from the POWR Value newsletter).
Let’s get right to it.
The stock market was rebounding from the January correction thanks to improving economic conditions. This was corroborated by yet another solid earnings season
Then investors started to wet the bed Friday on increased concerns that Russia could invade the Ukraine at any moment. This led to a spate of Risk Off trades:
Falling stock market Flight to Safety in bonds Gold on the rise too
The one oddity versus typical Risk Off activity is that oil was also on the rise.
But that comes from the idea that any military actions or sanctions on Russia would come with oil supply problems that would push prices higher.
Gladly we have 2 oil positions in the portfolio and both doing very well today (+3.53% and +5.23% respectively).
Now the reality check.
There is not much “there, there” when it comes to the markets suffering during times of potentially new military conflicts.
After initial pullbacks from the shock of the event, stocks come roaring back to life.
And that’s mostly because the markets move on economic conditions and wars = higher spending = higher economic activity.
Of course I am not pro war. I am just pro FACTS. And making decisions off those facts to put ourselves in the best possible position to benefit.
Those FACTS (as you will see in this article) point to not selling at this time and expecting a bounce soon even if a conflict erupts between Russia and Ukraine.
In the meantime expect volatility to be the norm (which we were getting used to already).
What To Do Next?
If you’d like to see more top value stocks, then you should check out our free special report:
What makes these stocks great additions to any portfolio?
First, because they are all undervalued companies with exciting upside potential.
But even more important, is that they are all A rated Strong Buys according to our coveted POWR Ratings system. Yes, that same system where top-rated stocks have averaged a +31.10% annual return.
Click below now to see these 7 stellar value stocks with the right stuff to outperform in the coming months.
SPY shares closed at $440.46 on Friday, down $-8.86 (-1.97%). Year-to-date, SPY has declined -7.26%, versus a % rise in the benchmark S&P 500 index during the same period.
About the Author: Steve Reitmeister
Steve is better known to the StockNews audience as “Reity”. Not only is he the CEO of the firm, but he also shares his 40 years of investment experience in the Reitmeister Total Return portfolio. Learn more about Reity’s background, along with links to his most recent articles and stock picks.
The latest January inflation data release might hamstring the tech industry for a period. However, the smart cloud segment is expected to maintain some stability due to strong demand, popular support, and marketable innovations. So, we think it could be wise to buy the dip in the quality smart cloud stocks Akamai Technologies (AKAM) and Dropbox (DBX). read on.
shutterstock.com – StockNews
Following the recent release of the historically high inflation data, the Fed is expected to hike interest rates aggressively this year, which is expected to impact the tech industry adversely. According to the chief global economist of Citi Research, Nathan Sheets, the latest U.S. January inflation data is like a “punch in the stomach” for the Federal Reserve. However, due to rising demand, the global smart cloud segment is expected to withstand the squall amid rapid digitization in a highly data-driven world.
Certain smart cloud companies with robust financials are consistently developing their products and services, offering immense convenience to a plethora of users worldwide in remote work environments. In addition, according to Grand View Research, the global cloud computing market is slatedto grow at a 15.7% CAGR through 2030.
So, we believe fundamentally sound smart cloud stocks Akamai Technologies, Inc. (AKAM) and Dropbox, Inc. (DBX), which are trading below their 52-week highs, could be solid additions to one’s portfolio now.
AKAM in Cambridge, Mass., provides cloud services for securing, delivering, and optimizing content and business applications over the internet in the United States and internationally. AKAM has the world’s largest and most trusted edge platform.
On Oct. 21, 2021, AKAM announced the complete acquisition of Guardicore of Tel Aviv, Israel. This is expected to enhance AKAM’s existing product portfolio and thereby improve its financials.
AKAM’s revenue increased 8.5% year-over-year to $860.33 million for the third quarter, ended Sept. 30, 2021. Its non-GAAP net income came in at $238.94 million, up 10.7% year-over-year, while its non-GAAP EPS also increased 10.7% year-over-year to $1.45.
Analysts expect AKAM’s revenue and EPS to increase 8.5% and 4.6%, respectively, year-over-year to $3.75 billion and $5.93 in its fiscal 2022. In addition, it has surpassed the consensus EPS estimates in each of the trailing four quarters. Its shares have gained 7.4% in price over the past year to close yesterday’s trading session at $112.84. The stock is currently trading 6.5% below its 52-week high of $120.68, which it hit on July 30, 2021.
AKAM’s strong fundamentals are reflected in its POWR Ratings. The stock has an overall B rating, which indicates a Buy in our proprietary rating system. The POWR Ratings assess stocks by 118 distinct factors, each with its own weighting.
AKAM has a B grade for Growth, Value, and Quality. In the Technology – Services industry, it is ranked #7 of 81 stocks. Click here to see the additional POWR Ratings for Momentum, Sentiment, and Stability for AKAM.
DBX San Francisco provides a collaboration platform worldwide. The company’s solutions include Dropbox paper and doc scanners. With more than 700 million registered users across 180 countries, it aims to design a more enlightened way of working.
On Nov. 4, 2021, DBX’s co-founder and CEO, Drew Houston, said, “Q3 was another solid quarter with record free cash flow, strong revenue growth, and great progress against our strategic objectives as we focus on delivering more value to our customers and shareholders. We shipped several new product experiences to help our customers with today’s challenges of distributed and remote work, and I’m confident in our future as we work toward our vision of building one organized place for content and all the workflows around it.”
For its fiscal third quarter, ended Sept. 30, 2021, DBX’s revenue increased 12.9% year-over-year to $550.20 million. The company’s non-GAAP net income increased 33.5% year-over-year to $147.10 million. Also, its non-GAAP EPS came in at $0.37, up 42.3% year-over-year.
DBX’s revenue is expected to be $2.36 billion in fiscal 2022, representing a 9.8% year-over-year rise. The company’s EPS is expected to increase 16.8% per annum for the next five years. Also, it surpassed the Street’s EPS estimates in each of the trailing four quarters. Over the past year, the stock has gained 5.2% in price to close yesterday’s trading session at $25.16. It is currently trading 23.8% below its 52-week high of $33.00, which it hit on August 6, 2021.
DBX’s strong fundamentals are reflected in its POWR Ratings system. The stock has an overall B rating, which indicates a Buy in our proprietary rating system.
In addition, it has an A grade for Quality and a B grade for Growth. DBX is ranked #11 in theTechnology – Services industry. Click here to see the additional POWR Ratings for DBX (Value, Momentum, Stability, and Sentiment)
AKAM shares were trading at $111.13 per share on Friday afternoon, down $1.71 (-1.52%). Year-to-date, AKAM has declined -5.05%, versus a -7.22% rise in the benchmark S&P 500 index during the same period.
About the Author: Riddhima Chakraborty
Riddhima is a financial journalist with a passion for analyzing financial instruments. With a master’s degree in economics, she helps investors make informed investment decisions through her insightful commentaries.
Fidelity (FIS) to Report Q4 Earnings: What’s in the Cards?
Fidelity National Information ServicesFIS is scheduled to release fourth-quarter and 2021 earnings on Feb 15, before the opening bell. FIS’s revenues and earnings are anticipated to indicate growth from the year-ago reported figure.
– Zacks
In the last reported quarter, Fidelity’s earnings surpassed the Zacks Consensus Estimate. Notable increases in margin and organic revenue growth were tailwinds. However, a rising expense base posed a major drag.
Fidelity delivered earnings surprises in all of the trailing four quarters, the average beat being 3.68%.
Prior to the fourth-quarter earnings release, Fidelity is witnessing a downward estimate revision, indicating analysts’ bearish sentiments. The Zacks Consensus Estimate for the fourth-quarter earnings has been revised 1.1% downward to $1.89 over the past month. Nonetheless, the figure suggests growth of 16.7% from the prior-year quarter’s reported number. Also, the Zacks Consensus Estimate for revenues of $3.71 billion indicates an 11.8% jump from the year-earlier period’s reading.
Key Development During the Quarter
In November 2021, Fidelity announced an updated capital-deployment strategy that highlighted its priority in investing in the business to steer growth as well as return capital to its shareholders. It announced plans to target high-growth assets and innovative solutions across core markets and maintain ample financial capacity for inorganic moves in the long term.
Fidelity intends to boost its expected annual dividend growth rate to 20% per year, resulting in an incremental dividend payment of nearly $100 million in 2022. This amplified dividend growth rate will support FIS to gradually accelerate its dividend payout ratio to nearly 35% of adjusted net earnings over several years from nearly 25% in 2021.
Factors to Note
Fidelity is expected to have continued benefiting from the digital transformation in the global economy as well as the increasing investments in mobile banking, innovative products and the financial infrastructure during the fourth quarter.
FIS’ several payment solution platforms, including Modern Banking Platform, RealNet and Payments One, have been winning new clients for a while and are likely to have supported its Banking Solutions unit revenues. The Zacks Consensus Estimate for fourth-quarter revenues from this unit is $1.67 billion, suggesting a 7.9% rise from the prior-year quarter’s reported figure.
Although the pandemic is expected to have impacted travel trends, cross-border travel is likely to have rebounded comparatively, following the relaxation of previous restrictions in several countries. Demand for Fidelity’s e-commerce payment gateway and the new payments platform is anticipated to have shot up. This, along with several other products and services that Fidelity offers to merchants internationally, is expected to have boosted revenue growth.
The consensus mark for Merchant Solutions unit’s revenues of $1.25 billion suggests a jump of 24% from the figure reported in the year-ago quarter.
Moreover, Fidelity had closed the deal to acquire Worldpay, a leading payment processing company, in 2019. The deal has been creating significant cost and revenue synergies for FIS. As of the third-quarter end, FIS had already achieved revenue synergies worth $600 million and cost synergies of approximately $875 million on an annual run-rate basis. Fidelity is expected to have continued realizing these synergies in the fourth quarter as well, given its target to realize aggregate $700 million of annual run-rate revenue synergy and $900 million of annual run-rate expense synergy by 2021 end.
However, Fidelity’s focus on rolling out innovative products to meet customers’ rising demand might have inflated expenses during the quarter under review.
2021 Management Guidance
Management expects GAAP revenues between $13.9 billion and $14 billion. Organic revenues are expected to increase 10-11%.
Fidelity expects earnings per share (EPS) on a GAAP basis to be 70-80 cents. Adjusted EPS is expected to be $6.50-$6.60, indicating growth of 19-21% from the year-ago reported figure.
Adjusted earnings before interest, taxes, depreciation and amortization (EBITDA) are projected in the range of $6.13-$6.2 billion. Adjusted EBITDA margin is expected to expand 220-240 basis points to 44-45% in 2021.
The Merchant solutions unit is expected to witness mid-to-high-teen organic revenue growth from the 2019 reported figure on a pro-forma basis.
What the Zacks Model Predicts
Our quantitative model predicts an earnings beat for Fidelity this time around. The combination of the two key ingredients — a positive Earnings ESP and a Zacks Rank #3 (Hold) or higher — increases the odds of an earnings beat, which is just the case here.
You can uncover the best stocks to buy or sell before they’re reported with our Earnings ESP Filter.
Earnings ESP: Fidelity has an Earnings ESP of +0.62%.
Zacks Rank: Fidelity currently carries a Zacks Rank of 3.
Other Stocks to Consider
Some other finance stocks worth considering with the right combination of elements to beat on earnings in their upcoming releases per our model are BanColombiaCIB, HSBC Holdings plcHSBC and NatWest GroupNWG.
BanColombia has an Earnings ESP of +5.56% and a Zacks Rank #2 (Buy) at present. CIB is scheduled to report quarterly numbers on Feb 23.
In addition to the investment ideas discussed above, would you like to know about our 10 top picks for the entirety of 2022?
From inception in 2012 through 2021, the Zacks Top 10 Stocks portfolios gained an impressive +1,001.2% versus the S&P 500’s +348.7%. Now our Director of Research has combed through 4,000 companies covered by the Zacks Rank and has handpicked the best 10 tickers to buy and hold. Don’t miss your chance to get in…because the sooner you do, the more upside you stand to grab.
Want the latest recommendations from Zacks Investment Research? Today, you can download 7 Best Stocks for the Next 30 Days. Click to get this free report
Itau Unibanco (ITUB) Q4 Earnings and Revenues Climb Y/Y
Itau Unibanco Holding S.A. ITUB posted recurring earnings of R$7.16 billion ($1.28 billion) for fourth-quarter 2021, up 32.9% year over year. Including non-recurring items, net income came in at R$6.23 billion ($1.12 billion), down 17.9%.
– Zacks
Results benefited from higher revenues and a rise in the credit portfolio. However, increased non-interest expenses, cost of credit charges and non-performing loan ratio acted as headwinds.
In 2021, Itau Unibanco reported recurring earnings of R$26.88 billion ($4.82 billion) compared with R$18.54 billion in the prior year. 2021 net income came in at R$24.98 billion ($4.47 billion) compared with R$18.91 billion reported a year ago.
Revenues Rise, Costs Increase
Operating revenues came in at R$33.44 billion ($5.99 billion) in the reported quarter, up 14.6% on a year-over-year basis. In 2021, ITUB reported operating revenues of R$125.60 billion ($22.49 billion), up 9.4%.
Managerial financial margin increased 20.6% year over year to R$21.21 billion ($3.79 billion). Also, commissions and fees were up 4% to R$10.25 billion ($1.84 billion).
Non-interest expenses totaled R$13.36 billion ($2.39 billion), up marginally.
In the fourth quarter, the efficiency ratio was 43%, down 640 basis points (bps) from the year-earlier quarter’s level. A decrease in this ratio indicates increased profitability.
Credit Quality
Cost of credit charges climbed 2.8% on a year-over-year basis to R$6.20 billion ($1.11 billion).
The non-performing loan ratio (loan transactions more than 90 days overdue) came in at 2.5% during the fourth quarter, up from the prior-year quarter’s 2.3%.
Balance Sheet Position
As of Dec 31, 2021, Itau Unibanco’s total assets amounted to R$2.17 trillion ($0.39 trillion), up marginally, sequentially. Deposits totaled R$1.12 trillion ($0.20 trillion), up 3.7% on a sequential basis.
Itau Unibanco’s credit portfolio, including financial guarantees provided and corporate securities, reached R$1.03 trillion ($0.18 trillion) as of Dec 31, 2021, up 18.1% year over year.
Capital & Profitability Ratios
As of Dec 31, 2021, Common Equity Tier 1 ratio was 11.3%, down from 11.5% on Dec 31, 2020.
Annualized recurring return on average equity climbed to 20.2% in the fourth quarter from 16.1% recorded in the year-earlier quarter.
2022 Guidance
The company expects costs of credit to be R$25-R$29 billion.
Non-interest expenses are expected to grow between 3% and 7%.
Total credit portfolio is now projected to grow 9-12%.
Commissions and fees from insurance operations are likely to be up 3.5-6.5%.
Managerial financial margin with clients is estimated to increase 20.5-23.5%.
Financial marginal with the market is now projected in the range of R$1-R$3 billion.
The effective tax rate is estimated to be 30-33%.
Our Viewpoint
Results of Itau Unibanco underline its decent performance during the December quarter on higher revenues. ITUB’s prospects look encouraging as it is focused on building strategies to expand inorganically. In addition, its business restructuring efforts will support the financials.
However, inflated expenses are a concern. Heightening competition and stressed conditions in Brazil’s economy pose significant risks.
First Republic Bank’s FRC fourth-quarter 2021 earnings per share of $2.02 surpassed the Zacks Consensus Estimate of $1.91. Additionally, the bottom line improved 26.3% from the year-ago quarter’s level.
FRC’s quarterly results were supported by a higher net interest income and non-interest income. Moreover, First Republic’s balance-sheet position was strong in the quarter. However, higher expenses and elevated net loan charge-offs were the offsetting factors.
Citigroup Inc.C delivered an earnings surprise of 5.04% in fourth-quarter 2021. Income from continuing operations per share of $1.46 outpaced the Zacks Consensus Estimate of $1.39. However, the reported figure declined 24% from the prior-year quarter’s level.
Citigroup’s investment banking revenues jumped in the quarter under review, driven by equity underwriting and growth in advisory revenues. However, fixed-income revenues were down due to declining rates and spread products.
U.S. BancorpUSB reported fourth-quarter 2021 earnings per share of $1.07, which missed the Zacks Consensus Estimate of $1.11. Results, however, compare favorably with the prior-year quarter’s figure of 95 cents.
Though lower revenues and escalating expenses were disappointing factors, credit quality was a tailwind. Growth in loan and deposit balance, and a strong capital position were also encouraging factors. Moreover, U.S. Bancorp closed the acquisition of San Francisco-based fintech firm TravelBank, which offers technology-driven cost and travel management solutions.
Just Released: Zacks Top 10 Stocks for 2022
In addition to the investment ideas discussed above, would you like to know about our 10 top picks for the entirety of 2022?
From inception in 2012 through 2021, the Zacks Top 10 Stocks portfolios gained an impressive +1,001.2% versus the S&P 500’s +348.7%. Now our Director of Research has combed through 4,000 companies covered by the Zacks Rank and has handpicked the best 10 tickers to buy and hold. Don’t miss your chance to get in…because the sooner you do, the more upside you stand to grab.
Want the latest recommendations from Zacks Investment Research? Today, you can download 7 Best Stocks for the Next 30 Days. Click to get this free report
Regency Centers Corporation’s REG fourth-quarter 2021 NAREIT funds from operations (FFO) per share were$1.01. However, adjusted FFO per share came in at 92 cents, which missed the Zacks Consensus Estimate of 96 cents.
– Zacks
On a year-over-year basis, NAREIT (FFO) per share compared favorably with the prior-year period’s 76 cents.
The quarterly results reflect higher-than-anticipated revenue numbers.
Total revenues of $296.9 million exceeded the Zacks Consensus Estimate of $287.9 million. Moreover, revenues jumped 14.9% from the year-earlier quarter’s figure.
For 2021, Regency Centers reported an FFO per share of $3.68, up 23.9% from the prior year’s $2.97. However, the figure lagged the Zacks Consensus Estimate of $3.90. Total revenues of $1.16 billion were up 14.8% year over year.
As of Feb 7, Regency Centers collected 99% of the fourth-quarter pro-rata base rent.
Inside the Headlines
During the fourth quarter, Regency Centers executed 1.8 million square feet of comparable new and renewal leases with blended rent spreads of 12.9%.
As of Dec 31, 2021, REG’s wholly-owned portfolio and its pro-rata shares of co-investment partnerships were94.1% leased. Its same-property portfolio was 94.3% leased, reflecting an expansion of 50 basis points (bps), sequentially.
In the same-property portfolio, anchor percent leased (includes spaces greater than or equal to 10,000 square feet) was 96.9%, highlighting an expansion of 40 bps, sequentially, while the same-property shop percent leased (includes spaces less than 10,000 square feet) was 89.9%, marking an expansion of 60 bps quarter over quarter.
The same-property NOI, excluding termination fees, climbed 15.4% on a year-over-year basis.
Portfolio Activity
During the fourth quarter, Regency Centers completed one development project and three redevelopment projects with combined costs of approximately $23 million, at the company’s share.
As of Dec 31, 2021, Regency Centers’ in-process development and redevelopment projects had estimated net project costs of $307 million and an estimated $127 million of remaining costs to complete these projects, each at the company’s share.
Liquidity Update
As of Dec 31, 2021, Regency Centers had cash, cash equivalents and restricted cash of $95 million, down from $378.5 million at 2020 end. The retail REIT had full capacity under its $1.2-billion revolving credit facility. As of that date, its pro-rata net debt-to-operating EBITDAre ratio was 5.1X compared with 6.0Xas of Dec 31, 2020.
Outlook
Regency Centers provided initial 2022 guidance. Management projects the current-year NAREIT FFO per share in the range of $3.72-$3.80. The range is below the Zacks Consensus Estimate, currently pegged at $3.90.
Management also expects the same-property NOI (excluding termination fees) in the guided range of -1.25-0.25%.
Dividend Update
On Feb 9, Regency Centers’ board of directors announced a quarterly cash dividend of 62.5 cents per share on its common stock. The dividend will be paid out on Apr 5 to its shareholders of record as of Mar 15, 2022.
Alexandria Real Estate Equities, Inc.ARE reported an adjusted FFO of $1.97 per share for fourth-quarter 2021, up 7.1% from the year-ago quarter’s $1.84. The figure surpassed the Zacks Consensus Estimate of $1.96.
The year-over-year improvement in ARE’s FFO resulted from 24.4% top-line growth to $576.9 million. Results reflected decent internal growth. Alexandria witnessed a continued healthy leasing activity and rental rate growth during the quarter.
Mid-America Apartment Communities, Inc.MAA, commonly referred to as MAA, reported fourth-quarter 2021 core FFO per share of $1.90, surpassing the Zacks Consensus Estimate of $1.87. The reported number increased 15.2% from the year-ago figure of $1.57.
MAA’s quarterly results were driven by an increase in the average effective rent per unit for the same-store portfolio. The average physical occupancy for the same-store portfolio also increased year over year.
Equity Residential’s EQR fourth-quarter 2021 normalized FFO per share of 82 cents outpaced the Zacks Consensus Estimate of 80 cents. Rental income of $645.1 million also beat the consensus mark of $628.6 million.
On a year-over-year basis, Equity Residential’s normalized FFO per share improved 7.9%, while rental income rose 5.2%. EQR’s results were driven by a strong physical occupancy, a substantially improved pricing power and higher non-Residential revenues.
Note: Anything related to earnings presented in this write-up represent funds from operations (FFO) — a widely used metric to gauge the performance of REITs.
Just Released: Zacks Top 10 Stocks for 2022
In addition to the investment ideas discussed above, would you like to know about our 10 top picks for the entirety of 2022?
From inception in 2012 through 2021, the Zacks Top 10 Stocks portfolios gained an impressive +1,001.2% versus the S&P 500’s +348.7%. Now our Director of Research has combed through 4,000 companies covered by the Zacks Rank and has handpicked the best 10 tickers to buy and hold. Don’t miss your chance to get in…because the sooner you do, the more upside you stand to grab.
Want the latest recommendations from Zacks Investment Research? Today, you can download 7 Best Stocks for the Next 30 Days. Click to get this free report
Urban Outfitters, Inc. URBN has unveiled sales data for fourth-quarter fiscal 2022. Although the metric fell short of the Zacks Consensus Estimate, the same improved year over year. We note that sales increased across major brands, including Urban Outfitters, Free People, Anthropologie Group and Nuuly. Sturdy digital sales were somewhat offset by soft store net sales. URBN provided a two-year comparison for all metrics as the pre-pandemic period reflects a more precise comparison base due to a significant impact of the outbreak on its business operations in fiscal 2021.
– Zacks
Let’s Introspect
Per management of this lifestyle specialty retailer, net sales for the three months ended Jan 31, 2022 rose 13.9% from the same-period level of fiscal 2020 to $1,332.2 million. The metric also rose 22.4% from the last fiscal year’s reading. However, the metric came below the Zacks Consensus Estimate of $1,342 million. Brand-wise, net sales were up 5.4% from the comparable period’s level in fiscal 2020 to $474.4 million at Urban Outfitters, 13.8% to $558.7 million at Anthropologie Group and 28% to $276.2 million at Free People. Nuuly, the subscription-based rental service for women’s clothes, contributed $17.3 million to net sales, reflecting an increase of 188.3% from the comparable period’s level in fiscal 2020. However, Menus & Venues’ net sales amounted to $5.6 million, down 17.6% from the comparable period’s reading in fiscal 2020. We note that the comparable Retail segment’s net sales grew 14% from the same-period level of fiscal 2020 on a robust double-digit rise in digital channel sales. Growth was partly offset by a low double-digit negative retail store sales due to lower store traffic. By brand, the comparable Retail segment’s net sales jumped 49% at the Free People Group, 14% at the Anthropologie Group and 3% at Urban Outfitters. While net sales at the Retail segment improved 15% from the comparable period’s level in fiscal 2020, the metric at Wholesale unit plunged 22%, mainly due to lower Free People Group’s sales to promotional wholesale customers. Following the sales results, URBN expects a stronger-than-anticipated deleverage in gross margin for the fiscal fourth quarter due to elevated inbound transportation costs. For the year ended Jan 31, 2022, net sales climbed 14.2% from the level as of Jan 31, 2020 and 31.9% year over year to $4,548.8 million. Further, the comparable Retail segment’s net sales grew 16% on robust digital channel sales, somewhat negated by negative retail store sales due to weak traffic. The Wholesale segment’s net sales declined 23% from the level as of Jan 31, 2020, mainly due to weak sales at the Free People Group’s sales to promotional wholesale customers.
Store Update
We note that Urban Outfitters has been rational with store openings so far. In fiscal 2022, URBN inaugurated 56 retail outlets, such as 17 Urban Outfitters, 9 Anthropologie Group and 29 Free People (including 18 FP Movement stores), and one Menus & Venues restaurant. URBN shuttered 18 retail locations including three Urban Outfitters stores, eight Anthropologie Group stores, five Free People stores and two Menus & Venues restaurants. In the aforementioned period, two franchisee-owned stores were closed, one each of Urban Outfitters and Anthropologie Group stores.
What’s More?
Management also informed that Francis Pierrel joined as the President of Urban Outfitters in North America. He will report directly to Sheila Harrington, the global chief executive officer of URBN and the Free People Group. Shares of this Philadelphia, PA-based player have dipped 2.1% in the past six months compared with the industry’s 12.9% decline. This presently Zacks Rank #4 (Sell) entity has been witnessing inflationary pressures from freight, raw materials and wages. Also, the ongoing supply-chain disruptions remain deterrents. Nonetheless, Urban Outfitters is constantly strengthening its direct-to-consumer business, enhancing productivity across the existing channels, expanding product assortments and optimizing inventory level. Its strategic growth initiative FP Movement endeavors are also yielding results.
Solid Picks in Retail
Some better-ranked stocks are Capri HoldingsCPRI, Boot Barn HoldingsBOOT and Tapestry TPR. Capri Holdings, which offers accessories and footwear, sports a Zacks Rank #1 (Strong Buy) at present. CPRI has an expected earnings per share (EPS) growth rate of 30.9% for three-five years. You can see the complete list of today’s Zacks #1 Rank stocks here. The Zacks Consensus Estimate for Capri Holdings’ current financial-year sales and EPS suggests growth of 36.3% and 210.5%, respectively, from the year-ago period’s corresponding figures. CPRI has a trailing four-quarter earnings surprise of 1,018.2%, on average. Boot Barn Holdings, a lifestyle retailer of western and work-related footwear, apparel and accessories, presently flaunts a Zacks Rank of 1. BOOT has an expected EPS growth rate of 20% for three-five years. The Zacks Consensus Estimate for Boot Barn Holdings’ current financial-year sales and EPS suggests growth of 62.6% and 220.8%, respectively, from the year-ago period’s corresponding figures. BOOT has a trailing four-quarter earnings surprise of 47.1%, on average. Tapestry, a renowned designer of fine accessories, presently carries a Zacks Rank #2 (Buy). TPR has a trailing four-quarter earnings surprise of 29%, on average. The Zacks Consensus Estimate for Tapestry’s current-year sales and EPS suggests growth of 15% and 18.5%, respectively, from the corresponding year-ago period’s levels. TPR has an expected EPS growth rate of 12.3% for three-five years.
Just Released: Zacks Top 10 Stocks for 2022
In addition to the investment ideas discussed above, would you like to know about our 10 top picks for the entirety of 2022?
From inception in 2012 through 2021, the Zacks Top 10 Stocks portfolios gained an impressive +1,001.2% versus the S&P 500’s +348.7%. Now our Director of Research has combed through 4,000 companies covered by the Zacks Rank and has handpicked the best 10 tickers to buy and hold. Don’t miss your chance to get in…because the sooner you do, the more upside you stand to grab.
Want the latest recommendations from Zacks Investment Research? Today, you can download 7 Best Stocks for the Next 30 Days. Click to get this free report
Western Union Co.’s WU fourth-quarter 2021 earnings per share of 64 cents beat the Zacks Consensus Estimate of 53 cents by 20.8%. The bottom line grew 42.2% year over year. Results were driven by a non-cash charge from the termination of its pension plan. WU witnessed a strong quarter with improvement in digital business that registered double-digit growth in the fourth quarter. Total revenues of $1.3 billion improved 1% year over but missed the Zacks Consensus Estimate by 1%. Top-line improvement was led by the digital money transfer and the Business Solutions segment, partially offset by the retail money transfer decline.
– Zacks
Other Quarterly Results
Total expenses of Western Union decreased 7% from the year-ago period’s level to $968 million. In its largest segment Consumer to consumer (C2C), revenues dipped 1% on a reported basis was and were flat in constant currency while transactions were also unchanged during the quarter. Western Union made investments in its digital platform to stay ahead in the fast-changing remittance market. Its vast electronic platform built over the years, helped it during the pandemic-borne crisis when people turned away from its brick-and-mortar stores to send money to their families online. During the quarter, digital money transfer revenues increased 12% at cc and represented 24% and 37% of total C2C revenues and transactions, respectively. Westernunion.com revenues rose 9% year over year on a reported and constant currency basis, consisting of cross-border revenue growth of 12%. Western Union Business Solutions revenues rose 22%, both on a reported basis and at cc. This growth came on the back of progress in international trade along with ramped-up activity in the financial institutions and the education verticals. Other revenues, comprising primarily retail bill payments in the United States and Argentina as well as money orders, increased 5% on a reported basis.
2022 Guidance
Concurrent with fourth-quarter results, management provided current-year guidance. Operating profit margin is expected in the band of 21-22%. Adjusted EPS is projected between $1.90 and $2.00. Management expects revenues for 2022 to be flat to increase low-single digit.
Capital-Deployment Update
In the fourth quarter, Western Union returned a total of $268 million to its shareholders in the form of dividends and share repurchases. Management announced a new $1-billion 3-year share repurchase plan. Moreover, it announced a dividend of 23.5 cents in the first quarter of 2022, payable Mar 31, 2022, to its shareholders as of Mar 17, 2022.
Full-Year Update
Digital money transfer revenues for 2021 grew 22% to more than $1 billion. Revenues for the full year increased 5% year over year (4% at cc) to $5.1 billion. The uptick was driven by solid growth in digital money transfer and the Business Solutions segment. Total C2C revenues rose 4% year over year. Business Solutions witnessed 18% revenue growth on a year-over-year basis for 2021. EPS of WU came in at $2.19for the full year, up 17.1% from the year-ago quarter’s tally.
Of the finance sector players that have reported fourth-quarter results so far, the bottom-line results of American Express Company AXP, Synchrony FinancialSYF and Discover Financial ServicesDFS beat the respective Zacks Consensus Estimate. American Express’ fourth-quarter results gain from record card spending. AXP reported fourth-quarter 2021 earnings of $2.18 per share, which beat the Zacks Consensus Estimate of $1.78. Also, the bottom line increased 24% year over year. AXP’s total revenues, net of interest expense, increased 30% year over year to $12,145 million. The top line beat the Zacks Consensus Estimate of $11,597 million. Synchrony Financial reported fourth-quarter 2021 earnings per share of $1.48, which surpassed the Zacks Consensus Estimate of $1.47 by 0.7%. The bottom line improved around 19% year over year. SYF’s results benefited from solid growth in new accounts and a higher purchase volume. However, the same was offset to some extent by steep expenses. Discover Financial reported fourth-quarter 2021 adjusted earnings of $3.64 per share, which outpaced the Zacks Consensus Estimate of $3.61. The bottom line also improved 41% year over year.
Just Released: Zacks Top 10 Stocks for 2022
In addition to the investment ideas discussed above, would you like to know about our 10 top picks for the entirety of 2022?
From inception in 2012 through 2021, the Zacks Top 10 Stocks portfolios gained an impressive +1,001.2% versus the S&P 500’s +348.7%. Now our Director of Research has combed through 4,000 companies covered by the Zacks Rank and has handpicked the best 10 tickers to buy and hold. Don’t miss your chance to get in…because the sooner you do, the more upside you stand to grab.
Want the latest recommendations from Zacks Investment Research? Today, you can download 7 Best Stocks for the Next 30 Days. Click to get this free report
 – Zacks
  PennyStocks.com – PennyStocks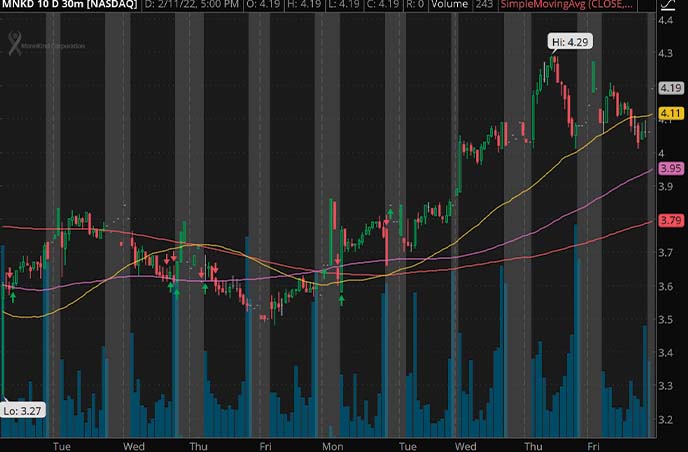
 shutterstock.com – StockNews

 shutterstock.com – StockNews

 shutterstock.com – StockNews
 – Zacks
  – Zacks
  – Zacks
  – Zacks
  – Zacks