Valuations, Velocity, and VIX Point To A Probabilistic Pullback In S&P 500 (SPY)

VIX hit a new yearly low. S&P 500 hit a new yearly high. Playing for a pullback by buying puts on SPY has never been cheaper over the past 12 months.

We like to employ a multi-faceted approach to trade idea generation at POWR Options. Combining fundamental, technical, and implied volatility (IV) analysis to find an edge.

A quick walk through of the process is highlighted our most recent analysis of the S&P 500 below. We will use both SPX and SPY interchangeably in the discussion since many traders likely trade SPY versus SPX.

Valuations

Always prefer looking at Price/Sales versus the more widely followed Price/Earnings (P/E) ratio since earnings can be more easily gamed by stock buybacks and accounting tricks. Price/Sales is a cleaner number.

The recent run-up in the SPX wasn’t based on torrid earnings or revenue growth but was simply more of a multiple expansion.

In terms of revenues, analysts have decreased their estimates during the upcoming quarter. As of Friday, the S&P 500 is expected to report (year-over-year) revenue growth of 3.2%, compared to the expectations for revenue growth of 3.9% on September 30. So, slowing growth on the horizon.

The current Price/Sales (P/S) ratio in the S&P 500 is now back at the 2.5x level and nearing the loftiest levels in the past year. It is also more than 1 standard deviation higher than the average over the prior 12 months as well.

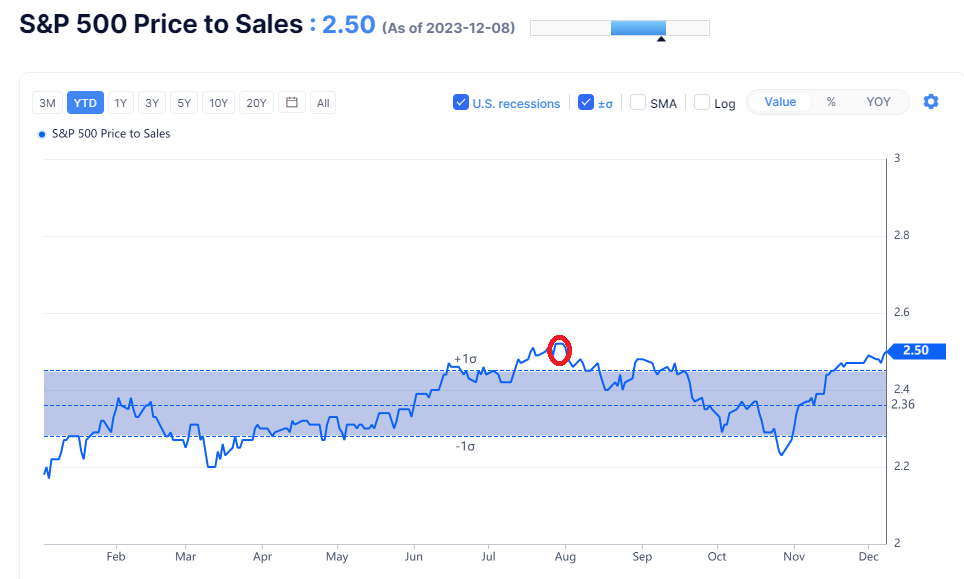
Indeed, the last time the S&P 500 traded at such a lofty multiple was late July which marked a significant short-term top in the market as seen in the chart.

Velocity

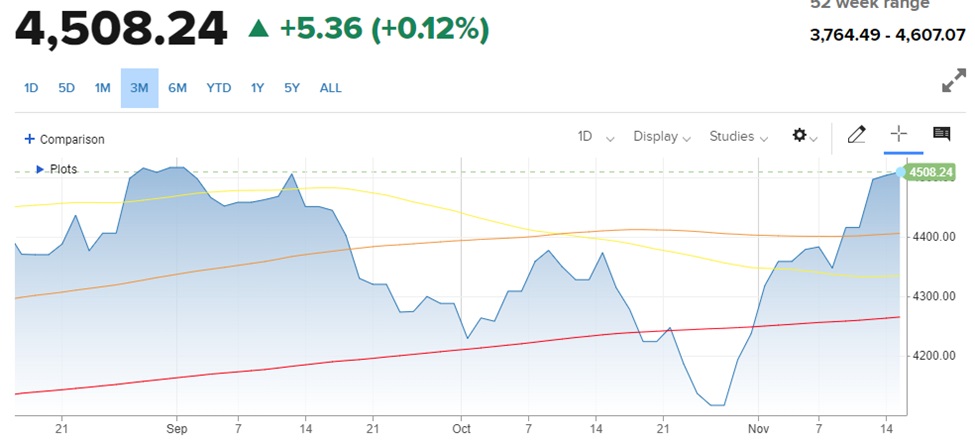
The SPY is starting to lose upside momentum as it stalls out at the $4600 resistance level. 9-day RSI got to overbought levels but has weakened. Bollinger Percent B approached 100 then softened. More importantly, MACD just generated a sell signal by turning negative even as the S&P 500 hit an annual high.

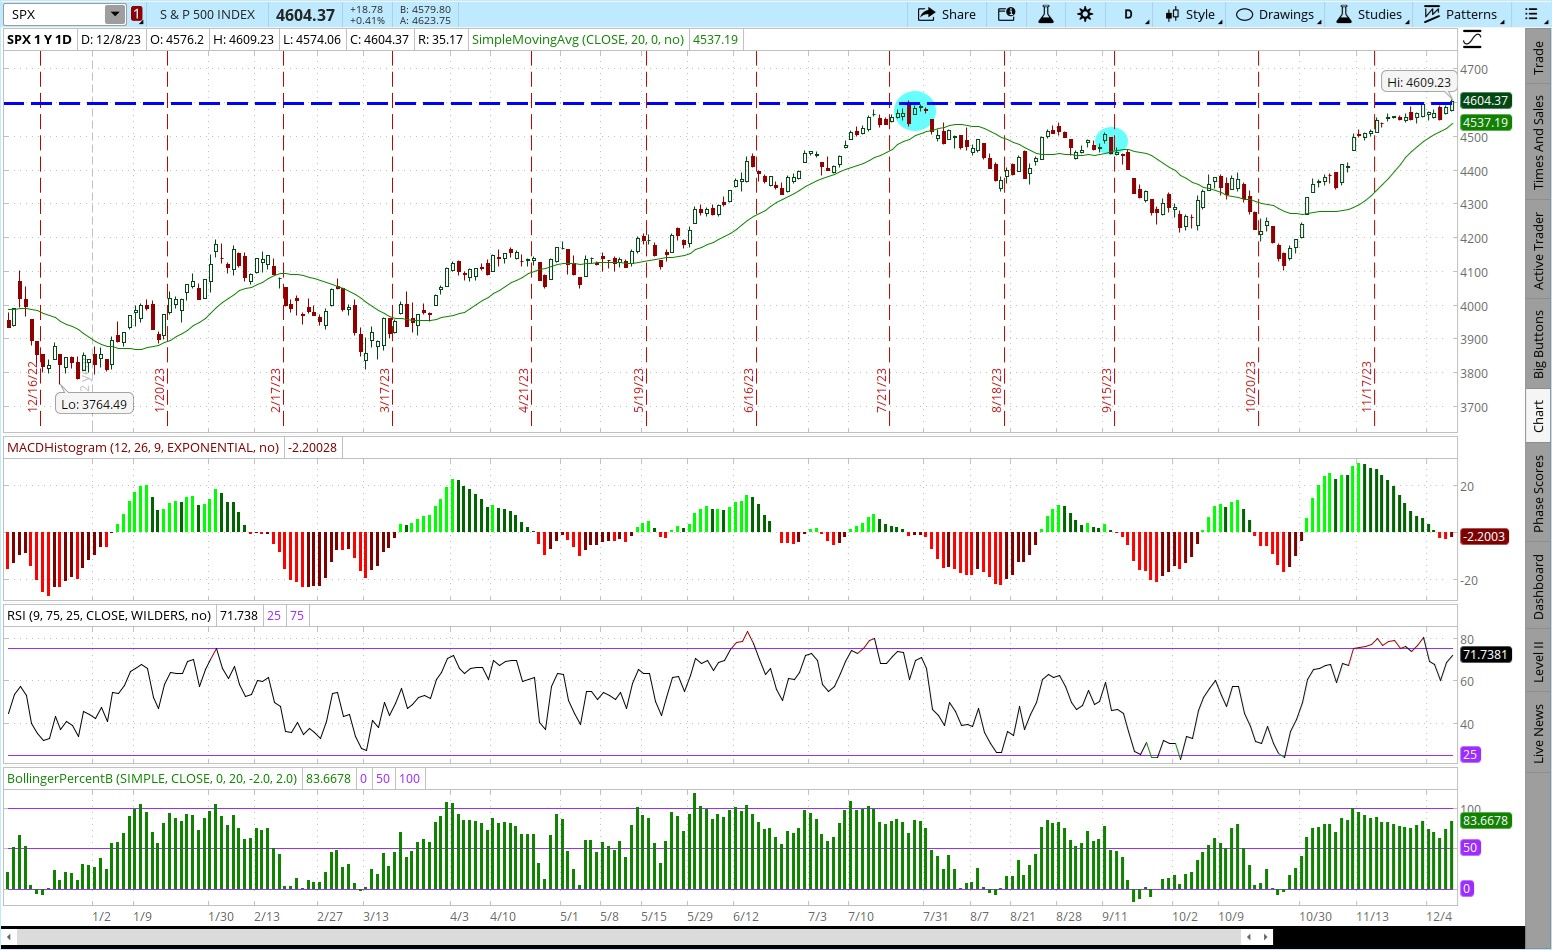
The previous two times this occurred coincided with a sharp pullback in the S&P 500 as highlighted in the chart above. See if the same happens once again.

VIX

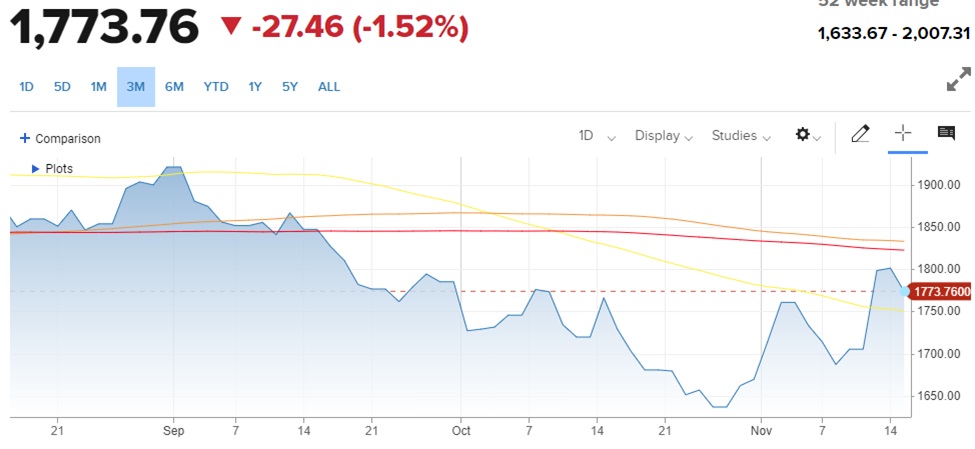
The VIX made a new annual low on Friday, closing below the key 12.50 level after hugging that price level for two weeks.

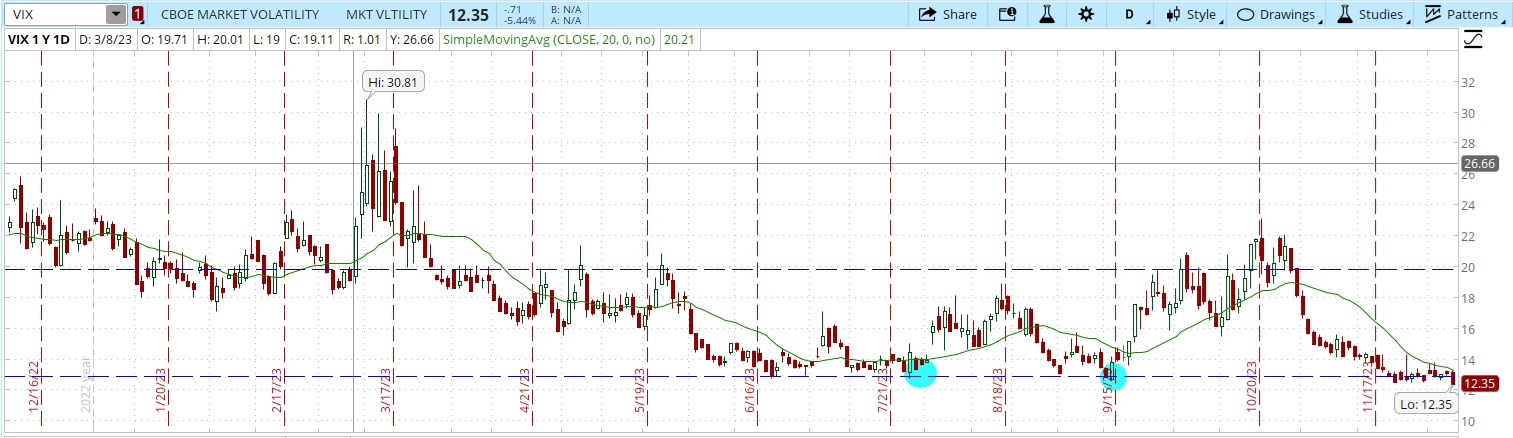
The previous two times it got to such depressed readings after extended consolidation coincided precisely with tops in the SPX shown below.  This may once again be an opportune time to take a short-term short position in the S&P 500.

The new low levels of VIX also mean option prices are the cheapest they have been in a year. A comparison of put prices from October 20 (when S&P 500 was near the lows) versus Friday’s close with SPY at highs shows just how much cheaper.

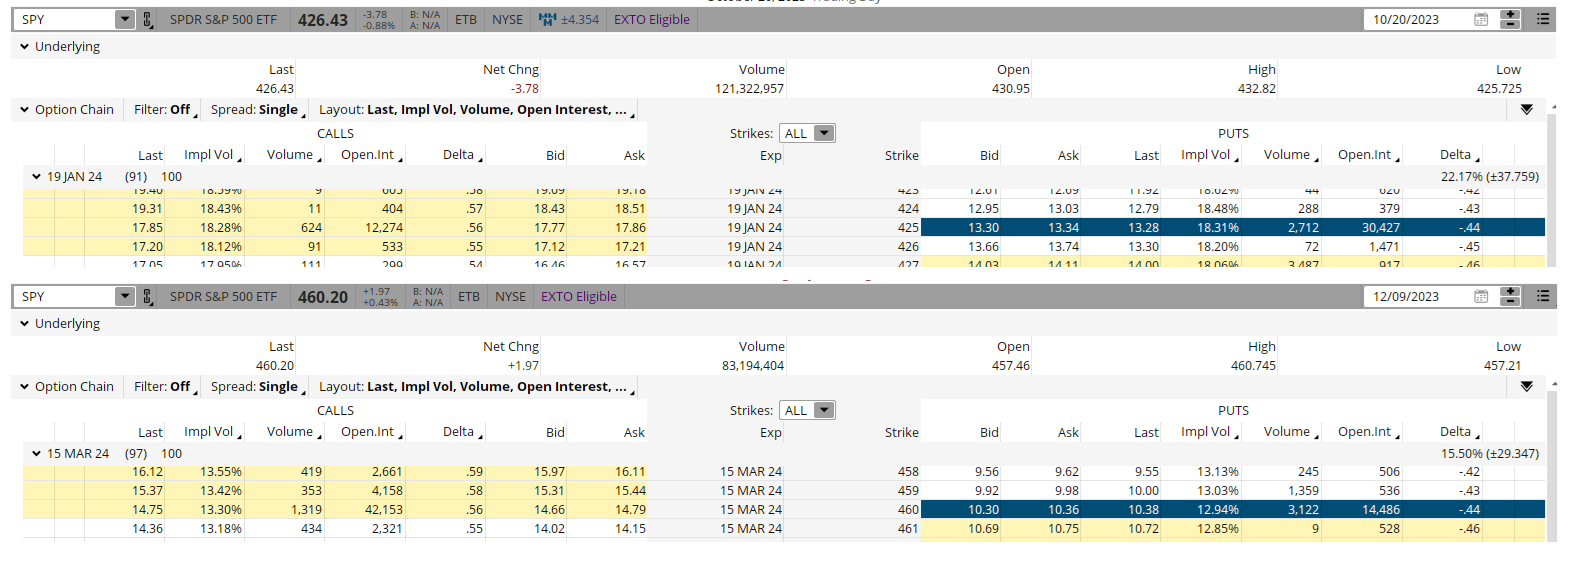
On October 20, the SPY closed at $426.43. The slightly out-of-money $425 put ($1.43 out-of-the-money) was trading at $13.32 and had 91 days to expiration (DTE). Implied volatility (IV) was over 18.

Friday shows that the SPY closed at $460.20. The at-the-money put (only 20 cents out-of-the money) was trading at $10.33 and had 97 DTE. Implied volatility was just under 13.

So, the current at-the-money $460 put had more time to expiration (97 days versus 91 days) which should theoretically make it more expensive. It was also slightly less out-of-the money ($0.20 compared to $1.43) which should make it more expensive.  Plus, the SPY was higher priced by nearly 34 points which should make the price of the comparative put higher priced as well.

But, IV has been hammered to the lowest levels of the year. In our example, the puts fell from over 18 to under 13 IV. This makes option prices much cheaper. To put it in percentage perspective, the cost of the puts fell from over 3%  in October to just over 2% now.

If you had bought the similar at-the-money puts last time SPY was this almost this high and VIX was almost this this low in late July, you would have been rewarded very nicely as shown in the option montages below.

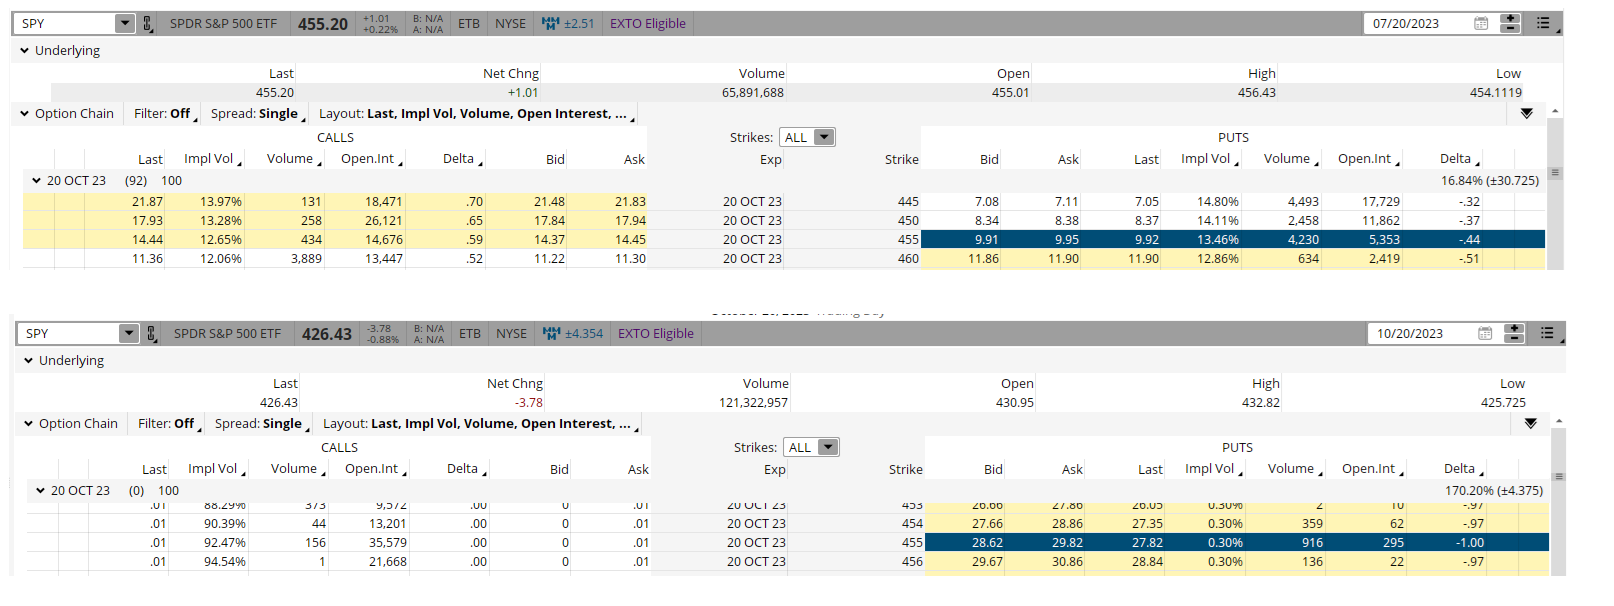
The at-the-money October $455 puts with 92 DTE could have been bought for just under $10 on 7/20. These same puts closed on October expiration at just under $30. This equates to a 200% return in three months.

Certainly, not all trades will work out this well or even this profitably-if profitably at all. This is trading after all.

But using the POWR Options approach can put the odds in your favor. And at the end of the day, trading is all about probability, not certainty.

POWR Options

What To Do Next?

If you’re looking for the best options trades for today’s market, you should check out our latest presentation How to Trade Options with the POWR Ratings. Here we show you how to consistently find the top options trades, while minimizing risk.

If that appeals to you, and you want to learn more about this powerful new options strategy, then click below to get access to this timely investment presentation now:

How to Trade Options with the POWR Ratings

All the Best!

Tim Biggam

Editor, POWR Options Newsletter


SPY shares closed at $460.20 on Friday, up $1.97 (+0.43%). Year-to-date, SPY has gained 21.67%, versus a % rise in the benchmark S&P 500 index during the same period.


About the Author: Tim Biggam

Tim spent 13 years as Chief Options Strategist at Man Securities in Chicago, 4 years as Lead Options Strategist at ThinkorSwim and 3 years as a Market Maker for First Options in Chicago. He makes regular appearances on Bloomberg TV and is a weekly contributor to the TD Ameritrade Network “Morning Trade Live”. His overriding passion is to make the complex world of options more understandable and therefore more useful to the everyday trader. Tim is the editor of the POWR Options newsletter. Learn more about Tim’s background, along with links to his most recent articles.

More…

The post Valuations, Velocity, and VIX Point To A Probabilistic Pullback In S&P 500 (SPY) appeared first on StockNews.com

https://www.entrepreneur.com/finance/valuations-velocity-and-vix-point-to-a-probabilistic/466708


Why is December 13th Important to Stock Investors?

The S&P 500 (SPY) has been on quite a run since the Fed meeting on 11/1. Thus, it is important to note that the next meeting on December 13th will also be a catalyst for stocks. The main question is…will that be good or bad for stocks? To help out, 43 year investment pro Steve Reitmeister shares his latest insights on the market and what investors can expect from the Fed on 12/13 and beyond. This also includes a preview of Steve’s top 13 picks for today’s market. Read on below for more.

Ever since the Fed meeting on 11/1, stocks have been on a tremendous bull run. That’s because investors got just enough acknowledgement from Chairman Powell that they are winning their battle over high inflation without a recession forming.

So now is a good time to look at where we stand coming into the next Fed meeting on 12/13 and what that means for the market going forward.

Market Commentary

The main positive development since the last Fed meeting in early November has been the tremendous drop in long term bond rates. The chart below for the 10 year Treasury rate shows you the dramatic rise that initially cratered stocks followed by the welcome relaxation in rates and bull rally for stocks that ensued.

This was not just a US centered issue. Other key rates in Europe and Asia saw beneficial declines that improved the economic outlook for 2024 as lower rates helps fuel investment in future growth.

Also since that 11/1 Fed meeting we have seen the US economy properly simmer down from the too hot 5% GDP growth pace from Q3. The Goldilocks level for GDP growth is 1-2% as it keeps us safely above recessionary territory while also reducing inflationary pressures.

Right now, the famed GDPNow model from the Atlanta Fed is coming in at +1.2% growth for Q4. This pretty well matches the outlook for the Blue Chip Consensus view which is the average view of leading economists. This is

Next it is good to look at the employment picture because without that faltering…then its impossible to be worried about a recession. On the other hand, you don’t want the job market so hot that it stokes sticky wage inflation.

Thus, it was interesting to see that the JOLTs report on Tuesday fell from a high of over 11 million job postings earlier in the year to a recent low of 8.73 million. In the grand scheme of things, that is still a lot of job openings and says the employment market is still quite healthy. But it is no longer boiling hot which should subdue inflationary pressures in wages going forward.

Overall inflation has also continued to ebb lower since the last Fed meeting. This was apparent in the continued reduction in the November CPI report. Even better was how the forward looking PPI report showed an reduction in month over month inflation that says that future CPI readings will continue to be lower.

Add all of this up and you understand why right now odds are placed at 97.3% likelihood of the Fed NOT raising rates at their next meeting on 12/13. Interestingly some investors are starting to believe that as early as January is when the Fed will start lowering rates. That stands at 16% likelihood up from 0% just a month ago.

The rate cut parade keeps picking up steam from there with 61% expecting a cut at the March 20, 2024 meeting and all the way up to 88% at the May 1, 2024 event.

Yes, one could look at that and say it doesn’t match the hawkish resolve stated by Chairman Powell and other Fed officials. And thus could set up the market for some disappointment if these rate cuts are not delivered as early as expected.

That is always possible. However, to date the market as a whole has done a pretty good job of prognosticating the Fed’s next move. Given that rates are currently restrictive and inflation is coming down to trend pretty fast, with little obvious reason seeing why they would spike higher from here…that would point to the Fed being wise to start lowering rates early in 2024…even if very slowly at first.

Long story short, we are in a bull market til proven otherwise. And the future lowering of rates would be yet another catalyst for a move higher.

The key is determining which stocks are likely to outperform when so many of them already had tremendous runs in 2024. I believe the recent rotation towards small and mid caps is a precursor of the major trend in 2024.

Meaning what worked in 2023 is done. It is time for smaller, growthier and more reasonably priced stocks to shine. And we are certainly leaning into those trends in our portfolio.

More on that in the section below…

What To Do Next?

Discover my current portfolio of 9 stocks packed to the brim with the outperforming benefits found in our exclusive POWR Ratings model. This includes 4 small caps recently added with tremendous upside potential.

Plus I have added 4 ETFs that are all in sectors well positioned to outpace the market in the weeks and months ahead.

This is all based on my 43 years of investing experience seeing bull markets…bear markets…and everything between.

If you are curious to learn more, and want to see these 13 hand selected trades, then please click the link below to get started now.

Steve Reitmeister’s Trading Plan & Top Picks >

Wishing you a world of investment success!


Steve Reitmeister…but everyone calls me Reity (pronounced “Righty”)
CEO, StockNews.com and Editor, Reitmeister Total Return


SPY shares were trading at $458.17 per share on Friday morning, down $0.06 (-0.01%). Year-to-date, SPY has gained 21.13%, versus a % rise in the benchmark S&P 500 index during the same period.


About the Author: Steve Reitmeister

Steve is better known to the StockNews audience as “Reity”. Not only is he the CEO of the firm, but he also shares his 40 years of investment experience in the Reitmeister Total Return portfolio. Learn more about Reity’s background, along with links to his most recent articles and stock picks.

More…

The post Why is December 13th Important to Stock Investors? appeared first on StockNews.com

https://www.entrepreneur.com/finance/why-is-december-13th-important-to-stock-investors/466707


A Closer Look at Ford (F) and Toyota (TM) – Time to Buy, Hold, or Sell?

Auto sales are projected to rebound in the upcoming quarters with reduced inflation, better inventory and enhanced supply chain. Considering this, is it wise to invest in Toyota Motor Corporation… https://www.entrepreneur.com/finance/a-closer-look-at-ford-f-and-toyota-tm-time-to-buy/466503


Top 3 Defense Stock Picks Illuminating the Market This Month

The escalating geopolitical upheaval has precipitated a surge in defense expenditure, positioning the defense industry to thrive. Therefore, fundamentally strong defense stocks General Dynamics Corporation (GD), Lockheed Martin (LMT), and… https://www.entrepreneur.com/finance/top-3-defense-stock-picks-illuminating-the-market-this-month/466494


BlackBerry (BB) vs. Cisco Systems (CSCO) – Which Tech Stock Is the Better December Buy?

Rising adoption of wireless devices, expanding proliferation of advanced technologies, and ongoing trends of enterprise mobility and hybrid/remote work create ample growth opportunities for the technology networking industry. Tech stocks… https://www.entrepreneur.com/finance/blackberry-bb-vs-cisco-systems-csco-which-tech-stock/466436


VERY Healthy Stock Rotation Underway

The S&P 500 (SPY) is putting the finishing touches on a strong 2023 campaign. This is the 4th straight year the large cap index has outperformed small and mid caps…. https://www.entrepreneur.com/finance/very-healthy-stock-rotation-underway/466411


How to Profit Using The Probabilistic POWR Pairs Process

An example of grabbing gains from comparative performance with a lower risk China pairs trade on BIDU/PDD.

One of the main strategies we emply at POWR Options is called a pairs trade. We look to identify situations whee the much higher rated stock in the POWR Ratings has dramatically underperformed the much lower rated stock. Buy bullish calls on the higher rated name and bearish puts on the lower rated company.

The expecation is that the relative divergence between the two stocks will be begin to converge. This means we expect the better stock to start outperforming the worse stock with the bullish calls performing better than the bearish puts.

A recent example of a pairs trade done in the POWR Options portfolio may help highlight the strategy.

On October 23, POWR Options saw that C-rated Pinduoduo stock (PDD) had once again begun to outperform the higher B-rated Baidu (BIDU). Both stocks were in the same industry-Chinese Internet. PDD was ranked at 26 out of 42 while BIDU was ranked at number 9.

The chart below shows the comparative performance over the past two years. Normally the two stocks tend to be much more highly correlated. Expectations were for BIDU to outperform PDD over the coming weeks and close the performance gap as it had in the past.

The trade was to buy January 120 calls on BIDU at $4.50 and January 90 puts on PDD for $4.40.

We also always look at implied volatility on every trade to avoid buying expensive options.

In this instance, BIDU IV was well below average at the 26th percentile while PDD puts were even cheaper at only the 11th percentile. Both the BIDU calls and PDD puts were comparatively cheap.

The chart below shows how BIDU has finally outperformed PDD over the past month. Gain of 10.74% for BIDU versus a gain of 9.56% for PDD.

The magnitude of the gains is important as well. Initially the delta on the BIDU calls were 35 at trade inception on October 23. The PDD put delta was a -23 delta. Delta represents the stock equivalent of the options. So our intial trade would have slightly bullish at 12 deltas net long-or about 12 shares of stock.

Fast forward to November 24 and the BIDU call delta rose to 64 while the PDD put delta fell to -7.  Now decidedly more bullish at 57 deltas net long. The trade structure of buying both calls and puts benefits from big moves in the underlying stock. In essence, we make more on the calls as both stocks rise than what we lose on the puts.

Actual trade details are shown below:

Net gain on the trade was $130- a profit of $480 on BIDU calls and a loss of $350 on PDD Puts. Initial cost was $890 ($450 for the BIDU calls and $440 for the PDD puts).

That puts the net percentage gain on the pairs trade at just under 15%. The holding period was a month. Not a bad 30-day gain on a fairly neutral position. The 15% monthly gain equates to an annualized gain of over 400%.

Not every trade, or even pairs trade, will work out in a similar manner to our China pairs.

As we have said in the past (and likely continue to say in the future), trading is all about probability and not certainty.

But for those looking to put the odds in your favor in a lower risk way, you may want to give the POWR Options methodology a try.

POWR Options

What To Do Next?

If you’re looking for the best options trades for today’s market, you should check out our latest presentation How to Trade Options with the POWR Ratings. Here we show you how to consistently find the top options trades, while minimizing risk.

If that appeals to you, and you want to learn more about this powerful new options strategy, then click below to get access to this timely investment presentation now:

How to Trade Options with the POWR Ratings

All the Best!

Tim Biggam

Editor, POWR Options Newsletter


BIDU shares closed at $123.40 on Friday, up $3.28 (+2.73%). Year-to-date, BIDU has gained 7.89%, versus a 20.38% rise in the benchmark S&P 500 index during the same period.


About the Author: Tim Biggam

Tim spent 13 years as Chief Options Strategist at Man Securities in Chicago, 4 years as Lead Options Strategist at ThinkorSwim and 3 years as a Market Maker for First Options in Chicago. He makes regular appearances on Bloomberg TV and is a weekly contributor to the TD Ameritrade Network “Morning Trade Live”. His overriding passion is to make the complex world of options more understandable and therefore more useful to the everyday trader. Tim is the editor of the POWR Options newsletter. Learn more about Tim’s background, along with links to his most recent articles.

More…

The post How to Profit Using The Probabilistic POWR Pairs Process appeared first on StockNews.com

https://www.entrepreneur.com/finance/how-to-profit-using-the-probabilistic-powr-pairs-process/465915


Analyzing the Profit Potential of 3 Tech Stocks

The tech industry is set for growth due to continued investments in digitization and the adoption of emerging technologies. Therefore, we examine the prospects of quality tech stocks Research Institute (NRILY), Brother Industries (BRTHY), and RADCOM (RDCM). Read more….

The tech industry is booming despite economic challenges, as the growing use of technology in different sectors, higher investments in digitization, and emerging technologies drive demand for tech solutions.

Given this backdrop, it could be wise to invest in fundamentally strong tech stocks: Nomura Research Institute, Ltd. (NRILY), Brother Industries, Ltd. (BRTHY), and RADCOM Ltd. (RDCM).

Before diving deeper into the fundamentals of these stocks, let’s discuss what is shaping the tech industry’s prospects.

The digital revolution and the rising use of advanced technologies like Artificial Intelligence (AI) are the key factors boosting the tech industry’s prospects. With smart devices and advanced computers, the tech industry is a dominant force in the global economy.

After the post-pandemic challenges and struggles with navigating a high-interest rate environment, the tech industry made a strong comeback thanks to the AI wave. The global AI market is projected to grow at a 37.3% CAGR between 2023 and 2030.

Gartner predicts global IT spending to hit $5.10 trillion in 2024, an 8% increase. This growth is expected to be fueled by higher investments in cloud computing, growth of generative AI, and digital transformation of businesses.

Tech stocks have been in the spotlight this year, with the Technology Select Sector SPDR Fund (XLK) gaining 47.2% year-to-date, outpacing the broader SPDR S&P 500 ETF Trust’s (SPY) 17.7% returns.

Considering these conducive trends, let’s analyze the fundamentals of the featured stocks.

Nomura Research Institute, Ltd. (NRILY)

Headquartered in Tokyo, Japan, NRILY offers consulting, financial, and industrial IT solutions and IT platform services. Its segments include Consulting, Financial IT Solutions, Industrial IT Solutions, and IT Infrastructure Services. The company provides management and system consulting, system development, and operational solutions for various sectors, such as finance, manufacturing, and public services.

On April 27, 2023, NRILY announced the acquisition of up to 20 million shares of its common stock, representing 3.38% of total issued shares, with a total acquisition price of up to ¥50 billion ($338.18 million). The purpose is to enhance capital efficiency and align with NRILY’s agile equity policy in response to changes in the business environment.

In terms of the trailing-12-month net income margin, NRILY’s 10.92% is 517.7% higher than the 1.77% industry average. Likewise, its 15.68% trailing-12-month EBIT margin is 234.4% higher than the industry average of 4.69%. Furthermore, the stock’s 0.86x trailing-12-month asset turnover ratio is 38.3% higher than the industry average of 0.62x.

NRILY’s revenue for the six months ended September 30, 2023, increased 6.8% year-over-year to ¥362.07 billion ($2.43 billion). The company’s operating profit increased 6.5% over the prior-year period to ¥58.87 billion ($394.96 million). Also, its profit attributable to owners of parent and EPS came in at ¥37.66 billion ($252.66) and ¥64.09, up 5% and 5.7% year-over-year, respectively.

For the fiscal year ending March 31, 2024, NRILY’s revenue is expected to increase 51.6% year-over-year to $4.98 billion. Over the past nine months, the stock has gained 30.1% to close the last trading session at $28.28.

NRILY’s POWR Ratings reflect strong prospects. It has an overall rating of B, translating to a Buy in our proprietary rating system. The POWR Ratings assess stocks by 118 different factors, each with its own weighting.

It is ranked #4 out of 9 stocks in the A-rated Outsourcing – Tech Services industry. It has a B grade for Stability and Quality. Click here to see NRILY’s rating for Growth, Value, Momentum, and Sentiment.

Brother Industries, Ltd. (BRTHY)

Headquartered in Nagoya, Japan, BRTHY manufactures and sells communications and printing equipment in Japan, the Americas, Europe, Asia, Oceania, the Middle East, Africa, and internationally. It operates through Printing & Solutions, Machinery, Domino, Nissei, Personal & Home, and Network & Contents segments.

On October 27, 2023, BRTHY introduced the “PureEne” brand, showcasing its dedication to promoting hydrogen use through fuel cell development and hydrogen pillar pipeline projects. The first product, the “AC-UPS Series,” a hydrogen fuel cell and battery hybrid power supply, is now being shipped in Japan and selected as an emergency backup at Narita Airport.

On July 24, 2023, BRTHY announced its 20th consecutive year of co-sponsoring the World Cosplay Summit. They’re offering the ScanNCut DX cutting machine as the “Brother Prize’ for costume making. BRTHY will also demonstrate crafting at Oasis 21 and support the World Cosplay Championship, giving cosplayers a platform to showcase their works created with BRTHY products.

In terms of the trailing-12-month Capex/Sales, BRTHY’s 4.29% is 83.6% higher than the 2.34% industry average. Likewise, its 4.61% trailing-12-month net income margin is 160.7% higher than the 1.77% industry average. Additionally, its 5.93% trailing-12-month Return on Common Equity is 499.4% higher than the 0.99% industry average.

For the fiscal second quarter that ended September 30, 2023, BRTHY’s revenue increased 1.2% year-over-year to ¥199.23 billion ($1.34 billion). The company’s operating profit rose 42.2% over the prior year’s quarter to ¥17.70 billion ($118.75 million). Moreover, its profit for the period and EPS amounted to ¥12.66 billion ($84.94 million) and ¥49.39.

Analysts expect BRTHY’s revenue for the quarter ending June 30, 2024, to increase 6.4% year-over-year to $1.50 billion. Over the past nine months, the stock has gained 16% to close the last trading session at $33.43.

It’s no surprise that BRTHY has an overall rating of A, which translates to a Strong Buy in our proprietary rating system. It has an A grade for Stability and a B for Value and Quality.

Within the B-rated Technology – Electronics industry, it is ranked first out of 40 stocks. In total, we rate BRTHY on eight different levels. Beyond what we stated above, we also have given BRTHY grades for Growth, Momentum, and Sentiment. Get all the BRTHY ratings here.

RADCOM Ltd. (RDCM)

Headquartered in Tel Aviv, Israel, RDCM provides 5G-ready cloud-native network intelligence and service assurance solutions for telecom operators or communication service providers (CSPs). Its offerings include RADCOM ACE, RADCOM Service Assurance, RADCOM Network Visibility, and RADCOM Network Insights.

On July 13, 2023, RDCM launched its 5G assurance solution on Google Cloud, providing telecom operators with automated, cloud-native assurance to enhance customer experience and proactively improve 5G service quality. The solution seamlessly integrates with Google Kubernetes Engine (GKE) and BigQuery, using AI-driven analytics to address 5G standalone network deployment challenges.

In terms of the trailing-12-month net income margin, RDCM’s 2.20% is 24.2% higher than the 1.77% industry average. Likewise, its 18.74% trailing-12-month levered FCF margin is 127.5% higher than the industry average of 8.24%. Furthermore, the stock’s 1.05% trailing-12-month Return on Total Assets is significantly higher than the industry average of 0.07%.

RDCM’s revenue for the fiscal third quarter ended September 30, 2023, increased 9.9% year-over-year to $13.12 million. The company’s non-GAAP gross profit increased 12.9% year-over-year to $9.94 million. Additionally, its non-GAAP net income and net income per share came in at $2.40 million and $0.15, up 149.5% and 150% year-over-year, respectively.

Street expects RDCM’s revenue for the quarter ending December 31, 2023, to increase 10.3% year-over-year to $13.55 million. Over the past month, the stock has declined 2.1% to close the last trading session at $8.06.

RDCM’s strong fundamentals are reflected in its POWR Ratings. It has an overall rating of B, which translates to a Buy in our proprietary rating system. It has an A grade for Sentiment and a B for Growth, Stability, and Quality.

Within the Technology – Services industry, it is ranked #6 out of 81 stocks. To see RDCM’s Growth, Stability, Sentiment, and Quality ratings, click here.

What To Do Next?

43 year investment veteran, Steve Reitmeister, has just released his 2024 market outlook along with trading plan and top 11 picks for the year ahead.

2024 Stock Market Outlook >


NRILY shares were unchanged in premarket trading Thursday. Year-to-date, NRILY has gained 19.99%, versus a 20.30% rise in the benchmark S&P 500 index during the same period.


About the Author: Abhishek Bhuyan

Abhishek embarked on his professional journey as a financial journalist due to his keen interest in discerning the fundamental factors that influence the future performance of financial instruments.

More…

The post Analyzing the Profit Potential of 3 Tech Stocks appeared first on StockNews.com

https://www.entrepreneur.com/finance/analyzing-the-profit-potential-of-3-tech-stocks/465852


How We Were Able To Steal Some Profits In Steel Stock Giant RIO

Using the POWR Options approach to increase returns at lower risk in iron ore mining mammoth Rio Tinto (RIO).

Option trading can be befuddling to many. No doubt that some of the intricate strategies used by hedge funds and big banks can be both complex and daunting.

Luckily, there are simpler and more straightforward ways to trade options that the average retail investor can use to both lower the risk and upfront cost and increase potential returns.

These are exactly the type of trades we employ in the POWR Options program. We combine the POWR Ratings along with technical and volatility analysis to select the best stocks to buy bullish calls along with finding the worst stocks to buy bearish puts.

A walk through the latest closed out trade in RIO will help shed some light on the process.

For those unfamiliar with Rio Tinto (RIO) stock, it is the world’s second largest mining company. The primary focus is on iron ore.

POWR Rating

Rio Tinto was a Strong Buy (A-Rated) stock in the POWR Ratings. Three Buy Component Grades. Ranked at the very top at number 1 in the Industrial Metals Industry. Best steel stock to buy.

Technicals

RIO had bounced once again of major support at the $60 level after nearing oversold readings once again. Shares were poised to break past the 20-day moving average and MACD was on the verge of generating a fresh new buy signal.

RIO Stock was also trading at a big discount to the Steel Index (SLX). Normally the two are highly correlated as seen in the comparative chart below. This makes sense given RIO is the largest component of the Steel Index at 13% weighting.

Implied Volatility (IV)

Implied volatility (IV) was also trading below average at the 38th percentile. This means option prices were comparatively cheap. Even more so given that the VIX at the time of trade inception on October 16 was trading near the highest levels of the year.

This set up the trade recommendation to buy the RIO January $61.88 calls at $5.10 w.10 discretion.

Fast forward to November 14 and the technical situation in RIO stock had changed decidedly. Shares were now getting overbought as RIO neared overhead resistance at $68. The comparative differential between SLX and RIO had narrowed significantly. In addition, RIO stock had fallen from A-rated to B-rated. Still a Buy, just not a Strong Buy. Rio Tinto had also fallen to number 6 in the Industry from number 1.

POWR Options issued a close-out of the RIO January $61.88 calls for $7.70 w.10 discretion. This equates to just over a 50% gain in just under a month. Actual results shown below:

While the stock had rallied from $64 to $68 in that month time frame for a gain of 6.25%, the options we bought rose 8 times that amount. Highlights the power of options and POWR Options. Plus, the cost of buying 100 shares of RIO would have been over $6000. The cost of the January call options was right around $500-or only 8% of the cost.

Certainly, not every trade will work out this well or to this degree. After all, trading is all about probability, not certainty. But using the POWR Options approach can help increase the probability of success and put the odds more in your favor.

POWR Options

What To Do Next?

If you’re looking for the best options trades for today’s market, you should check out our latest presentation How to Trade Options with the POWR Ratings. Here we show you how to consistently find the top options trades, while minimizing risk.

If that appeals to you, and you want to learn more about this powerful new options strategy, then click below to get access to this timely investment presentation now:

How to Trade Options with the POWR Ratings

All the Best!

Tim Biggam

Editor, POWR Options Newsletter


shares closed at $450.79 on Friday, up $0.56 (+0.12%). Year-to-date, has gained 19.18%, versus a % rise in the benchmark S&P 500 index during the same period.


About the Author: Tim Biggam

Tim spent 13 years as Chief Options Strategist at Man Securities in Chicago, 4 years as Lead Options Strategist at ThinkorSwim and 3 years as a Market Maker for First Options in Chicago. He makes regular appearances on Bloomberg TV and is a weekly contributor to the TD Ameritrade Network “Morning Trade Live”. His overriding passion is to make the complex world of options more understandable and therefore more useful to the everyday trader. Tim is the editor of the POWR Options newsletter. Learn more about Tim’s background, along with links to his most recent articles.

More…

The post How We Were Able To Steal Some Profits In Steel Stock Giant RIO appeared first on StockNews.com

https://www.entrepreneur.com/finance/how-we-were-able-to-steal-some-profits-in-steel-stock-giant/465615


Small Problem May Loom Large for Bull Market

The stock market sure seems bullish in November given the tremendous bounce from bottom. But the large cap bias of the S&P 500 (SPY) continues to hide some of the weakness found in smaller stocks. This important topic needs to be reviewed to appreciate the health and longevity of this bull run. That topic is at the center of Steve Reitmeister’s most recent commentary that includes a preview of his top 11 picks for today’s market. Read on for more….

The most bullish event this year took place on Tuesday November 14th. That is when the small caps in the Russell 2000 nearly tripled the S&P 500’s (SPY) return at +5.44%.

Since then large caps continue to rise and small caps are lagging once again. This makes me wonder just how bullish this market truly is???

Let’s dig in more on this vital topic in today’s commentary.

Market Commentary

November has been bullish altogether. No denying that as bond rates have dropped providing a great catalyst for stock price advances.

As you can see in the chart below, we have quickly reclaimed bullish territory above the 3 key moving averages for the S&P 500:

Moving Averages: 50 Day (yellow), 100 Day (orange), 200 Day (red)

Yet as we contemplate the view from small caps…it’s not as rosy. Here is the same 3 month chart with key trend lines for the Russell 2000:

Moving Averages: 50 Day (yellow), 100 Day (orange), 200 Day (red)

The aforementioned +5.44% gain for this key index on Tuesday was very promising. That’s because there is no way to feel truly bullish when all the gains are just accruing to the usual mega cap suspects formerly known as FAANG and now being called the Magnificent 7.

The mark of a truly bullish market is that there is more risk appetite leading investors to smaller, growthier companies. This also shows up in the long term advantage for small caps vs. large caps that really hasn’t been true in more than 3 years.

So yes, there are good signs for investors. That inflation and bond rates are going down which increases the odds that the Fed is at the end of their hawkish cycle. But until more of the gains show up in small caps, then we are right to be somewhat skeptical of the upside potential of this market.

Speaking of inflation, it was indeed the better than expected reading for CPI on Tuesday that was behind the impressive stock gains. That concept got an exclamation mark on Wednesday as the more forward looking PPI report showed a -0.5% decline for inflation month over month. Yes, a negative PPI reading which bodes well for future CPI and PCE readings which are what the Fed focuses on.

This explains the continued drop in Treasury rates rates…and mortgages…and auto loans…and corporate borrowing costs, which all points to a healthier economy ahead. It also points to the Fed most likely ending its hawkish rate hike regime in the not too distant future.

In fact, the widely followed FedWatch tool from the CME shows virtually NO CHANCE of another Fed rate hike given this recent news. Now the guessing game focuses on when the Fed will start lowering rates.

The odds point to a 4% chance of that occurring at the late January 2024 meeting. That increases to a 33% chance for March 20, 2024 meeting. And 42% for May 1, 2024.

Yes, the Fed is data dependent and “might” raise rates again. But they have been clear that their policy is already restrictive and has long term lagged effects.

So the market probably has this one right. That the Fed is done with rate hikes and sometime in the spring of 2024 they will start lowering rates which is beneficial to economic growth…earnings growth…and share price growth.

This says it pays to stay bullish. And it SHOULD point to the eventual outperformance in the small cap space.

Indeed, that will be the best indicator of true market health. Thus, we will keep an eye on the Russell 2000 in the hopes that it breaks above…and stays above it’s 200 day moving average that is only 3% higher than current levels.

What To Do Next?

Discover my current portfolio of 7 stocks packed to the brim with the outperforming benefits found in our POWR Ratings model. Yes, the same model that has beaten the market by more than 4X since 1999.

Plus I have added 4 ETFs that are all in sectors well positioned to outpace the market in the weeks and months ahead.

This is all based on my 43 years of investing experience seeing bull markets…bear markets…and everything between.

If you are curious to learn more, and want to see these 11 hand selected trades, then please click the link below to get started now.

Steve Reitmeister’s Trading Plan & Top Picks >

Wishing you a world of investment success!


Steve Reitmeister…but everyone calls me Reity (pronounced “Righty”)
CEO, StockNews.com and Editor, Reitmeister Total Return


SPY shares fell $0.14 (-0.03%) in after-hours trading Friday. Year-to-date, SPY has gained 19.18%, versus a % rise in the benchmark S&P 500 index during the same period.


About the Author: Steve Reitmeister

Steve is better known to the StockNews audience as “Reity”. Not only is he the CEO of the firm, but he also shares his 40 years of investment experience in the Reitmeister Total Return portfolio. Learn more about Reity’s background, along with links to his most recent articles and stock picks.

More…

The post Small Problem May Loom Large for Bull Market appeared first on StockNews.com

https://www.entrepreneur.com/finance/small-problem-may-loom-large-for-bull-market/465609