Penny Stocks To Buy For Under $1 & What To Watch Right Now

4 Penny Stocks To Buy For Under $5 In December 2021

Are penny stocks worth it? To answer that question, I’ll ask this question: Do you like to make money quickly in a high-risk setting? If you said yes, then cheap stocks are worth your time. In 2021 alone, thanks to penny stocks, we’ve seen some of the most significant moves in the market. For reference, we’re talking about stocks below $5 a share.

PennyStocks.com – PennyStocks

You can do the math yourself. While I don’t advocate focusing on how much you can make vs. how much you can lose during a trade, penny stocks are in a league of their own in many respects. Within the blink of an eye, you’ll see some random low-priced stock jump from under $5 to over $10 or more. This could happen for myriad reasons, but at the heart of it all, moves like this aren’t uncommon for penny stocks.

Today, we’re looking at a handful that not only have been volatile recently, they all trade for pennies a share. Remember, just because they trade at low prices that doesn’t mean risk factors can be ignored. So, I’ll leave it up to you to decide: Are these the penny stocks to buy right now, or should you avoid them entirely?

Penny Stocks To Buy Under $1

Gran Tierra Energy Inc.

Energy stocks remain a focus as reopening efforts continue globally. While there’s a case to be made in favor of green or renewable energy, traditional sources are actively being used right now to not only sustain economic growth but help build the alternative energy ecosystem. Gran Tierra Energy falls into this category.

– 3 Penny Stocks to Watch With Bullish Sentiment Right Now

The company specializes in oil and natural gas exploration and production via its portfolio of assets in South America. Colombia is where its primary production originates within a region responsible for production that generated $35 million last quarter.

Gran Tierra’s recent quarterly update reported strong growth, year-over-year for Q3 2021. Included in this were average total production rates that were up over 50% compared to Q3 2020 and more than 205% from the previous quarter.

What To Watch With GTE Stock

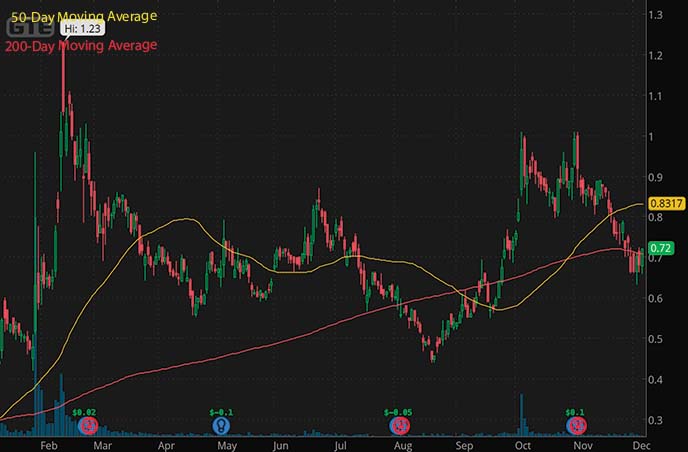
One of the things to note about GTE stock is that it has moved in the general direction of the overall energy market. Despite being one of the penny stocks under $1, shares are up more than 90% year-to-date. Considering the oil and natural gas prices have experienced a rebound recently, GTE could be on the list of penny stocks to watch right now.
penny stocks to buy under $1 Gran Tierra Energy GTE stock chart

Palatin Technologies Inc.

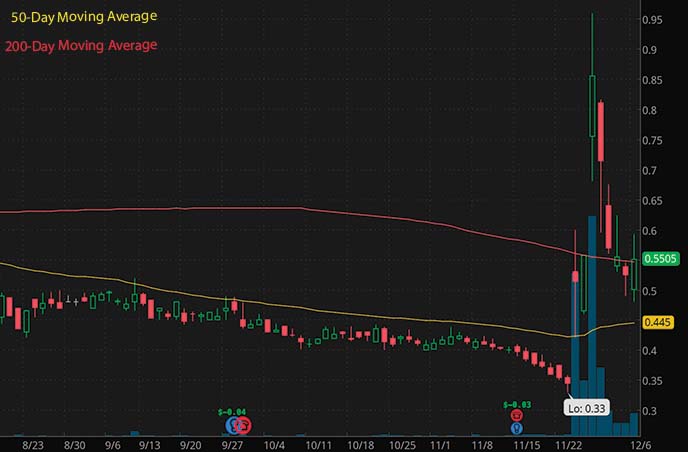
Unlike Gran Tierra, Palatin Technologies has experienced a different year-to-date move in the stock market in 2021. Even with this as the case, PTN stock is back on the watch list following a few big weeks of momentum. One of the initial catalysts came after Palatin’s recent upgrade from analysts at HC Wainwright. The firm boosted its price target to $5 following the most recent round of quarterly results.

One of the things to note is management’s commentary regarding the company’s clinical pipeline. In particular, CEO Carl Spana, Ph.D., discussed several treatments and treatment candidates, including PL9643, PL8177, and Vyleesi. Of particular note, according to HC Wainwright’s analyst, Joseph Pantginis, “PL9643 is about to begin its pivotal Phase 3 study in dry eye disease, and visibility is growing on the company’s overall differentiated melanocortin platform.”

What To Watch With PTN Stock

Meanwhile, vaccine stocks have come back into focus thanks to new concerns arising from the Omicron variant. Palatin’s PL8177 was originally in development for inflammation (things like IBS, for example). However, The company announced last year that it would begin developing the candidate as a potential treatment for COVID patients. With this, PTN stock has been one to watch over the last few weeks.
penny stocks to buy under $1 Palatin Technolgies PTN stock chart

Matinas BioPharma

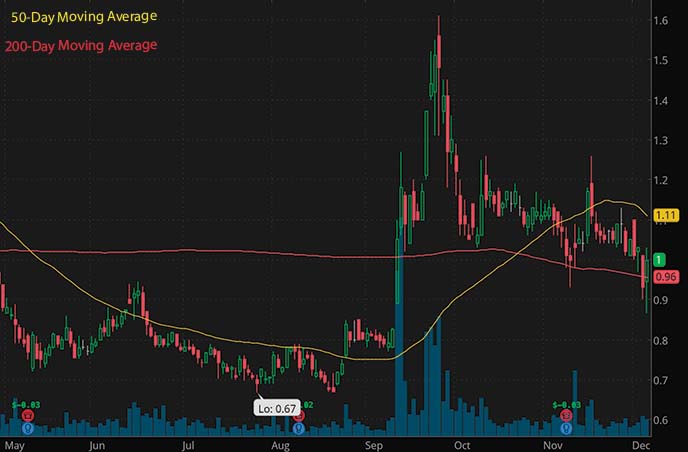
Small-cap and micro-cap biotech penny stocks have been a stronger focus for traders over the last few quarters. Aside from being smaller companies in the early stages, the potential for novel discovery isn’t an uncommon event. In the case of Matinas BioPharma, the company’s big breakthrough came toward the end of last quarter. It announced data in an ongoing trial of its MAT2203 in treating cryptococcal meningitis. Notably, patients completing induction with the treatment showed sterility after treatment, with overall survival of more than 95% in patients part of Cohort 2.

– Hot Metaverse Penny Stocks To Add To Your List In December 2021

Since then, the company has been building its leadership team. The most recent addition was announced earlier this week, with a new Chief Business Officer coming on board. According to the company, the main focus of the new CBO, Thomas Hoover, will be on advancing Matinas’ lipid nanocrystal platform.

What To Watch With MTNB Stock

Other than that, there are a few other things to pay attention to heading into year-end and the start of 2022. First, Matinas Cohort 3 of its MAT2203 study has enrolled the majority of patients. A Data and Safety Monitoring Board evaluation and cohort progression assessment are anticipated before the end of 2021.

The company has also said it plans on meeting with the FDA this month to review data to date and discuss potential approval for the treatment as a step-down therapy from IV amphotericin B. You’ve also got Matinas’ Phase 1 trial dosing MAT2501 in patients with nontuberculous mycobacterial infections. Enrollment is expected to finish next quarter, with data anticipated during Q2 of 2022. Finally, Matinas is conducting an in vivo efficacy study of LNC remdesivir in collaboration with the National Institute of Allergy and Infectious Diseases in cooperation with Gilead Sciences. Data is expected this quarter.

With plenty of potential events to keep track of, MTNB stock could be one of the names to know right now.
penny stocks to buy under $1 Matinas BioPharma MTNB stock chart

Agile Therapeutics

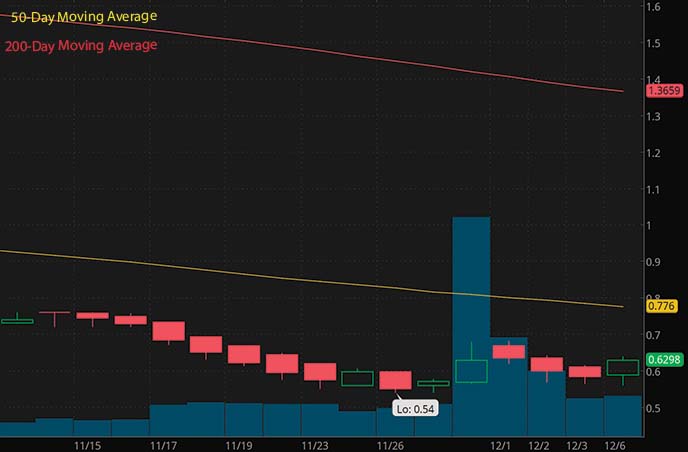
Like PTN, AGRX stock hasn’t experienced the greatest year-to-date trend in 2021. However, the last few weeks have seen an uptick in bullish momentum. Since hitting 52-week lows of $0.54 at the end of November, AGRX stock has bounced back above $0.60. One of the core points of focus for the market has been on analyst sentiment surrounding Agile. Of the most recent firms to cover the company this year, Oppenheimer, Royal Bank Of Canda, Maxim Group, and HC Wainwright have placed Buy or equivalent ratings on AGRX. Furthermore, the firms all carry price targets ranging from $1.03 to $6 right now.

Agile Therapeutics is a women’s healthcare company. Its product portfolio includes platforms designed to offer contraception without taking a daily pill. The company’s Twirla product, for example, is a transdermal patch for drug delivery through the skin. According to the company’s most recent quarterly report, Twirla refill rates continue growing at a rate of more than 80% during Q3.

What To Watch With AGRX Stock

Considering Twirla’s growth, this product will likely become a focus during the end of the year. Earlier this quarter, California’s Medicaid program, Medi-Cal, placed Twirla on the preferred drug formulary list. It secured positioning in a program providing healthcare to roughly 15 million beneficiaries, according to the company. Agile explained in its Q3 update that it also began activating a branded influencer program to increase awareness for the product.
penny stocks to buy under $1 Agile Therapeutics AGRX stock chart

Are Cheap Penny Stocks On Your List Right Now?

Whether you’re looking for quick gains or early opportunities, penny stocks can offer plenty of choices. The main thing to remember is that there are many risks involved. In light of this, your plan and strategy should be at the forefront no matter the price of the penny stocks you’re looking to buy or sell.

https://www.entrepreneur.com/article/401204



Should You Buy the Post Earnings Dip in DocuSign?

You’re reading Entrepreneur United States, an international franchise of Entrepreneur Media. This story originally appeared on StockNews

Software company DocuSign’s (DOCU) shares lost nearly 42% in price on December 3 and hit their 52-week low of $131.51. But can the stock rebound based on the company’s dominant market position and consistent product and services solutions? Let’s find out.

shutterstock.com – StockNews

Cloud-based software provider DocuSign, Inc. (DOCU) is known primarily for its DocuSign eSignature solution and Agreement Cloud. The San Francisco-based company witnessed massive demand for its solutions amid the COVID-19 pandemic with the heightened remote working culture. However, the stock has lost 52.3% in price over the past month to close Friday’s trading session at $135.09, after hitting its 52-week low of $131.51.

DOCU’s total revenue for its fiscal third quarter, ended October 31, 2021, increased 42.4% year-over-year to $545.46 million. Its net loss came in at $5.68 million compared to $58.49 million in the year-ago period. Also, its billings were $565.20 million, up 28% year-over-year. However, the stock declined by 42% on Friday, its biggest retreat ever, amid concerns of slowing demand for e-signatures as businesses return to their offices.

The company’s billings and revenue guidance missed expectations. Its $557 million – $563 million fourth-quarter revenue projection was below Wall Street’s expectations. Consequently, several analysts downgraded DOCU’s ratings. In addition, hedge fund’s interest in the stock has declined. So, DOCU’s near-term prospects look uncertain.

Click here to check out our Cloud Computing Industry Report for 2021

Here is what could shape DOCU’s performance in the near term:

Consistent Product and Services Innovations

In November 2021, DOCU enhanced DocuSign Notary so administrators could manage the availability of first-party notaries. The company announced an expansion of its global strategic partnership with salesforce.com, inc. (CRM) on October 27 to build new solutions to improve the customer experience of preparing, signing, and managing agreements, drive faster ROI, and increase collaboration among organizations with Slack functionality.

Ongoing Investigations

Several law firms have launched investigations against DOCU on possible securities law violations in connection with its management’s statements about its growth prospects. On September 2, DOCU and its management assured investors of continued billings and revenue growth. However, on December 2, these statements were brought into question when the company announced that it sustained a significant deceleration in billings growth during its fiscal third quarter that would continue into the fourth quarter.

Stretched Valuation

In terms of forward non-GAAP P/E, DOCU’s 68.57x is 185.2% higher than the 24.04x industry average. The stock’s 57.47x forward EV/EBITDA  is 265.5% higher than the 15.72x industry average. Furthermore, its 12.77x forward EV/S and 12.73x P/S are higher than the 4.03x and 3.94x industry averages.

POWR Ratings Reflect Uncertain Near-Term Prospects

DOCU has an overall C rating, which equates to Neutral in our POWR Ratings system. The POWR Ratings are calculated by considering 118 distinct factors, with each factor weighted to an optimal degree.

Our proprietary rating system also evaluates each stock based on eight distinct categories. DOCU has a C grade for Sentiment, which is in sync with unfavorable analysts’ sentiment.

The stock has a C grade for Momentum, consistent with its 52.3% loss over the past month and 56.4% over the past three months.

And DOCU has a D grade for Value, which is in sync with its higher-than-industry valuation ratios.

DOCU is ranked #61 of 169 stocks in the Software – Application industry. Also, click here to see the additional POWR Ratings for DOCU (Stability, Growth, and Quality).

Bottom Line

DOCU is a well-known company with more than 1,000,000 customers and hundreds of millions of users across 180 countries that use DocuSign to accelerate doing business. However, the stock is currently trading below its 50-day and 200-day moving averages of $260.96 and $251.36, respectively, indicating a downtrend. Also, the company could continue to be impacted as the demand for its solutions could decline as economies gradually recover and organizations prefer in-person meetings. So, we think it could be wise to wait before scooping up its shares.

How Does DocuSign (DOCU) Stack Up Against its Peers?

While DOCU has an overall POWR Rating of C, one might want to consider investing in Software – Application stocks with an A (Strong Buy) rating, such as Commvault Systems, Inc. (CVLT), Open Text Corporation (OTEX), and Progress Software Corporation (PRGS).

Click here to check out our Software Industry Report for 2021


DOCU shares fell $1.70 (-1.26%) in premarket trading Monday. Year-to-date, DOCU has declined -39.23%, versus a 22.46% rise in the benchmark S&P 500 index during the same period.


About the Author: Manisha Chatterjee

Since she was young, Manisha has had a strong interest in the stock market. She majored in Economics in college and has a passion for writing, which has led to her career as a research analyst.

More…

The post Should You Buy the Post Earnings Dip in DocuSign? appeared first on StockNews.com

https://www.entrepreneur.com/article/400891


Best Value Stocks to Buy for December 6th

You’re reading Entrepreneur United States, an international franchise of Entrepreneur Media. This story originally appeared on Zacks

Here are four stocks with buy rank and strong value characteristics for investors to consider today, December 6th:

– Zacks

Guild Holdings Company GHLD: This mortgage company has a Zacks Rank #1 (Strong Buy), and seen the Zacks Consensus Estimate for its current year earnings rising 28.2% over the last 60 days.

Guild Holdings has a price-to-earnings ratio (P/E) of 3.56, compared with 10.20 for the industry. The company possesses a Value Score of A.

Textainer Group Holdings Limited TGH: This company that purchases, owns, manages, leases, and disposes a fleet of intermodal containers has a Zacks Rank #1, and seen the Zacks Consensus Estimate for its current year earnings rising 8.4% over the last 60 days.

Textainer Group has a price-to-earnings ratio (P/E) of 6.15, compared with 14.20 for the industry. The company possesses a Value Score of A.

Merchants Bancorp MBIN: This diversified bank holding company has a Zacks Rank #1, and seen the Zacks Consensus Estimate for its current year earnings rising 6.4% over the last 60 days.

Merchants Bancorp has a price-to-earnings ratio (P/E) of 6.58, compared with 11.60 for the industry. The company possesses a Value Score of A.

Penske Automotive Group, Inc. PAG: This diversified transportation services company has a Zacks Rank #1, and seen the Zacks Consensus Estimate for its current year earnings rising 16.5% over the last 60 days.

Penske Automotive has a price-to-earnings ratio (P/E) of 6.97, compared with 8.40 for the industry. The company possesses a Value Score of A.

See the full list of top ranked stocks here.

Learn more about the Value score and how it is calculated here.

Investor Alert: Legal Marijuana Looking for big gains?

Now is the time to get in on a young industry primed to skyrocket from $13.5 billion in 2021 to an expected $70.6 billion by 2028.

After a clean sweep of 6 election referendums in 5 states, pot is now legal in 36 states plus D.C. Federal legalization is expected soon and that could kick start an even greater bonanza for investors. Zacks Investment Research has recently closed pot stocks that have shot up as high as +147.0%.

You’re invited to immediately check out Zacks’ Marijuana Moneymakers: An Investor’s Guide. It features a timely Watch List of pot stocks and ETFs with exceptional growth potential.

Today, Download Marijuana Moneymakers FREE >>

Want the latest recommendations from Zacks Investment Research? Today, you can download 7 Best Stocks for the Next 30 Days. Click to get this free report
 
Penske Automotive Group, Inc. (PAG): Free Stock Analysis Report
 
Textainer Group Holdings Limited (TGH): Free Stock Analysis Report
 
Merchants Bancorp (MBIN): Free Stock Analysis Report
 
Guild Holdings Company (GHLD): Free Stock Analysis Report
 
To read this article on Zacks.com click here.
 
Zacks Investment Research

https://www.entrepreneur.com/article/400881


Should Invesco Dividend Achievers ETF (PFM) Be on Your Investing Radar?

You’re reading Entrepreneur United States, an international franchise of Entrepreneur Media. This story originally appeared on Zacks

Looking for broad exposure to the Large Cap Value segment of the US equity market? You should consider the Invesco Dividend Achievers ETF (PFM), a passively managed exchange traded fund launched on 09/15/2005.

– Zacks

The fund is sponsored by Invesco. It has amassed assets over $696.59 million, making it one of the average sized ETFs attempting to match the Large Cap Value segment of the US equity market.

Why Large Cap Value

Large cap companies typically have a market capitalization above $10 billion. Considered a more stable option, large cap companies boast more predictable cash flows and are less volatile than their mid and small cap counterparts.

While value stocks have lower than average price-to-earnings and price-to-book ratios, they also have lower than average sales and earnings growth rates. Considering long-term performance, value stocks have outperformed growth stocks in almost all markets; however, they are more likely to underperform growth stocks in strong bull markets.

Costs

Investors should also pay attention to an ETF’s expense ratio. Lower cost products will produce better results than those with a higher cost, assuming all other metrics remain the same.

Annual operating expenses for this ETF are 0.53%, making it one of the more expensive products in the space.

It has a 12-month trailing dividend yield of 1.67%.

Sector Exposure and Top Holdings

While ETFs offer diversified exposure, which minimizes single stock risk, a deep look into a fund’s holdings is a valuable exercise. And, most ETFs are very transparent products that disclose their holdings on a daily basis.

This ETF has heaviest allocation to the Information Technology sector–about 17.70% of the portfolio. Healthcare and Financials round out the top three.

Looking at individual holdings, Microsoft Corp (MSFT) accounts for about 4.33% of total assets, followed by Jpmorgan Chase & Co (JPM) and Unitedhealth Group Inc (UNH).

The top 10 holdings account for about 26.31% of total assets under management.

Performance and Risk

PFM seeks to match the performance of the NASDAQ US Broad Dividend Achievers Index before fees and expenses. The NASDAQ US Broad Dividend Achievers Index is designed to identify a diversified group of dividend-paying companies which have increased their annual dividend for 10 or more consecutive fiscal years.

The ETF has added roughly 18.39% so far this year and is up about 18.60% in the last one year (as of 12/06/2021). In the past 52-week period, it has traded between $32.09 and $39.08.

The ETF has a beta of 0.86 and standard deviation of 20.05% for the trailing three-year period, making it a medium risk choice in the space. With about 350 holdings, it effectively diversifies company-specific risk.

Alternatives

Invesco Dividend Achievers ETF carries a Zacks ETF Rank of 3 (Hold), which is based on expected asset class return, expense ratio, and momentum, among other factors. Thus, PFM is a reasonable option for those seeking exposure to the Style Box – Large Cap Value area of the market. Investors might also want to consider some other ETF options in the space.

The iShares Russell 1000 Value ETF (IWD) and the Vanguard Value ETF (VTV) track a similar index. While iShares Russell 1000 Value ETF has $55.78 billion in assets, Vanguard Value ETF has $86.69 billion. IWD has an expense ratio of 0.19% and VTV charges 0.04%.

Bottom-Line

Retail and institutional investors increasingly turn to passively managed ETFs because they offer low costs, transparency, flexibility, and tax efficiency; these kind of funds are also excellent vehicles for long term investors.

To learn more about this product and other ETFs, screen for products that match your investment objectives and read articles on latest developments in the ETF investing universe, please visit Zacks ETF Center.

Want key ETF info delivered straight to your inbox?

Zacks’ free Fund Newsletter will brief you on top news and analysis, as well as top-performing ETFs, each week.

Get it free >>

Want the latest recommendations from Zacks Investment Research? Today, you can download 7 Best Stocks for the Next 30 Days. Click to get this free report
 
Invesco Dividend Achievers ETF (PFM): ETF Research Reports
 
JPMorgan Chase & Co. (JPM): Free Stock Analysis Report
 
Microsoft Corporation (MSFT): Free Stock Analysis Report
 
UnitedHealth Group Incorporated (UNH): Free Stock Analysis Report
 
Vanguard Value ETF (VTV): ETF Research Reports
 
iShares Russell 1000 Value ETF (IWD): ETF Research Reports
 
To read this article on Zacks.com click here.
 
Zacks Investment Research

https://www.entrepreneur.com/article/400884


Is Oshares U.S. Quality Dividend ETF (OUSA) a Strong ETF Right Now?

You’re reading Entrepreneur United States, an international franchise of Entrepreneur Media. This story originally appeared on Zacks

The Oshares U.S. Quality Dividend ETF (OUSA) made its debut on 07/14/2015, and is a smart beta exchange traded fund that provides broad exposure to the Style Box – Large Cap Value category of the market.

– Zacks

What Are Smart Beta ETFs?

For a long time now, the ETF industry has been flooded with products based on market capitalization weighted indexes, which are designed to represent the broader market or a particular market segment.

A good option for investors who believe in market efficiency, market cap weighted indexes offer a low-cost, convenient, and transparent way of replicating market returns.

However, some investors believe in the possibility of beating the market through exceptional stock selection, and choose a different type of fund that tracks non-cap weighted strategies: smart beta.

These indexes attempt to select stocks that have better chances of risk-return performance, based on certain fundamental characteristics or a combination of such characteristics.

While this space offers a number of choices to investors, including simplest equal-weighting, fundamental weighting and volatility/momentum based weighting methodologies, not all these strategies have been able to deliver superior results.

Fund Sponsor & Index

Managed by Oshares Etfs, OUSA has amassed assets over $739.01 million, making it one of the average sized ETFs in the Style Box – Large Cap Value. This particular fund, before fees and expenses, seeks to match the performance of the FTSE US Qual / Vol / Yield Factor 5% Capped Index.

The FTSE US Qual / Vol / Yield Factor 5% Capped Index measures the performance of publicly-listed large-capitalization and mid-capitalization dividend-paying issuers in the United States.

Cost & Other Expenses

Investors should also pay attention to an ETF’s expense ratio. Lower cost products will produce better results than those with a higher cost, assuming all other metrics remain the same.

Operating expenses on an annual basis are 0.48% for this ETF, which makes it on par with most peer products in the space.

The fund has a 12-month trailing dividend yield of 1.68%.

Sector Exposure and Top Holdings

While ETFs offer diversified exposure, which minimizes single stock risk, a deep look into a fund’s holdings is a valuable exercise. And, most ETFs are very transparent products that disclose their holdings on a daily basis.

Representing 21.90% of the portfolio, the fund has heaviest allocation to the Healthcare sector; Information Technology and Industrials round out the top three.

Looking at individual holdings, Home Depot Inc/the (HD) accounts for about 5.46% of total assets, followed by Microsoft Corp (MSFT) and Johnson & Johnson (JNJ).

OUSA’s top 10 holdings account for about 38.91% of its total assets under management.

Performance and Risk

So far this year, OUSA has added about 18.38%, and is up about 18.93% in the last one year (as of 12/06/2021). During this past 52-week period, the fund has traded between $36.96 and $44.85.

The ETF has a beta of 0.87 and standard deviation of 20.21% for the trailing three-year period, making it a medium risk choice in the space. With about 101 holdings, it effectively diversifies company-specific risk.

Alternatives

Oshares U.S. Quality Dividend ETF is a reasonable option for investors seeking to outperform the Style Box – Large Cap Value segment of the market. However, there are other ETFs in the space which investors could consider.

IShares Russell 1000 Value ETF (IWD) tracks Russell 1000 Value Index and the Vanguard Value ETF (VTV) tracks CRSP U.S. Large Cap Value Index. IShares Russell 1000 Value ETF has $55.78 billion in assets, Vanguard Value ETF has $86.69 billion. IWD has an expense ratio of 0.19% and VTV charges 0.04%.

Investors looking for cheaper and lower-risk options should consider traditional market cap weighted ETFs that aim to match the returns of the Style Box – Large Cap Value.

Bottom Line

To learn more about this product and other ETFs, screen for products that match your investment objectives and read articles on latest developments in the ETF investing universe, please visit Zacks ETF Center.

Want key ETF info delivered straight to your inbox?

Zacks’ free Fund Newsletter will brief you on top news and analysis, as well as top-performing ETFs, each week.

Get it free >>

Want the latest recommendations from Zacks Investment Research? Today, you can download 7 Best Stocks for the Next 30 Days. Click to get this free report
 
Oshares U.S. Quality Dividend ETF (OUSA): ETF Research Reports
 
Microsoft Corporation (MSFT): Free Stock Analysis Report
 
Johnson & Johnson (JNJ): Free Stock Analysis Report
 
The Home Depot, Inc. (HD): Free Stock Analysis Report
 
Vanguard Value ETF (VTV): ETF Research Reports
 
iShares Russell 1000 Value ETF (IWD): ETF Research Reports
 
To read this article on Zacks.com click here.

https://www.entrepreneur.com/article/400883


Should You Invest in the First Trust NASDAQ Clean Edge Smart Grid Infrastructure ETF (GRID)?

You’re reading Entrepreneur United States, an international franchise of Entrepreneur Media. This story originally appeared on Zacks

Looking for broad exposure to the Utilities – Infrastructure segment of the equity market? You should consider the First Trust NASDAQ Clean Edge Smart Grid Infrastructure ETF (GRID), a passively managed exchange traded fund launched on 11/16/2009.

– Zacks

An increasingly popular option among retail and institutional investors, passively managed ETFs offer low costs, transparency, flexibility, and tax efficiency; they are also excellent vehicles for long term investors.

Sector ETFs are also funds of convenience, offering many ways to gain low risk and diversified exposure to a broad group of companies in particular sectors. Utilities – Infrastructure is one of the 16 broad Zacks sectors within the Zacks Industry classification. It is currently ranked 11, placing it in bottom 31%.

Index Details

The fund is sponsored by First Trust Advisors. It has amassed assets over $765.69 million, making it one of the average sized ETFs attempting to match the performance of the Utilities – Infrastructure segment of the equity market. GRID seeks to match the performance of the NASDAQ OMX Clean Edge Smart Grid Infrastructure Index before fees and expenses.

The NASDAQ OMX Clean Edge Smart Grid Infrastructure Index includes companies that are primarily engaged and involved in electric grid, electric meters and devices, networks, energy storage and management, and enabling software used by the smart grid infrastructure sector.

Costs

Expense ratios are an important factor in the return of an ETF and in the long term, cheaper funds can significantly outperform their more expensive counterparts, other things remaining the same.

Annual operating expenses for this ETF are 0.70%, making it the most expensive product in the space.

It has a 12-month trailing dividend yield of 0.76%.

Sector Exposure and Top Holdings

Even though ETFs offer diversified exposure that minimizes single stock risk, investors should also look at the actual holdings inside the fund. Luckily, most ETFs are very transparent products that disclose their holdings on a daily basis.

Looking at individual holdings, Aptiv Plc (APTV) accounts for about 8.95% of total assets, followed by Johnson Controls International Plc (JCI) and Eaton Corporation Plc (ETN).

The top 10 holdings account for about 60.13% of total assets under management.

Performance and Risk

So far this year, GRID has gained about 24.90%, and is up roughly 33.84% in the last one year (as of 12/06/2021). During this past 52-week period, the fund has traded between $76.37 and $105.89.

The ETF has a beta of 1.18 and standard deviation of 27.39% for the trailing three-year period, making it a high risk choice in the space. With about 72 holdings, it effectively diversifies company-specific risk.

Alternatives

First Trust NASDAQ Clean Edge Smart Grid Infrastructure ETF holds a Zacks ETF Rank of 1 (Strong Buy), which is based on expected asset class return, expense ratio, and momentum, among other factors. Because of this, GRID is a great option for investors seeking exposure to the Utilities/Infrastructure ETFs segment of the market. There are other additional ETFs in the space that investors could consider as well.

IShares Global Infrastructure ETF (IGF) tracks S&P Global Infrastructure Index and the Global X U.S. Infrastructure Development ETF (PAVE) tracks INDXX U.S. Infrastructure Development Index. IShares Global Infrastructure ETF has $3.05 billion in assets, Global X U.S. Infrastructure Development ETF has $5.26 billion. IGF has an expense ratio of 0.43% and PAVE charges 0.47%.

Bottom Line

To learn more about this product and other ETFs, screen for products that match your investment objectives and read articles on latest developments in the ETF investing universe, please visit Zacks ETF Center.

Want key ETF info delivered straight to your inbox?

Zacks’ free Fund Newsletter will brief you on top news and analysis, as well as top-performing ETFs, each week.

Get it free >>

Want the latest recommendations from Zacks Investment Research? Today, you can download 7 Best Stocks for the Next 30 Days. Click to get this free report
 
First Trust NASDAQ Clean Edge Smart Grid Infrastructure ETF (GRID): ETF Research Reports
 
Johnson Controls International plc (JCI): Free Stock Analysis Report
 
Eaton Corporation, PLC (ETN): Free Stock Analysis Report
 
iShares Global Infrastructure ETF (IGF): ETF Research Reports
 
Global X U.S. Infrastructure Development ETF (PAVE): ETF Research Reports
 
Aptiv PLC (APTV): Free Stock Analysis Report
 
To read this article on Zacks.com click here.

https://www.entrepreneur.com/article/400882


Bear of the Day: Twitter (TWTR)

You’re reading Entrepreneur United States, an international franchise of Entrepreneur Media. This story originally appeared on Zacks

I last wrote about Twitter TWTR as the Bear of the Day on November 1 when shares were trading near $55.
The theme after their Q3 report in late October was a wicked earnings deterioration where analysts reacted with a 58% clear-cutting of EPS estimates from $0.94 to $0.39, mostly based on the big profit miss for the quarter.
Since then, the downward revisions have kept coming with another 64% walloping to take this year’s consensus down to just $0.14.
More importantly for the forward outlook, next year’s EPS consensus has slipped 27% from $1.22 to $0.89.
By Thanksgiving, Twitter shares had slipped to $47. But insult to injury, on Monday the 29th, CEO Jack Dorsey announced he was stepping down and shares actually rallied briefly on the news to $52.
The insta-rally didn’t last but it was sort of reminiscent of when Steve Ballmer left Microsoft.
Analysts React Again
While few analysts would attribute (or admit if they did) their earnings forecasts to whether or not @Jack is behind the wheel, several did provided updates last week.
There were a few that did comment directly on the departure…
Jefferies analyst Brent Thill said he views Jack Dorsey’s resignation and the appointments of CTO Parag Agrawal as CEO and Bret Taylor as Chairman of the Board as positives for the stock and a “step in the right direction.”

– Zacks

While he believes the new leadership could reinvigorate growth and help deliver on management’s initial FY23 goals, he still sees “plenty of hurdles to clear” for Twitter to improve on its sluggish pace of ad product innovation and reverse its stock underperformance relative to peers. Thill has a Hold rating and $70 price target on Twitter shares.
Wedbush analyst Ygal Arounian lowered the firm’s price target on Twitter to $52 from $69 and kept a Neutral rating on the shares after the company announced that co-founder and CEO Jack Dorsey will resign effective immediately and will be replaced by CTO Parag Agrawal.

Dorsey’s contributions to Twitter are undeniable and as a founder and CEO he continued to play a critical role, so his stepping down is “no minor point” in the analyst’s view.
Citi analyst Jason Bazinet lowered his price target on Twitter to $47 from $60 and kept a Neutral rating on the shares. The analyst reduced Twitter’s target multiple to more closely align with the company’s peer group.

Bazinet believes the stock’s current valuation reflects much of the revenue and margin opportunity over the next few years.
Piper Sandler analyst Thomas Champion lowered his price target on Twitter to $54 from $70 on Thursday and reiterated a Neutral rating on the shares after conducting a survey of 1,500 people in the United States to better understand the company’s usage.

Overall, user growth in the U.S. may be hampered by churn while advertising relevancy turned out better than expected and subscriptions “look appealing to a narrow audience.”

The survey suggests Twitter’s user growth opportunity in the U.S. remains as 60% of respondents have not used the platform, says the analyst. However, he believes that with gross adds and churn evenly matched in the most recent period, the “setup for Twitter’s growth looks challenging.”
Also on Thursday, UBS analyst Lloyd Walmsley assumed coverage of Twitter with a Neutral rating and price target of $50, down from $69. The company’s 2023 targets look increasingly like “a stretch” and will serve as an overhang on shares the analyst noted, though he also “sees evidence” that Twitter is executing on new product development at a faster clip than historical levels.

Walmsley concluded that consensus estimates look ambitious, but risk-reward appears balanced on the stock.
Large Twitter Investors Speak Out
In my November 1 article, I noted how Cathie Wood’s ARK Invest firm was buying TWTR shares all the way down before and after earnings from as high as $63.
Well on Tuesday, ARK bought another 1.1 million shares of TWTR at an average price under $45. This was not really a surprise given their enthusiasm for the company. But they didn’t buy anymore the rest of the week on new 52-week lows under $42, which was curious to me.
But another big bull made his views known. Elliott Investment Management chief Paul Singer made it a point to let his lieutenants publicly announce that they are “confident” in the Twitter leadership. As a very successful activist investor, it’s possible he was behind the move all the time.
Elliott released the following statement on behalf of Managing Partner Jesse Cohn and Senior Portfolio Manager Marc Steinberg regarding the leadership changes announced at Twitter…
Twitter is the leading global medium for real-time conversation and engagement, and our collaboration with Jack and the company for the past two years has been productive and effective. Twitter is now executing against an ambitious multi-year plan to dramatically increase the company’s reach and value, and we look forward to the next chapter of Twitter’s story. Having gotten to know both incoming Chairman Bret Taylor and incoming CEO Parag Agrawal, we are confident that they are the right leaders for Twitter at this pivotal moment for the company.
My Bottom Line on TWTR
I love the platform and its diverse “communities of knowledge” that encourage learning, collaboration, and often career opportunities across business, investing, science, education, and medicine. It should have a “long tail” existence and be able to monetize many aspects for years to come.
With 37% topline growth this year to breach $5 billion and a projected 22% advance next year to cross $6.2 billion, the stock now trades attractively at under 6 times sales. As soon as EPS estimates stabilize and start heading back up, TWTR will be a buy again.
The Zacks Rank will let you know.

Investor Alert: Legal Marijuana Looking for big gains?

Now is the time to get in on a young industry primed to skyrocket from $13.5 billion in 2021 to an expected $70.6 billion by 2028.

After a clean sweep of 6 election referendums in 5 states, pot is now legal in 36 states plus D.C. Federal legalization is expected soon and that could kick start an even greater bonanza for investors. Zacks Investment Research has recently closed pot stocks that have shot up as high as +147.0%.

You’re invited to immediately check out Zacks’ Marijuana Moneymakers: An Investor’s Guide. It features a timely Watch List of pot stocks and ETFs with exceptional growth potential.

Today, Download Marijuana Moneymakers FREE >>

Want the latest recommendations from Zacks Investment Research? Today, you can download 7 Best Stocks for the Next 30 Days. Click to get this free report
 
Twitter, Inc. (TWTR): Free Stock Analysis Report
 
To read this article on Zacks.com click here.
 
Zacks Investment Research

https://www.entrepreneur.com/article/400885


Buy These Strong Tech Stocks Now at Big Discounts Amid Omicron Selloff?

Selling returned to the market in a big way Friday, prolonging a wild up-and-down stretch that began on Black Friday. Constant headlines and current uncertainty surrounding the Omicron variant, alongside Jay Powell’s comments that inflation might justify faster tapering have driven the recent wave of selling and volatility.

– Zacks

The central bank had planned to end its run of stimulus-focused bond purchases by June, while leaving interest rates untouched. Ongoing supply chain bottlenecks and rising prices might force their hand much sooner. Wall Street also honed in on Powell’s suggestion that it could be time to end its ‘transitory’ phrasing.

It’s unclear what impact the new variant will have on rebounding economies and international travel. And the market reacted to those unknowns in a big way. Former high-flyers and big covid winners are getting crushed, as investors drop growth names, with tons hitting new 52-week lows.

The selling, some of which slowly began in the spring, has washed away a year’s worth of gains for many and completely recalibrated tons of longer-term tech plays that had become overheated following the massive run off the covid lows.

The S&P 500 and the Nasdaq both whipsawed around their 50-day moving averages in the last several sessions. And there could be more near-term selling, with the S&P 500 down around 4% off its highs and the Nasdaq about 7% lower after it fell 1.9% Friday.

Yet, investors with longer-term horizons can do themselves a disservice by attempting to precisely time the market. The last two years, though extraordinary, showcased the need to attempt to stay exposed and consider adding your favorite stocks at discounts when you can. This is what the Wall Street heavyweights do.

Here are a few strong technology names investors might want to consider buying amid the downturn if they plan on holding the stocks for a long time…

Zacks Investment ResearchImage Source: Zacks Investment Research

CrowdStrike CRWD

CrowdStrike is a cloud-focused cybersecurity firm that utilizes machine learning and AI to protect endpoints and cloud workloads. This is crucial in a cloud age full of rapidly expanding endpoints that include laptops, desktops, smartphones, IoT devices, and more. CRWD has expanded in the last year through acquisitions, as it aims to bolster its offerings in a world where hacking and cyber security breaches cost trillions of dollars annually.

CrowdStrike went public in 2019 and its revenue soared 93% during its first full year (FY20) before it surged another 82% during its fiscal 2021. CrowdStrike just beat our Q3 FY22 estimates on December 1 and executives raised their full-year guidance.

CrowdStrike’s new subscription customers jumped 75% last quarter to roughly 14,687, with those that pay for four or more modules up 68%. Zacks consensus estimates call for its revenue to climb another 64% to $1.43 billion and then pop nearly 40% higher next year to reach $1.96 billion. And these estimates could improve as analysts update their guidance.

Investors might not love to see the projected slowdown in terms of percentage growth. But CrowdStrike’s top-line expansion is still impressive, with it expected to pull in over $500 million more in annual sales next year, or more than it did in all of FY20. 

Zacks Investment ResearchImage Source: Zacks Investment Research

Meanwhile, CrowdStrike’s adjusted earnings are projected to surge 78% this year and another 69% to come in at $0.82 a share in FY23. The company has also consistently topped our EPS estimates, including a 70% beat in its recently-reported quarter.

CRWD lands a Zacks Rank #3 (Hold) at the moment, alongside “B” grades for Growth and Momentum in our Style Scores system. Plus, 16 of the 21 brokerage recommendations Zacks has for CrowdStrike are “Strong Buys,” with two more “Buys” and only one below a “Hold.” And fitting with today’s topic, the stock is trading well off its high and at a huge discount to its price targets.

CrowdStrike has plummeted 35% from its records on November 10, which included a 6% dive Friday that had it hovering at $197 per share. The stock is not yet at 52-week lows, but it’s trading where it was in mid-December 2020. Its lightning quick down pushed it well below both its 50-day and 200-day moving averages and into oversold RSI territory (30 or under) at 26.

CrowdStrike shares are still up 250% in the past two years to destroy its industry’s 30% climb. And the pullback could see both long-term buyers and technical-focused traders jump in sooner than later. The stock is also trading at roughly 18-month lows at 25.5X forward 12-month sales. This might still be too expensive for many. But for those looking to scoop up a growth tech name trading nearly 60% below its current Zacks consensus price target, CRWD could be worth considering.

Mastercard Incorporated MA

Mastercard is a global payments powerhouse that operates consumer and business-centric credits card, as well as an elaborate backend processing network. The company in recent years has bolstered its fintech offerings and MA is poised to make a splash in the cryptocurrency world. Mastercard is currently working to integrate and make it easier for crypto players to connect to its network.

Mastercard’s cryptocurrency efforts include “signing up a number of new crypto wallet providers and exchanges” in Q3. Plus, it acquired in October security and fraud monitoring firm CipherTrace for its “expertise, technologies, and insights into more than 900 cryptocurrencies.” MA also made a deal with Bakkt at the end of October to help “enable consumers to buy, sell and hold cryptocurrency, deliver unique, crypto-centric loyalty opportunities, and streamline issuance of branded crypto debit and credit cards.”

On top of that, MA is prepared to enter the red-hot ‘buy now, pay later’ space with its recently announced Mastercard Installments offering. The company said it’s set to stand out in the growing market because it “enables banks, lenders, fintechs and wallets to seamlessly bring buy-now-pay-later solutions to consumers and merchants at scale.” The move could be pivotal as the space grows in popularity with a younger generation of consumers.

MA topped our Q3 estimates on Oct. 28 amid solid domestic spending and its cross-border unit returned to pre-pandemic levels. More recently, the company on November 30 announced that it raised its quarterly dividend by 11%. Investors should also be pleased to know that MA’s board authorized an additional $8 billion share repurchase program at the same time.  

Mastercard revenue did take a hit last year, as people cut back on spending, especially on travel. Luckily, it’s already bounced back in a big way and Zacks estimates call for its FY21 revenue to climb 23% to outpace its pre-pandemic total by $2 billion. It is then projected to jump another 20% in FY22 to reach $22.49 billion in sales.

Zacks Investment ResearchImage Source: Zacks Investment Research

Meanwhile, its adjusted earnings are expected to climb by 29% and 27%, respectively and it has consistently topped our bottom-line estimates. Even with all of the positives, Mastercard stock has fallen nearly 20% from its April records, including a 13% decline since mid-November.

MA stock showcased some life in the last few days and even popped 0.60% during regular hours Friday. The recent positivity could mean Wall Street’s not that worried about a downturn in global travel. Plus, Mastercard trades 33% below its current Zacks consensus price target of $427 a share. And 18 of the 23 brokerage recommendations Zacks has are “Strong Buys” with nothing below a “Hold.”

Mastercard currently lands Zacks Rank #3 (Hold) and its stock has climbed over 200% in the last five years to blow away its industry and its sector. The recent downturn has also readjusted its valuation, with it trading right near year-long lows at 31.2X forward 12-month earnings. This also represents solid value compared to the 37.1X it traded at right before the initial covid selloff.

Zacks’ Top Picks to Cash in on Artificial Intelligence

In 2021, this world-changing technology is projected to generate $327.5 billion in revenue. Now Shark Tank star and billionaire investor Mark Cuban says AI will create “the world’s first trillionaires.” Zacks’ urgent special report reveals 3 AI picks investors need to know about today.

See 3 Artificial Intelligence Stocks With Extreme Upside Potential>>

Want the latest recommendations from Zacks Investment Research? Today, you can download 7 Best Stocks for the Next 30 Days. Click to get this free report
 
Mastercard Incorporated (MA): Free Stock Analysis Report
 
CrowdStrike (CRWD): Free Stock Analysis Report
 
To read this article on Zacks.com click here.
 
Zacks Investment Research

https://www.entrepreneur.com/article/400777


Levi Strauss (LEVI) Stock Moves -0.71%: What You Should Know

You’re reading Entrepreneur United States, an international franchise of Entrepreneur Media. This story originally appeared on Zacks

Levi Strauss (LEVI) closed the most recent trading day at $25.20, moving -0.71% from the previous trading session. This move was narrower than the S&P 500’s daily loss of 0.85%. Meanwhile, the Dow lost 0.17%, and the Nasdaq, a tech-heavy index, lost 0.05%.

– Zacks

Prior to today’s trading, shares of the jeans maker had lost 5.93% over the past month. This has lagged the Retail-Wholesale sector’s loss of 2.48% and the S&P 500’s loss of 0.97% in that time.

Wall Street will be looking for positivity from Levi Strauss as it approaches its next earnings report date. The company is expected to report EPS of $0.40, up 100% from the prior-year quarter. Meanwhile, the Zacks Consensus Estimate for revenue is projecting net sales of $1.68 billion, up 21.14% from the year-ago period.

Any recent changes to analyst estimates for Levi Strauss should also be noted by investors. Recent revisions tend to reflect the latest near-term business trends. As such, positive estimate revisions reflect analyst optimism about the company’s business and profitability.

Based on our research, we believe these estimate revisions are directly related to near-team stock moves. We developed the Zacks Rank to capitalize on this phenomenon. Our system takes these estimate changes into account and delivers a clear, actionable rating model.

Ranging from #1 (Strong Buy) to #5 (Strong Sell), the Zacks Rank system has a proven, outside-audited track record of outperformance, with #1 stocks returning an average of +25% annually since 1988. Within the past 30 days, our consensus EPS projection remained stagnant. Levi Strauss is currently a Zacks Rank #2 (Buy).

Valuation is also important, so investors should note that Levi Strauss has a Forward P/E ratio of 16.79 right now. Its industry sports an average Forward P/E of 11.96, so we one might conclude that Levi Strauss is trading at a premium comparatively.

The Retail – Apparel and Shoes industry is part of the Retail-Wholesale sector. This industry currently has a Zacks Industry Rank of 73, which puts it in the top 29% of all 250+ industries.

The Zacks Industry Rank includes is listed in order from best to worst in terms of the average Zacks Rank of the individual companies within each of these sectors. Our research shows that the top 50% rated industries outperform the bottom half by a factor of 2 to 1.

You can find more information on all of these metrics, and much more, on Zacks.com.

Infrastructure Stock Boom to Sweep America

A massive push to rebuild the crumbling U.S. infrastructure will soon be underway. It’s bipartisan, urgent, and inevitable. Trillions will be spent. Fortunes will be made.

The only question is “Will you get into the right stocks early when their growth potential is greatest?”

Zacks has released a Special Report to help you do just that, and today it’s free. Discover 7 special companies that look to gain the most from construction and repair to roads, bridges, and buildings, plus cargo hauling and energy transformation on an almost unimaginable scale.

Download FREE: How to Profit from Trillions on Spending for Infrastructure >>

Want the latest recommendations from Zacks Investment Research? Today, you can download 7 Best Stocks for the Next 30 Days. Click to get this free report
 
Levi Strauss & Co. (LEVI): Free Stock Analysis Report
 
To read this article on Zacks.com click here.
 
Zacks Investment Research

https://www.entrepreneur.com/article/400780


Canon (CAJ) Gains As Market Dips: What You Should Know

You’re reading Entrepreneur United States, an international franchise of Entrepreneur Media. This story originally appeared on Zacks

In the latest trading session, Canon (CAJ) closed at $22.46, marking a +1.26% move from the previous day. The stock outpaced the S&P 500’s daily loss of 0.85%. Elsewhere, the Dow lost 0.17%, while the tech-heavy Nasdaq lost 0.05%.

– Zacks

Coming into today, shares of the office machine company had lost 4.15% in the past month. In that same time, the Computer and Technology sector lost 0.5%, while the S&P 500 lost 0.97%.

Investors will be hoping for strength from Canon as it approaches its next earnings release. The company is expected to report EPS of $0.42, down 14.29% from the prior-year quarter. Meanwhile, our latest consensus estimate is calling for revenue of $9.26 billion, down 2.45% from the prior-year quarter.

CAJ’s full-year Zacks Consensus Estimates are calling for earnings of $1.74 per share and revenue of $32.62 billion. These results would represent year-over-year changes of +128.95% and +8.48%, respectively.

Any recent changes to analyst estimates for Canon should also be noted by investors. These revisions typically reflect the latest short-term business trends, which can change frequently. As a result, we can interpret positive estimate revisions as a good sign for the company’s business outlook.

Based on our research, we believe these estimate revisions are directly related to near-team stock moves. We developed the Zacks Rank to capitalize on this phenomenon. Our system takes these estimate changes into account and delivers a clear, actionable rating model.

Ranging from #1 (Strong Buy) to #5 (Strong Sell), the Zacks Rank system has a proven, outside-audited track record of outperformance, with #1 stocks returning an average of +25% annually since 1988. The Zacks Consensus EPS estimate has moved 0.95% lower within the past month. Canon currently has a Zacks Rank of #3 (Hold).

Valuation is also important, so investors should note that Canon has a Forward P/E ratio of 12.75 right now. Its industry sports an average Forward P/E of 16.32, so we one might conclude that Canon is trading at a discount comparatively.

Meanwhile, CAJ’s PEG ratio is currently 12.75. The PEG ratio is similar to the widely-used P/E ratio, but this metric also takes the company’s expected earnings growth rate into account. Office Automation and Equipment stocks are, on average, holding a PEG ratio of 12.75 based on yesterday’s closing prices.

The Office Automation and Equipment industry is part of the Computer and Technology sector. This group has a Zacks Industry Rank of 73, putting it in the top 29% of all 250+ industries.

The Zacks Industry Rank gauges the strength of our industry groups by measuring the average Zacks Rank of the individual stocks within the groups. Our research shows that the top 50% rated industries outperform the bottom half by a factor of 2 to 1.

You can find more information on all of these metrics, and much more, on Zacks.com.

Infrastructure Stock Boom to Sweep America

A massive push to rebuild the crumbling U.S. infrastructure will soon be underway. It’s bipartisan, urgent, and inevitable. Trillions will be spent. Fortunes will be made.

The only question is “Will you get into the right stocks early when their growth potential is greatest?”

Zacks has released a Special Report to help you do just that, and today it’s free. Discover 7 special companies that look to gain the most from construction and repair to roads, bridges, and buildings, plus cargo hauling and energy transformation on an almost unimaginable scale.

Download FREE: How to Profit from Trillions on Spending for Infrastructure >>

Want the latest recommendations from Zacks Investment Research? Today, you can download 7 Best Stocks for the Next 30 Days. Click to get this free report
 
Canon, Inc. (CAJ): Free Stock Analysis Report
 
To read this article on Zacks.com click here.

https://www.entrepreneur.com/article/400778