3 Defensive Stock Picks for a Resilient Portfolio

Defense companies are expected to benefit from the rising geopolitical tensions as countries ramp up their defense budgets. Therefore, fundamentally strong defense stocks Huntington Ingalls Industries (HII), RTX Corporation (RTX), and Lockheed Martin (LMT) could be wise portfolio additions now. Read more….

Increasing worries over geopolitical instability have led to significant attention to defense stocks. The recent assault on Israel by the militant group Hamas has heightened tensions in the Middle East. Defense companies should benefit as countries increase their defense spending amid rising geopolitical tensions.

Therefore, it could be prudent to buy fundamentally strong defense stocks Huntington Ingalls Industries, Inc. (HII), RTX Corporation (RTX), and Lockheed Martin Corporation (LMT) to give your portfolio some resilience.

Before diving deeper into the fundamentals of these stocks, let’s discuss why the defense industry is expected to perform well.

We live in an increasingly polarized world, and military flashpoints have become common globally. This has necessitated the need for nations to shore up their defenses against all types of threats. Security is now one of the most important political discussions around the world.

Last year, a war broke out between Ukraine and Russia, pushing countries to announce higher spending on defense. Countries worldwide spent a combined $2.24 trillion on their militaries in 2022, representing a rise of 3.7% year-over-year. The United States’ military spending stood at $877 billion.

On October 7, 2023, an armed conflict broke out between the militant group Hamas and Israel. Many anticipate the conflict to spill over into the neighboring Middle Eastern countries. With the war between Israel and Hamas, JPMorgan Chase CEO Jamie Dimon said, “now may be the most dangerous time the world has seen in decades.”

He believes the war may have far-reaching impacts on energy and food markets, global trade and geopolitical relationships. Amid such geopolitical conflicts, defense companies are well-positioned to make money.

LMT Chairman, President and CEO Jim Taiclet said, “In the longer term, there are some things that are changing significantly. One is the global threat environment and the geopolitical situations getting more concerning and challenging. That’s refocusing the U.S. and certainly our allies around the world on national defense in an increasing manner.”

The global aerospace and defense market is projected to grow at a CAGR of 5.9% to reach $1.08 trillion.

Considering these conducive trends, let’s take a look at the fundamentals of the three Air/Defense Services stock picks, starting with number 3.

Stock #3: Huntington Ingalls Industries, Inc. (HII)

HII engages in designing, building, overhauling, and repairing military ships. It operates through three segments: Ingalis, Newport News, and Mission Technologies. The company is involved in designing and constructing non-nuclear ships comprising amphibious assault ships, and expeditionary warfare ships; for the U.S. Navy and U.S. Coast Guard. It also offers nuclear-power ships, such as aircraft carriers and submarines.

On October 17, 2023, HII announced that its Mission Technologies division was a $244 million task order to integrate Minotaur software products into maritime platforms for the U.S. Navy, U.S. Marine Corps, and U.S. Coast Guard.

On October 11, 2023, HII announced that its Mission Technologies division was awarded a contract to build nine small unmanned undersea vehicles (SUUV) for the U.S. Navy’s Lionfish System program. The contract can grow to as many as 200 vehicles over the next five years with a total value of more than $347 million.

HII’s revenue grew at a CAGR of 6.9% over the past three years. Its EBITDA grew at a CAGR of 3% over the past three years. In addition, its total assets grew at a CAGR of 9.7% in the same time frame.

HII’s sales and service revenues for the second quarter ended June 30, 2023, increased 4.7% year-over-year to $2.79 billion. Its operating income came in at $156 million. The company’s net earnings stood at $130 million. Also, its EPS came in at $3.27.

Street expects HII’s revenue for the quarter ended September 30, 2023, to increase 3.3% year-over-year to $2.71 billion. Its EPS for the quarter ending December 31, 2023, is expected to increase 44.4% year-over-year to $4.43. It surpassed the consensus EPS estimates in three of the trailing four quarters. Over the past month, the stock has gained 7.6% to close the last trading session at $216.34.

HII’s POWR Ratings reflect this positive outlook. It has an overall rating of B, which translates to a Buy in our proprietary rating system. The POWR Ratings assess stocks by 118 different factors, each with its own weighting.

Within the Air/Defense Services industry, it is ranked #19 out of 70 stocks. It has a B grade for Value and Momentum. Click here to see the additional ratings of HII for Growth, Stability, Sentiment, and Quality.

Stock #2: RTX Corporation (RTX)

RTX is an aerospace and defense company providing systems and services for commercial, military, and government customers worldwide. It operates through four segments: Collins Aerospace, Pratt & Whitney, Raytheon Intelligence & Space, and Raytheon Missiles & Defense.

RTX’s revenue grew at a CAGR of 13.3% over the past three years. Its EBITDA grew at a CAGR of 18.8% over the past three years. In addition, its EBIT grew at a CAGR of 25.5% in the same time frame.

For the fiscal second quarter ended June 30, 2023, RTX’s sales rose 12.3% over the prior-year quarter to $18.32 billion. Its non-GAAP net income increased 10% year-over-year to $1.90 billion. In addition, its adjusted EPS came in at $1.29, representing an increase of 11.2% year-over-year.

For the quarter ended September 30, 2023, RTX’s EPS and revenue are expected to increase 0.7% and 7.4% year-over-year to $1.22 and $18.20 billion, respectively. It surpassed the Street EPS estimates in each of the trailing four quarters. Over the past month, the stock has gained 2.2% to close the last trading session at $73.13.

RTX’s POWR Ratings reflect solid prospects. It has an overall rating of B, translating to Buy in our proprietary rating system.

It is ranked #18 in the same industry. It has a B grade for Growth, Momentum, Stability, and Sentiment. To see the other ratings of RTX for Value and Quality, click here.

Stock #1: Lockheed Martin Corporation (LMT)

LMT is a security and aerospace company that conducts research, design, development, manufacture, integration, and sustainment of technology systems, products, and services worldwide. It operates through four segments: Aeronautics, Missiles and Fire Control, Rotary and Mission Systems, and Space.

On October 19, 2023, The Republic of the Philippines Department of National Defense announced the acquisition of three new C-130J-30 Super Hercules tactical airlifters from LMT through Direct Commercial Sale.

On October 10, 2023, LMT announced that it was awarded a contract to develop and deliver up to four 300 kW-class laser weapon systems to the U.S. Army’s Indirect Fire Protection Capability-High Energy Laser (IFPC-HEL) prototype program.

LMT’s EBITDA grew at a CAGR of 1.9% over the past three years. Its net income grew at a CAGR of 2.1% over the past three years. In addition, its EPS grew at a CAGR of 5.7% in the same time frame.

LMT’s net sales for the third quarter ended September 24, 2023, increased 1.8% year-over-year to $16.88 billion. The company’s non-GAAP net earnings came in at $1.70 billion. Also, its adjusted EPS came in at $6.77. In addition, its total consolidated operating profit stood at $2.04 billion.

Analysts expect LMT’s revenue for the quarter ending March 31, 2024, to increase 4.2% year-over-year to $15.75 billion. Its EPS for fiscal 2024 is expected to increase 0.6% year-over-year to $26.72. It surpassed the consensus EPS estimates in each of the trailing four quarters. Over the past month, the stock has gained 7.9% to close the last trading session at $446.16.

LMT’s strong fundamentals are reflected in its POWR Ratings. It has an overall rating of B, translating to Buy in our proprietary rating system.

It is ranked #12 in the Air/Defense Services industry. It has a B grade for Momentum, Stability, and Quality. Click here to see the other ratings of LMT for Growth, Value, and Sentiment.

What To Do Next?

Get your hands on this special report with 3 low priced companies with tremendous upside potential even in today’s volatile markets:

3 Stocks to DOUBLE This Year >


LMT shares were trading at $448.27 per share on Tuesday morning, up $2.11 (+0.47%). Year-to-date, LMT has declined -6.03%, versus a 11.92% rise in the benchmark S&P 500 index during the same period.


About the Author: Dipanjan Banchur

Since he was in grade school, Dipanjan was interested in the stock market. This led to him obtaining a master’s degree in Finance and Accounting. Currently, as an investment analyst and financial journalist, Dipanjan has a strong interest in reading and analyzing emerging trends in financial markets.

More…

The post 3 Defensive Stock Picks for a Resilient Portfolio appeared first on StockNews.com

https://www.entrepreneur.com/finance/3-defensive-stock-picks-for-a-resilient-portfolio/464202



2 Metal Stocks to Buy Today, 1 to Watch Closely

Despite the current challenges clouding the metal industry’s growth prospects, it looks well positioned to grow in the long run due to the growing investments in infrastructure and the ongoing transition to clean energy. Therefore, buying fundamentally strong metal stocks ESAB Corporation (ESAB) and Gibraltar Industries (ROCK) could be wise. On the other hand, investors could look for an opportune entry point in Freeport-McMoRan (FCX). Read more….

Despite the uncertain macroeconomic environment, the long-term outlook for the metal industry looks promising. The demand for metals is expected to be driven by the rapid transition toward clean energy across different sectors and economies, investments by the government to build and repair existing infrastructure, etc.

Given this backdrop, investors could consider buying fundamentally strong metal stocks ESAB Corporation (ESAB) and Gibraltar Industries, Inc. (ROCK). Additionally, one could closely watch Freeport-McMoRan Inc. (FCX) for an appropriate entry point.

The metal industry is highly cyclical, but the demand for metals is expected to be strong in the long run due to investments in infrastructure development. Countries are increasingly investing in expanding and upgrading their infrastructure.

The Bipartisan Infrastructure Investment and Jobs Act (IIJA) has allocated $550 billion in new federal spending over the next five years. These investments to improve infrastructure will likely boost the demand for metals. Additionally, the ongoing shift to sustainable options across power generation, automobiles, consumer electronics, battery storage, etc., will drive the demand for a wide range of minerals and metals.

Due to the ongoing transition to clean energy, the market for minerals vital to achieving sustainability standards reached $320 billion last year. The International Energy Agency (IEA) has estimated that the global economy will require six times more minerals and metals in 2040 than today to reach net zero by 2050.

Despite the impressive long-term growth prospects, metal demand is expected to remain subdued in the near term due to the slowing demand from China, where manufacturing has contracted, and the property market has stalled. Liberum analyst Tom Price said, “For the first time in over two decades, China’s materials-intensive growth cycle is unresponsive to government-led macro-support.”

Moreover, with interest rates likely to stay higher for longer, there could be a contraction in metal demand. Furthermore, the militant group Hamas and Israel’s clashes will likely cloud the sector’s near-term outlook.

Considering these factors, buying fundamentally strong metal stocks ESAB and ROCK could be wise. Meanwhile, investors could watch FCX for an opportune entry point.

Stocks to Buy:

ESAB Corporation (ESAB)

ESAB engages in formulating, developing, manufacturing, and supplying consumable products and equipment for use in cutting, joining, and automated welding; and control equipment. The company’s equipment ranges from portable welding machines to large, customized automated cutting and welding systems. It also offers a range of software and digital solutions.

On July 12, 2023, ESAB announced that it had entered into a new partnership with GRI Renewable Industries to collaborate on green projects, helping them fulfill their goal of running a sustainable business. The partnership will leverage each company’s expertise in the fabrication and wind power industries to drive initiatives such as the transition to green energy and the reduction of each company’s environmental footprint.

In terms of the trailing-12-month net income margin, ESAB’s 7.83% is 26.4% higher than the 6.19% industry average. Likewise, its 16.87% trailing-12-month EBITDA margin is 24.8% higher than the industry average of 13.52%. Furthermore, the stock’s 7.22% trailing-12-month levered FCF margin is 30% higher than the industry average of 5.56%.

ESAB’s net sales for the second quarter ended June 30, 2023, increased 9% year-over-year to $720.42 million. Its adjusted net income from continuing operations rose 13.2% over the prior year quarter to $78.10 million. Also, its adjusted net income per share came in at $1.28, representing an increase of 12.3% year-over-year. In addition, its adjusted EBITDA increased 19.5% year-over-year to $132.10 million.

Analysts expect ESAB’s EPS and revenue for the quarter ended September 30, 2023, to increase 1.3% and 9% year-over-year to $0.93 and $628.98 million, respectively. It surpassed the consensus EPS estimates in each of the trailing four quarters. Over the past year, the stock has gained 95% to close the last trading session at $68.63.

ESAB’s POWR Ratings reflect solid prospects. It has an overall rating of B, equating to a Buy in our proprietary rating system. The POWR Ratings assess stocks by 118 different factors, each with its own weighting.

It has a B grade for Momentum and Sentiment. It is ranked #5 out of 32 stocks in the Industrial – Metals industry. Click here to see the other ratings of ESAB for Growth, Value, Stability, and Quality.

Gibraltar Industries, Inc. (ROCK)

ROCK manufactures and distributes building products for the renewable energy, residential, agtech, and infrastructure markets in North America and Asia. It operates through four segments: Renewables, Residential, Agtech, and Infrastructure.

In terms of the trailing-12-month EBIT margin, ROCK’s 11.08% is 13.7% higher than the 9.74% industry average. Likewise, its 6.56% trailing-12-month net income margin is 5.9% higher than the industry average of 6.19%. Furthermore, the stock’s 1.08x trailing-12-month asset turnover ratio is 32.6% higher than the industry average of 0.81x.

For the fiscal second quarter that ended June 30, 2023, ROCK’s net sales came in at $364.91 million. Its adjusted net income rose 15.2% year-over-year to $36.30 million. Also, its adjusted EPS came in at 1.18, representing an increase of 22.9% year-over-year.

Street expects ROCK’s EPS for the quarter ended September 30, 2023, to increase 6.3% year-over-year to $1.19. Its revenue for the same quarter is expected to increase marginally year-over-year to $391.33 million. It surpassed the Street EPS estimates in three of the trailing four quarters. Over the past year, the stock has gained 43.6% to close the last trading session at $65.06.

ROCK’s positive outlook is reflected in its POWR Ratings. It has an overall rating of A, translating to a Strong Buy in our proprietary rating system.

Within the same industry, it is ranked #4. It has an A grade for Momentum and Sentiment and a B for Quality. To see the other ratings of ROCK for Growth, Value, and Stability, click here.

Stock to Watch:

Freeport-McMoRan Inc. (FCX)

FCX engages in the mining of mineral properties in North America, South America, and Indonesia. It primarily explores for copper, gold, molybdenum, silver, and other metals, as well as oil and gas. The company’s assets include the Grasberg minerals district in Indonesia; Morenci, Bagdad, Safford, Sierrita, and Miami in Arizona; Tyrone and Chino in New Mexico; and Henderson and Climax in Colorado, Cerro Verde in Peru and El Abra in Chile.

In terms of the trailing-12-month net income margin, FCX’s 9.63% is 48% higher than the 6.51% industry average. Likewise, its 35.35% trailing-12-month EBITDA margin is 108.9% higher than the industry average of 16.92%. Furthermore, the stock’s 19.04% trailing-12-month Capex/Sales is 170.4% higher than the industry average of 7.04%.

On the other hand, FCX’s 1.85% trailing-12-month levered FCF margin is 50% lower than the 3.70% industry average. Likewise, its 0.43x trailing-12-month asset turnover ratio is 40% lower than the 0.72x industry average.

FCX’s revenues for the fiscal second quarter ended June 30, 2023, increased 5.9% year-over-year to $5.74 billion. Its adjusted net income attributable to common stock declined 41.5% year-over-year to $500 million. Also, its adjusted EPS came in at $0.35, representing a decline of 39.7% year-over-year.

For the quarter ended September 30, 2023, FCX’s EPS and revenue are expected to increase 35.8% and 10.8% year-over-year to $0.35 and $5.55 billion, respectively. It surpassed the consensus EPS estimates in three of the trailing four quarters. Over the past year, the stock has gained 24% to close the last trading session at $36.67.

FCX’s bleak prospects are reflected in its POWR Ratings. It has an overall rating of C, which translates to Neutral in our proprietary rating system.

Within the Industrial – Metals industry, it is ranked #12. It has a C grade for Growth, Value, Momentum, Stability, and Sentiment. Click here to see FCX’s rating for Quality.

What To Do Next?

43 year investment veteran, Steve Reitmeister, has just released his 2024 market outlook along with trading plan and top 11 picks for the year ahead.

2024 Stock Market Outlook >


FCX shares fell $0.17 (-0.46%) in premarket trading Monday. Year-to-date, FCX has declined -2.86%, versus a 12.86% rise in the benchmark S&P 500 index during the same period.


About the Author: Dipanjan Banchur

Since he was in grade school, Dipanjan was interested in the stock market. This led to him obtaining a master’s degree in Finance and Accounting. Currently, as an investment analyst and financial journalist, Dipanjan has a strong interest in reading and analyzing emerging trends in financial markets.

More…

The post 2 Metal Stocks to Buy Today, 1 to Watch Closely appeared first on StockNews.com

https://www.entrepreneur.com/finance/2-metal-stocks-to-buy-today-1-to-watch-closely/463347


Earnings Watch: Is Walgreens Boots Alliance (WBA) a Solid Buy Before Earnings?

Retail drugstore chain Walgreens Boots Alliance (WBA) achieved adjusted EPS growth on solid sales increase in the third quarter of fiscal 2023. However, the company lowered its full-year earnings guidance to reflect challenging consumer and macro conditions and lower COVID-19 demand. So, let’s determine if WBA is a buy before its earnings release. Read more….

Walgreens Boots Alliance, Inc. (WBA), an integrated healthcare, pharmacy, and retail leader, beat revenue analyst expectations for its fiscal 2023 third quarter. The company reported a revenue of $35.42 billion, above the consensus revenue estimate of $34.12 billion and up 8.6% year-over-year due to sales growth in its retail pharmacy and healthcare segments.

WBA’s U.S. retail pharmacy segment generated around $28 billion in sales for the quarter, an increase of 4.4% year-over-year. Also, its pharmacy sales grew 6.3% compared to the same quarter of 2022. However, the company posted an adjusted earnings per share of $1 versus $1.07 expected by analysts.

The retail pharmacy chain’s earnings fell short of Wall Street expectations for the first time since July 2020 due to weakened consumer spending and a drop in demand for COVID-19 vaccines and testing.

WBA is scheduled to release its fourth quarter and fiscal 2023 results at 7 a.m. ET on Thursday, October 12, 2023. Due to challenging consumer and macroeconomic conditions, the drugstore chain slashed its earnings guidance to a range of $4 to $4.05 per share for the full year, down from its prior forecast of $4.45 to $4.65 per share.

The fourth quarter will likely be negatively impacted by a higher effective tax rate, shifting U.S. consumer spending, and a weaker respiratory season for U.S. Retail Pharmacy and U.S. Healthcare. Despite the challenges, the company expects adjusted operating income growth to accelerate in the fourth quarter from 0.6% in the third quarter.

In September, Rosalind Brewer abruptly stepped down as a chief executive of WBA after nearly two and a half years when the pharmacy group’s valuation halved, and it abandoned a planned sale of its UK-based retail chain.

Ginger Graham, a board member since 2010 and former chief of Amylin Pharmaceuticals, took the chief executive role while the company is looking for “a successor with deep healthcare experience.”

Despite its bleak near-term outlook, Walgreens has the right turnaround strategy to drive sustainable core growth and deliver long-term shareholder value. WBA announced an increase to its Transformational Cost Management Program target from $3.50 billion to $4.10 billion in total savings.

Also, the company is taking immediate actions to optimize profitability for its U.S. Healthcare segment, including an increased and accelerated synergy target for VillageMD/Summit Health of $200 million by calendar 2026.

Shares of WBA have declined 39% over the past six months and 41.4% year-to-date to close the last trading session at $21.81. The stock is currently trading 48.4% below its 52-week high of $42.29, which it hit on December 13, 2022.

Here’s what could influence WBA’s performance in the upcoming months:

Positive Latest Development

On September 12, WBA and Pearl Health announced a partnership to advance value-based care in collaboration with community-based primary care physicians. The company’s partnership with Pearl Health allows it to reach more communities faster, enabling comprehensive, affordable care that enhances long-term health outcomes and fosters healthier communities.

Mixed Financials  

WBA’s sales increased 8.6% year-over-year to $35.42 billion for the third quarter ended May 31, 2023. Its gross profit came in at $6.59 billion, up marginally year-over-year. However, the company’s operating loss widened 33.3% from the year-ago value to $172 million. Its adjusted EBITDA loss worsened 6.6% year-over-year to $113 million.

Furthermore, adjusted net earnings attributable to WBA came in at $860 million, up 3.1% year-over-year, and its adjusted net earnings per common share increased 4.2% from the prior year’s quarter to $1. But WBA’s cash and cash equivalents stood at $871 million as of May 31, 2023, compared to $1.36 billion as of August 31, 2022.

Mixed Historical Growth

WBA’s revenue and total assets grew at respective CAGRs of 2.7% and 4.5% over the past three years. However, the company’s EBITDA decreased at a CAGR of 17.1% over the same timeframe. Also, its normalized net income and levered free cash flow declined at CAGRs of 16.3% and 26.4%, respectively, over the same period.

Disappointing Analyst Estimates

Analysts expect WBA’s revenue to increase 7.3% year-over-year to $34.82 billion for the fourth quarter that ended August 2023. However, the consensus earnings per share estimate of $0.69 for the to-be-reported quarter indicates a 14% year-over-year decline. The company has surpassed the consensus revenue estimate in each of the trailing four quarters.

In addition, Street expects WBA’s revenue and EPS for the fiscal year 2023 to increase 4.4% and decrease 20.7% from the previous year to $138.50 billion and $4, respectively. The company’s revenue and EPS for fiscal year 2024 are expected to grow 4.2% and decline 6.6% year-over-year to $144.31 billion and $3.73, respectively.

Mixed Profitability

WBA’s trailing-12-month asset turnover ratio of 1.42x is 56.4% higher than the industry average of 0.91x. However, the stock’s trailing-12-month gross profit and EBITDA margins of 19.84% and 2.10% are lower than the respective industry averages of 32.90% and 11.43%.

Moreover, the stock’s trailing-12-month net income margin of negative 2.24% compares unfavorably to the industry average of 4.16%. Its trailing-12-month ROCE and ROTA of negative 14.01% and negative 3.36% are lower than the industry averages of 11.68% and 4.52%, respectively.

Mixed Valuation

In terms of forward non-GAAP P/E, WBA is currently trading at 5.45x, 67.6% lower than the industry average of 16.84x. The stock’s forward EV/Sales of 0.46x is 72.5% lower than the industry average of 1.68x. Likewise, its forward Price/Sales multiple of 0.14 is 86.8% lower than the industry average of 1.03.

However, the stock’s forward EV/EBITDA and EV/EBIT of 11.44x and 16.17x are higher than the industry averages of 10.93x and 14.86x, respectively.

POWR Ratings Reflect Uncertainty

WBA’s mixed fundamentals are reflected in its POWR Ratings. The stock has an overall C rating, equating to Neutral in our proprietary rating system. The POWR Ratings are calculated by considering 118 distinct factors, with each factor weighted to an optimal degree.

Our proprietary rating system also evaluates each stock based on eight distinct categories. The stock has a C grade for Value and Quality, consistent with its mixed valuation and profitability, respectively.

Within the Medical – Drug Stores industry, WBA is ranked #3 out of 5 stocks.

Beyond what I have stated above, we have also given WBA grades for Sentiment, Stability, Growth, and Momentum. Get all WBA’s POWR Ratings here.

Bottom Line  

Despite a challenging operating environment, WBA achieved solid sales growth in the last reported quarter as consumers continued to appreciate the value, convenience, and range of services provided by Walgreens and Boots. However, lower demand for COVID-related services, a more cautious consumer, and a weaker respiratory season led to margin pressures during the quarter.

Furthermore, the company’s revised full-year 2023 guidance reflects consumer spending uncertainty and other macroeconomic conditions.

Given its mixed financials, mixed valuation and profitability, and bleak near-term prospects, it could be wise to hold WBA and wait for a better entry point in the stock.

Stocks to Consider Instead of Walgreens Boots Alliance, Inc. (WBA)

Given its uncertain short-term prospects, the odds of WBA outperforming in the weeks and months ahead are compromised. However, there are many industry peers with much more impressive POWR Ratings. So, consider these three A-rated (Strong Buy) or B-rated (Buy) medical stocks instead:

UnitedHealth Group Inc. (UNH)

CVS Health Corporation (CVS)

Cigna Corporation (CI)

To explore more A and B-rated medical stocks, click here.

What To Do Next?

43 year investment veteran, Steve Reitmeister, has just released his 2024 market outlook along with trading plan and top 11 picks for the year ahead.

2024 Stock Market Outlook >


WBA shares fell $0.11 (-0.50%) in premarket trading Monday. Year-to-date, WBA has declined -38.87%, versus a 13.57% rise in the benchmark S&P 500 index during the same period.


About the Author: Mangeet Kaur Bouns

Mangeet’s keen interest in the stock market led her to become an investment researcher and financial journalist. Using her fundamental approach to analyzing stocks, Mangeet’s looks to help retail investors understand the underlying factors before making investment decisions.

More…

The post Earnings Watch: Is Walgreens Boots Alliance (WBA) a Solid Buy Before Earnings? appeared first on StockNews.com

https://www.entrepreneur.com/finance/earnings-watch-is-walgreens-boots-alliance-wba-a-solid/463342


3 Big Reasons Why We Shorted Oil Stocks-How We Did It-And Why We Just Covered

Shorting overbought and overhyped oil and oil stocks (XLE) with a levered up but lower cost inverse oil stock ETF (ERY).

Certainly, markets overall have been volatile and chaotic recently. The recent push past 4.5% on the 10-year Treasury yield seems to be the main catalyst for taking stocks lower and interest rates higher.

Even oil prices weren’t immune as the price of crude dropped sharply from over $93 barrel to end September to under $83 barrel to end the first week of October.

The siren calls for oil going to $130 or even $150 by many of the experts proved once again to be misplaced. Sounded very much like similar prognostications back in 2008 when predictions of oil hitting $200 barrel proved wildly wrong.

Whenever the chatter gets this hyperbolic, it is almost invariably an opportune time to take a position contrary to the prevailing calls. That’s exactly what we did just recently with a short-term bearish trade in oil stocks.

Why We Did It

Both the price of oil and oil stocks (XLE) hit an extreme in mid-September. The chart below shows the XLE over the past year. You can see how once again shares had reached overbought levels as highlighted in blue. 9-day RSI was nearly 80. Bollinger Percent B was over 100. MACD was at an extreme. XLE was trading at a big premium to the 20-day moving average. Previous times all these indicators aligned in a similar fashion marked significant short-term tops in XLE.

Crude oil prices exhibited similar overbought readings. But we chose to short oil stocks instead of oil simply because oil stocks had had an even greater rally than oil itself recently. A comparative chart below illustrates that point.

You can see how oil stocks (XLE) and oil moved in pretty much unison until a little over a year ago. Makes sense since oil and oil stocks should be fairly well correlated. Since then, oil stocks have rallied sharply while oil itself has actually fallen. Indeed, XLE was up 4 times as much as West Texas Intermediate Crude ($WTIC) over the past two years.

We expected oil stocks to begin to converge back to oil prices over the near term, which is why we chose to short the stocks like ExxonMobil and Chevron that make up the XLE over shorting physical oil itself.

How We Did It

Rather than short XLE, which can expensive and risky, we chose instead to use an inverse ETF that increases in value if XLE falls. In fact, the inverse ETF we ultimately selected increases at a faster percentage rate (2 times) versus the drop in XLE. The ETF we picked was ERY. Description from the Direxion website shown below:

The Direxion Daily Energy Bear 2X Shares seeks daily investment results, before fees and expenses of 200% of the inverse (or opposite) the performance of the Energy Select Sector Index (XLE). There is no guarantee the funds will meet their stated investment objectives.

So, we were able to buy ERY at under $25 rather than having the margin requirement of shorting XLE of almost $50 (1/2 the price of XLE is the initial short requirement). In essence, half the monetary commitment. Plus, get twice the potential return (albeit with twice the potential loss). Important to remember that these levered ETF products are specifically designed for shorter term investments rather than longer term buy-and-hold. This fits our typical trade time frame as well.

Why We Covered

The chart below shows ERY over the past year. Notice how it moves pretty much in an opposite manner to the XLE chart, but to a greater magnitude. While oil and oil stocks (XLE) hit oversold readings on Thursday, ERY concomitantly got to overbought levels at the same time.

We went long ERY at $24.02 on 9/11/2023 and subsequently exited the position on 10/5/2023 at $27.50. Net gain on the trade was 14.49% with a holding period of less than a month.

Compare those returns to shorting oil, which dropped just over 5% in the same time frame. Oil stocks (XLE) dropped about 7% over that period.

As anticipated, oil stocks did worse than oil. Using ERY as a way to leverage up the gains on a drop in oil stocks work just as expected with double the gain.

Not all trades work out this well or this quickly. But for traders looking to put the odds in their favor, combining technical analysis along with examining correlation performance, plus using alternative approaches, can put the odds in your favor.

At the end of the day, profitable trading is all about percentages, not certainty.

POWR Options

What To Do Next?

If you’re looking for the best options trades for today’s market, you should check out our latest presentation How to Trade Options with the POWR Ratings. Here we show you how to consistently find the top options trades, while minimizing risk.

If that appeals to you, and you want to learn more about this powerful new options strategy, then click below to get access to this timely investment presentation now:

How to Trade Options with the POWR Ratings

All the Best!

Tim Biggam

Editor, POWR Options Newsletter


XLE shares closed at $85.73 on Friday, up $0.51 (+0.60%). Year-to-date, XLE has gained 0.64%, versus a 13.57% rise in the benchmark S&P 500 index during the same period.


About the Author: Tim Biggam

Tim spent 13 years as Chief Options Strategist at Man Securities in Chicago, 4 years as Lead Options Strategist at ThinkorSwim and 3 years as a Market Maker for First Options in Chicago. He makes regular appearances on Bloomberg TV and is a weekly contributor to the TD Ameritrade Network “Morning Trade Live”. His overriding passion is to make the complex world of options more understandable and therefore more useful to the everyday trader. Tim is the editor of the POWR Options newsletter. Learn more about Tim’s background, along with links to his most recent articles.

More…

The post 3 Big Reasons Why We Shorted Oil Stocks-How We Did It-And Why We Just Covered appeared first on StockNews.com

https://www.entrepreneur.com/finance/3-big-reasons-why-we-shorted-oil-stocks-how-we-did-it-and/463320


Investor Alert: Hidden Gem for Stocks Found in Friday Report

Stocks have been pressing lower of late as the bond rates continue to rise. This had the S&P 500 (SPY) dangerously close to the 200 day moving average. Yet hidden in the Friday Government Employment report was a clue that sparked a rally and maybe puts an end to recent market weakness. Read on below for full details….

Right now the most important thing on investor’s minds is the dramatic rise in bond rates, and how that makes stocks less attractive. I tackled that subject pretty thoroughly in my previous commentary this week. Be sure it read now if you haven’t already:

When is the Stock Bouncing Coming?

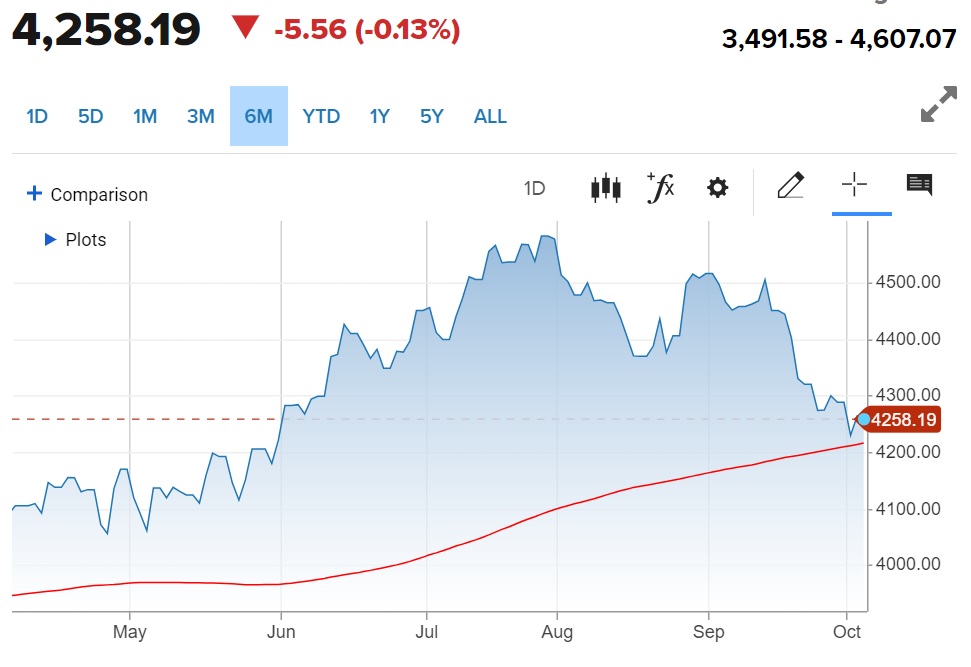
The quick answer to the above question, is that the bounce could be forming now as stock flirt with the 200 day moving average at 4,206 for the S&P 500 (SPY). That is the red line in the chart below.

On the fundamental front, if rates keep ripping higher, then it will only put more pressure on stock prices. I sense that 5% is a logical top for 10 year rates…but who says that the market is logical?

Also note on the fundamental end of things that the economic reports continue to come in positive. Even 20 months into the most aggressive Fed rate hiking regime in history, GDP estimates continue to be robust.

GDP Now has it their Q3 estimate all the way up to +4.9% bolstered by the most recent ISM Manufacturing report. Further, the Blue Chip Economist panel sees +2.9% as the more logical growth trajectory.

If I were to place a bet in Vegas I would say the Economists are much closer to the final number. Regardless, it is hard to look at these results and see a recession coming…and therefore it is hard to be truly bearish.

On top of that the Government Employment Situation report came out Friday morning much hotter than expected. Since so much of the initial market reaction is based on just reading the headline…then yes stocks sold off early in the session.

Gladly, as prudent investors dug into the details they discovered a hidden gem in the report. That being month over month wage inflation down to only 0.2% which means we are ebbing ever closer to the 2% inflation target for the Fed as this “sticky” form of inflation becomes unstuck at such high levels.

As this new spread…so too did the stock gains. As I put this commentary to rest with 90 minutes left in the Friday session we have a +1.4% result for the S&P 500 and nicely above recently resistance at 4,300.

Back to the big picture conversation about higher rates….

Yes, stock prices are down of late as “rates normalize” to more traditional historic levels. Meaning we are no longer enjoying the artificially low rates we that have been in hand the past 15 years.

Once everyone makes this adjustment to the new world view of rates…and realize the world is not falling apart…they will be compelled to put their money into the best stocks. And maybe Friday’s rally is an early sign of that taking place.

So, which are those best stocks, you ask?

Read on below for the answer…

What To Do Next?

Discover my brand new “2024 Stock Market Outlook” covering:

  • Bear Case vs. Bull Case
  • Trading Plan to Outperform
  • What Industries Are Hot…Which Are Not?
  • Top 11 Picks for the Year Ahead
  • And Much More!

Gain access to this vital presentation now by clicking below:

2024 Stock Market Outlook >

Wishing you a world of investment success!


Steve Reitmeister…but everyone calls me Reity (pronounced “Righty”)
CEO, StockNews.com and Editor, Reitmeister Total Return


SPY shares were trading at $430.05 per share on Friday afternoon, up $5.55 (+1.31%). Year-to-date, SPY has gained 13.70%, versus a % rise in the benchmark S&P 500 index during the same period.


About the Author: Steve Reitmeister

Steve is better known to the StockNews audience as “Reity”. Not only is he the CEO of the firm, but he also shares his 40 years of investment experience in the Reitmeister Total Return portfolio. Learn more about Reity’s background, along with links to his most recent articles and stock picks.

More…

The post Investor Alert: Hidden Gem for Stocks Found in Friday Report appeared first on StockNews.com

https://www.entrepreneur.com/finance/investor-alert-hidden-gem-for-stocks-found-in-friday-report/463306


Stock Market vs. Bond Rate Relationship Revealed

The stock market is affected by many things like the Fed and the economy. However, there is not enough talk about how the movement of bond rates makes stocks more or less attractive. Like how the S&P 500 (SPY) is having a terrible September as bond rates explode higher. Learn more about this dynamic relationship and what it means for stock prices in the days ahead.

Investors have long appreciated the relationship that when rates go up…stocks go down.

That was a prime catalyst behind the 2022 bear market. Yet investors were encouraged in 2023 that inflation was coming under control…and thus rates would head lower in the future. This had stocks back on the rise for the majority of the year.

Then on 9/20 the Fed said “NOT SO FAST!” which had rates spiking again…and investors fleeing stocks.

Did that story take a turn for the better on Thursday?

Let’s review in this week’s commentary.

Market Commentary

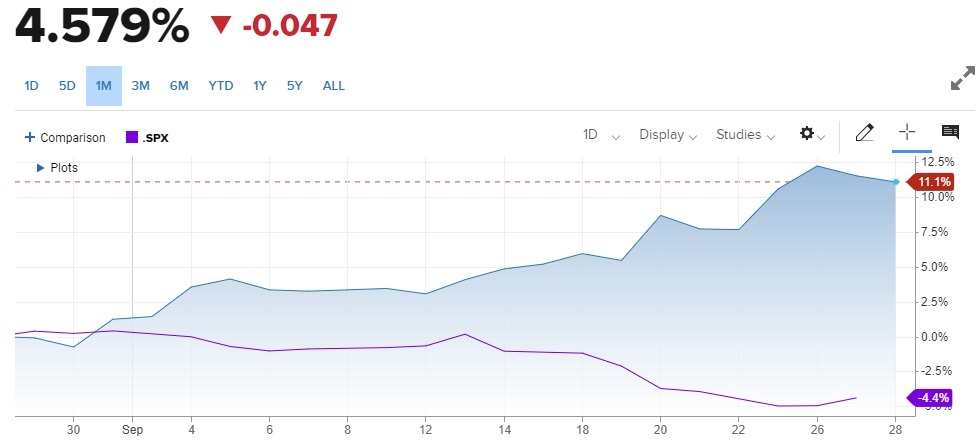
The best place to start our conversation is with this 1 month chart showing the rise of the 10 Year Treasury rate vs. the decline of the S&P 500 (SPY):

The inverse relationship is quite apparent. As rates accelerated higher later in the month…the stock decline accelerated as well.

The reasons behind the higher rates was explained in detail in my commentary after the 9/20 Fed announcement. Here is the core section for our discussion today:

“…Nutshell of the Wednesday Fed announcement.

The economy is doing better than we expected…so it’s going to take a bit longer to bring down inflation to target level…the good news is that we really believe we can do it without creating a recession.

So why did stocks go down on this seemingly positive outlook?

Because the dot plot of rate expectations by Fed officials now has the end of 2024 rate still way up at 5.1%. That was revised higher from the previous estimate of 4.6%.

Yes, this most certainly fits in with the Fed narrative of “higher rates for longer”, but much longer and higher than investors previously anticipated.”

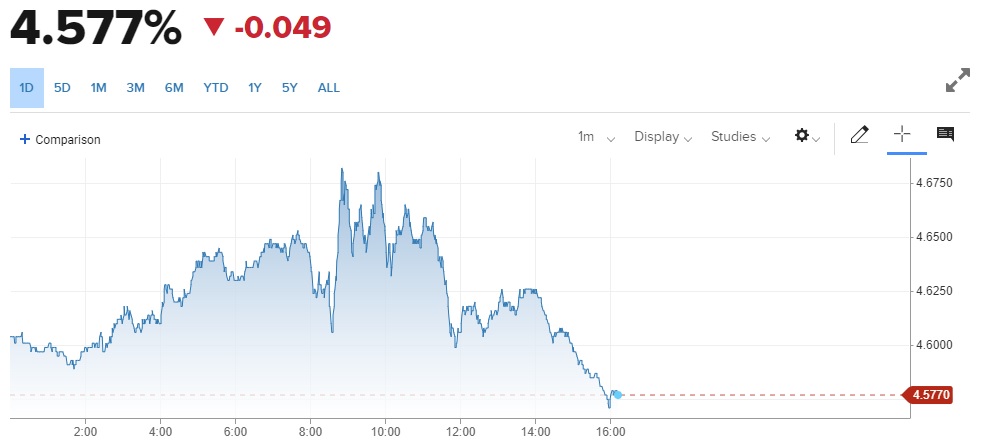
Now let’s narrow in on what happened with 10 year Treasury rates on Thursday:

This one day chart shows how rates continued to spike early in the session Thursday up towards a high of 4.688%. Yet dramatically reversed course ending the session down at 4.577%. That also helped stocks enjoy one of their best sessions in a while. (The bond sell off extended into Friday which increases the odds we have seen peak rates).

Please remember that rates were down around 3.8% just a couple months ago. This is a dramatic move that may have finally run its course. If so, then it helps improve the odds that we have made a bottom with stocks moving higher from here.

The biggest surprise I see with the recent rise in bond rates is how the likelihood of a rate hike at the November 1st Fed meeting has dropped from 62% just a month ago to only 19% as of today. Further the idea of a raise happening by the December 13th meeting has declined to 36%.

This information just doesn’t jive with Fed statements in September which seemed to indicate strong likelihood of at least one more hike. Nor does it jive with soaring bond rates. Again, perhaps another clue that the rally in bond rates is overextended and ready to retreat which is good for stocks.

Pulling back to the big picture it is very hard to have a bear market without a recession forming. And right now the odds of that are fairly low.

That is why I believe that this sell off is finding a bottom around current levels. And perhaps no further than the 200 day moving average closing in on 4,200. That is the downside possibility.

Whereas the upside potential this year has us retesting the highs of 4,600 seen in late July. And then next year likely cracking above 5,000.

Thus, I recommend staying fully invested in this market. The key to success is picking the best investments. And that is what we will cover in the next section…

What To Do Next?

Discover my brand new “2024 Stock Market Outlook” covering:

  • Bear Case vs. Bull Case
  • Trading Plan to Outperform
  • Top 11 Picks for the Year Ahead
  • And Much More!

Gain access to this vital presentation now by clicking below:

2024 Stock Market Outlook >

Wishing you a world of investment success!


Steve Reitmeister…but everyone calls me Reity (pronounced “Righty”)
CEO, StockNews.com and Editor, Reitmeister Total Return


SPY shares were trading at $430.78 per share on Friday morning, up $2.26 (+0.53%). Year-to-date, SPY has gained 13.89%, versus a % rise in the benchmark S&P 500 index during the same period.


About the Author: Steve Reitmeister

Steve is better known to the StockNews audience as “Reity”. Not only is he the CEO of the firm, but he also shares his 40 years of investment experience in the Reitmeister Total Return portfolio. Learn more about Reity’s background, along with links to his most recent articles and stock picks.

More…

The post Stock Market vs. Bond Rate Relationship Revealed appeared first on StockNews.com

https://www.entrepreneur.com/finance/stock-market-vs-bond-rate-relationship-revealed/462959


2024 Stock Market Outlook

The time to think about the 2024 stock market is now. Will it be a bull or bear? Where does the S&P 500 (SPY) end the year? And what are the top picks to outperform? Investment veteran Steve Reitmeister does his level best to answer all these questions. Just read on below.

Tell me if you see the pattern…

2019 Bull Market

2020 Bear Market

2021 Bull Market

2022 Bear Market

2023 Bull Market

Given the above, the logical question on everyone’s mind should be…Will the bear market come back again in 2024?

This led to me record a brand new presentation this week that covers vital topics including:

  • Bear Case
  • Bull Case
  • And the Winner Is???
  • Trading Plan to Outperform
  • Top 10 Picks Right now
  • Pick #11 Coming Monday Morning
  • And Much More!

Gain access to this vital presentation now by clicking below:

2024 Stock Market Outlook >


Let me pull back the curtain on this presentation just a little more so you can appreciate why now is the perfect time to watch this presentation…

The goal was to give you a running head start to outperform in the year ahead.

If it sounds early to do that now please realize that most of the market is run by institutions. And they plan out several months in advance.

So if you are not thinking of 2024 right now…you are behind the curve.  

First off, we need to settle the bull vs. bear debate.

Will it follow the on/off pattern of the last few years?

Or will new market dynamics create a shift in the outcome?

And where does the S&P 500 (SPY) end up by years end?

The Fed is most certainly a big part of that market outlook equation. And to be honest, it has become a more complicated riddle of late…but solving that puzzle is truly the key to outperformance in the year ahead.

Next up we need to review which stock groups are likely to lead the way:

  • Large Caps vs. Small Caps?
  • Growth or Value Stocks?
  • Tech Still in Charge…Or Time for Others to Shine?

Considering the above led me to my current portfolio of 11 hand selected trades (4 ETFs and 7 stocks focused on the groups most likely to outperform).

All this and more awaits you in my new presentation. So please click below to start watching now:

2024 Stock Market Outlook >

Wishing you a world of investment success!

Steve Reitmeister
…but everyone calls me Reity (pronounced “Righty”)
CEO StockNews.com & Editor of Reitmeister Total Return


SPY shares were trading at $431.60 per share on Friday morning, up $3.08 (+0.72%). Year-to-date, SPY has gained 14.11%, versus a % rise in the benchmark S&P 500 index during the same period.


About the Author: Steve Reitmeister

Steve is better known to the StockNews audience as “Reity”. Not only is he the CEO of the firm, but he also shares his 40 years of investment experience in the Reitmeister Total Return portfolio. Learn more about Reity’s background, along with links to his most recent articles and stock picks.

More…

The post 2024 Stock Market Outlook appeared first on StockNews.com

https://www.entrepreneur.com/finance/2024-stock-market-outlook/462952


PayPal (PYPL) vs. Enova International (ENVA): Which Financial Stock Is the Better Value Buy?

Driven by sustained demand and rapid adoption of digital technology, the financial services industry’s prospects appear appealing. Also, financial companies generally benefit from a high-interest rate environment. Amid this backdrop, let’s compare financial stocks PayPal (PYPL) and Enova International (ENVA) to determine the better buy for Value. Read more….

In this article, I evaluated two financial services stocks, PayPal Holdings, Inc. (PYPL) and Enova International, Inc. (ENVA), to determine which has the potential for better returns. We believe ENVA is the better buy for Value for reasons explained throughout this piece.

Financial organizations provide several consumer financial services, including current and savings accounts, online payment options, credit and debit cards, mortgage and commercial loans, insurance, and investment management. Solid consumer spending and business investment activity drive demand for these financial services.

As per a report by BlueWeave Consulting, the global consumer finance market size is expected to grow at a CAGR of 7.1%, reaching a value of $1.96 trillion by 2029. The quick clearance of loan requests from government and private banks or financial institutions and the easy accessibility of several loans like vehicle, house, or personal loans should boost the market’s growth.

Expanding access to credits and loans through digital payment systems is also expected to provide the consumer financial services market with abundant development prospects.

Moreover, the COVID-19 pandemic has boosted the global surge in the use of digital payments, creating high-growth opportunities for financial companies. The digital payments market size in terms of transaction value was valued at $8.40 trillion in 2022 and is projected to register a CAGR of 16.5% between 2023 and 2032.

The digital payments market growth is driven by various factors, including the increasing adoption of mobile devices, providing a larger user base for digital payment platforms, convenience and accessibility, enhanced security measures, and favorable government initiatives.

Also, emerging digital technologies are transforming every aspect of the financial industry landscape. With most financial services companies transitioning to the cloud, Artificial Intelligence (AI) and Machine Learning (ML) are widely adopted with applications including task automation, predictive analytics, fraud detection, credit risk management, customer support, and algorithmic trading.

Moreover, financial institutions generally benefit from rising interest rates as their profit margins expand as rates climb. In July, the Federal Reserve approved a 25 basis points (bps) hike, raising the benchmark fed funds rate target range to 5.25% – 5.5%, the highest level in nearly 22 years.

While the Fed held interest rates steady at its meeting in September, it signaled one more rate hike before the end of the year as the inflation rate is still above its target of 2%.

Given the industry’s bright prospects, financial services providers PYPL and ENVA are expected to benefit significantly.

ENVA is a clear winner in six-month price performance, with 15.1% returns compared to PYPL’s 21.8% decline. ENVA has surged 30.1% over the past nine months, while PYPL plunged 16.1%. In addition, ENVA’s 71.8% gain over the past year compared to PYPL’s decline of 33.1%.

Here are the reasons why we think ENVA could perform better in the near term:

Latest Developments

On August 7, PYPL launched a U.S. dollar-denominated stablecoin, PayPal USD (PYUSD). PayPal USD is designed to contribute to the opportunity stablecoins provide for payments and is 100% backed by U.S. dollar deposits, short-term U.S. Treasuries, and similar cash equivalents. It can be redeemed 1:1 for U.S. dollars.

“Our commitment to responsible innovation and compliance, and our track record delivering new experiences to our customers, provides the foundation necessary to contribute to the growth of digital payments through PayPal USD,” said Dan Schulman, PYPL’s president and CEO.

On September 26, ENVA announced consent solicitation for its outstanding 8.5% senior notes due 2025.

Given the strength of its balance sheet, its consistently solid financial performance since the notes were initially issued, and a significant improvement in its financial risk profile, the company is requesting additional flexibility from the holders of the notes to increase its ability to make restricted payments in connection with share repurchases and for other corporate purposes.

Recent Financial Results

PYPL’s net revenues increased 7.1% year-over-year to $7.29 billion for the second quarter that ended June 30, 2023. Its non-GAAP operating income grew 19.8% year-over-year to $1.56 billion. The company’s non-GAAP net income stood at $1.29 billion or $1.16 per share, compared to $1.08 billion or $0.93 per share in the same quarter of 2022.

However, PYPL’s adjusted free cash flow was $869 million, down 19.2% year-over-year. As of June 30, 2023, the company’s cash and cash equivalents have reduced to $5.50 billion, compared to $7.78 billion as of December 31, 2022.

During the second quarter that ended June 30, 2023, ENVA’s revenue increased 22.4% year-over-year to $499.43 million. The company’s income from operations rose 24.7% from the year-ago value to $111.60 million. Its adjusted EBITDA grew 23.7% from the prior year’s quarter to $126.46 million.

Furthermore, the company’s adjusted earnings came in at $55.27 million and $1.72 per share, compared to $54.92 million and $1.64 per share in the previous year’s period, respectively. As of June 30, 2023, its total assets amounted to $3.91 billion, compared to $3.25 billion as of June 30. 2022.

Past And Expected Financial Performance

PYPL’s revenue and EBITDA have grown at CAGRs of 14.1% and 14.4% over the past three years, respectively, while its net income has increased at a CAGR of 16.4%. In addition, the company’s EPS has grown at a CAGR of 18.1% over the same period. However, its levered free cash flow has declined at a 6.2% CAGR over the same time frame.

Analysts expect PYPL’s revenue and EPS for the fiscal year (ending December 2023) to increase 8.2% and 19.8% year-over-year to $29.77 billion and $4.95, respectively. Also, the company’s revenue and EPS for the fiscal year 2024 are expected to grow 8.8% and 14.5% from the previous year to $32.38 billion and $5.66, respectively.

Over the past three years, ENVA’s revenue and net income have grown at 6.8% and 88.7% CAGRs, respectively. The company’s EPS has increased at a CAGR of 89.5% over the same time frame, while its total assets have grown at a 35.3% CAGR.

For the current fiscal year (ending December 2023), ENVA’s revenue and EPS are expected to grow 19.6% and 11.5% from the prior year to $2.08 billion and $7.59, respectively. Furthermore, analysts expect the company’s revenue and EPS for the fiscal year 2024 to increase 14% and 18.5% year-over-year to $2.37 billion and $9, respectively.

Valuation

In terms of trailing-12-month non-GAAP P/E, ENVA is currently trading at 6.80x, 46.3% lower than PYPL, which is trading at 12.67x. ENVA’s trailing-12-month Price/Sales multiple of 1.48 is lower than PYPL’s 2.34. Also, ENVA’s trailing-12-month Price to Book and Price/Cash Flow of 1.18x and 1.35x compared to PYPL’s 3.30x and 14.99x, respectively.

Thus, ENVA is relatively more affordable.

Profitability

PYPL’s trailing-12-month revenue is 28.3 times what ENVA generates. However, ENVA is more profitable, with a trailing-12-month gross profit margin of 81.54% compared to PYPL’s 41.30%. Additionally, ENVA’s trailing-12-month net income margin of 19.92% is higher than PYPL’s 14.27%.

In addition, ENVA’s trailing-12-month Return on Assets (ROA) of 8.59% is favorably higher than PYPL’s 4.97%.

POWR Ratings

PYPL has an overall rating of C, which equates to a Neutral in our proprietary POWR Ratings system. Conversely, ENVA has an overall rating of B, which translates to a Buy. The POWR Ratings are calculated considering 118 different factors, with each factor weighted to an optimal degree.

Our proprietary rating system also evaluates each stock based on eight distinct categories. PYPL has a grade of C for Value, in sync with its mixed valuation. In terms of forward EV/Sales, the stock is trading at 2.16x, 25.5% lower than the 2.90x industry average. However, its forward non-GAAP P/E multiple of 11.91 is 36.1% higher than the industry average of 8.75.

On the contrary, ENVA has a B grade for Value, consistent with its lower-than-industry valuation. The stock’s forward Price/Sales and non-GAAP P/E of 0.71x and 6.28x are favorably lower than the respective industry averages of 2.20x and 8.75x.

Of the 50 stocks in the Consumer Financial Services industry, PYPL is ranked #19, while ENVA is ranked #9.

Beyond what we’ve stated above, we have also rated both stocks for Sentiment, Growth, Momentum, Stability, and Quality. Click here to view PYPL Ratings. Get all ENVA ratings here.

The Winner

The financial services industry is well-poised for robust growth and expansion thanks to solid demand amid growing consumers’ financial needs and the widespread adoption of emerging technologies. Further, a rising interest rate environment should bode well for financial services companies as it drives their profit margins.

Hence, prominent financial services providers PYPL and ENVA will likely benefit from the industry’s tailwinds. However, PYPL’s relatively bleak financials, elevated valuation, low profitability, and disappointing growth outlook make its competitor, ENVA, the better value buy now.

Our research shows that the odds of success increase when one invests in stocks with an Overall Rating of Strong Buy or Buy. View all the top-rated stocks in the Consumer Financial Services industry here.

What To Do Next?

Get your hands on this special report with 3 low priced companies with tremendous upside potential even in today’s volatile markets:

3 Stocks to DOUBLE This Year >


PYPL shares fell $57.34 (-100.00%) in premarket trading Thursday. Year-to-date, PYPL has declined -19.59%, versus a 12.61% rise in the benchmark S&P 500 index during the same period.


About the Author: Mangeet Kaur Bouns

Mangeet’s keen interest in the stock market led her to become an investment researcher and financial journalist. Using her fundamental approach to analyzing stocks, Mangeet’s looks to help retail investors understand the underlying factors before making investment decisions.

More…

The post PayPal (PYPL) vs. Enova International (ENVA): Which Financial Stock Is the Better Value Buy? appeared first on StockNews.com

https://www.entrepreneur.com/finance/paypal-pypl-vs-enova-international-enva-which/462834


AutoZone (AZO) vs. Advance Auto Parts (AAP) vs. Modine Manufacturing Company (MOD): Which Is the Best Auto Stock Buy?

With robust demand for new and used vehicles, the growing trend for vehicle customization, the introduction of advanced technologies, and a significant surge in e-commerce, the auto parts industry’s outlook looks promising. Given the industry’s tailwinds, let’s find out if AutoZone (AZO), Advance Auto Parts (AAP), and Modine Manufacturing (MOD) are ideal auto stock buys. Continue reading….

Despite prevailing macro headwinds, the auto parts industry is well-positioned to witness significant growth this year and beyond, thanks to steady demand for new and used automobiles, the rising popularity of vehicle customization and personalization, several technological advancements, and the introduction of e-commerce platforms.

Given the industry’s solid footing, investing in fundamentally sound auto stocks AutoZone, Inc. (AZO) and Modine Manufacturing Company (MOD) could be wise now. However, investors could hold Advance Auto Parts, Inc. (AAP) and wait for a better entry point in this stock.

According to the latest forecast released by Cox Automotive, the U.S. automotive industry’s solid year-over-year sales recovery continued in the third quarter of 2023, driven by pent-up demand and improved industry-wide inventory levels.

Despite higher interest rates on new-vehicle loans and a strike by the United Auto Workers against the major domestic automakers, sales volumes in September are expected to reach around 1.3 million, up more than 13% from a year ago. Also, sales volume in the third quarter is forecast to surpass 3.9 million, an increase of more than 15% over the same period a year earlier.

As the auto market enters the final quarter of 2023, the Cox Automotive Industry Insights team raised its full-year new-vehicle sales forecast to between 15.3 and 15.4 million units, an increase from the estimate of 15 million at the end of the first half.

The growing demand for new and used automobiles, the continued growth in aftermarket sales, and the rising demand for electric and hybrid vehicles are key factors propelling the auto parts industry’s growth. According to a report by Market Research Future, the global auto parts market is projected to reach $755 billion by 2026, growing at a CAGR of 7.5%.

In addition, the auto parts market’s growth prospects appear bright, driven by the increasing trend of automotive customization and personalization, like aesthetic look and performance upgrades, and several technological advancements, including navigation systems, advanced driver assistance systems, and infotainment systems.

The introduction of e-commerce platforms offering automotive parts and accessories is further expected to aid the industry’s profitability. The auto parts e-commerce aftermarket is expected to reach $183.31 billion by 2029, exhibiting a CAGR of 14.6% during the forecast period of 2023 to 2029.

With these favorable trends in mind, let’s take a look at the fundamentals of the three Auto Parts stocks, starting with number 3.

Stock to Hold:

Stock #3: Advance Auto Parts, Inc. (AAP)

AAP offers automotive replacement parts, accessories, batteries, and maintenance items for domestic and imported cars, vans, sport utility vehicles, and light and heavy-duty trucks. The company operates stores under the Advance Auto Parts, Autopart International, and Carquest brands and branches under the Worldpac name.

AAP updated its full-year 2023 guidance with a modest step up in net and comparable store sales growth, driven by the strengthening of its professional business. The company expects full-year net sales of $11.25-$11.35 billion, up from the prior guidance of $11.20-$11.30 billion. Its comparable store sales are anticipated to be between negative 0.5% to 0.5%.

However, the company reduced its outlook for operating income margin rate, EPS, and free cash flow. This reflects additional headwinds expected in the back half of the year driven by its ongoing commitment to maintaining competitive price targets, impacts from a shift in channel mix, and investments in its team to help retain top talent.

AAP anticipates fiscal year 2023 EPS of $4.50-5.10, down from the previous outlook of $6-$6.50. The company’s free cash flow is expected to be $150-$250 million, compared to the prior outlook of $200-$300 million.

AZO’s trailing-12-month gross profit margin of 43.60% is 23% higher than the 35.45% industry average. However, the stock’s trailing-12-month EBIT margin and net income margin of 5.11% and 3.08% are lower than the respective industry averages of 7.42% and 4.40%.

AAP’s net sales for the second quarter ended July 15, 2023, increased 0.8% year-over-year to $2.68 billion. However, its gross profit declined 3.2% from the year-ago value to $1.15 billion. Its operating income was $134.37 million, up 33.4% year-over-year. The company’s net income decreased 40.9% from the prior year’s quarter to $85.36 million.

In addition, the company reported earnings per common share of $1.43, a decline of 39.9% year-over-year. But its cash and cash equivalents stood at $277.06 million as of July 15, 2023, compared to $269.28 million as of December 31, 2022.

Analysts expect AAP’s revenue for the fiscal year (ending December 2023) to increase 0.9% year-over-year to $11.26 billion. However, the company’s EPS for the ongoing year is expected to decline 63.6% year-over-year to $4.75. Also, it missed the consensus EPS estimates in three of the trailing four quarters.

For the fiscal year 2024, the company’s revenue and EPS are estimated to increase 2.1% and 21.6% from the prior year to $11.49 billion and $5.77, respectively.

Shares of AAP have declined 15.5% over the past month and 52.2% over the past six months to close the last trading session at $54.82.

AAP’s POWR Ratings reflect its mixed prospects. The stock has an overall C rating, equating to a Neutral in our proprietary rating system. The POWR Ratings are calculated by considering 118 different factors, with each factor weighted to an optimal degree.

AAP has a B grade for Quality and Value. It has a C grade for Momentum. On the other hand, the stock has an F grade for Sentiment. It is ranked #49 out of 60 stocks in the A-rated Auto Parts industry.

Click here for the additional POWR Ratings for AAP (Stability and Growth).

Stocks to Buy:

Stock #2: AutoZone, Inc. (AZO)

AZO retails and distributes automotive replacement parts and accessories. The company provides various products for cars, sport utility vehicles, vans, and light trucks. Its products include A/C compressors, batteries and accessories, bearings, belts and hoses, calipers, chassis, clutches, CV axles, engines, fuel pumps, fuses, ignition and lighting products, mufflers, and radiators.

Under its share repurchase program, AZO repurchased 403 thousand shares of its common stock during the fourth quarter at an average price per share of $2.502, for a total investment of $1 billion. For fiscal year 2023, the company repurchased 1.5 million shares of its stock for a total investment of $3.7 billion. Share buybacks would enable AZO to generate additional shareholder value.

AZO’s trailing-12-month gross profit margin of 51.96% is 46.6% higher than the 35.45% industry average. Likewise, the stock’s trailing-12-month EBITDA margin and net income margin of 22.49% and 14.48% are significantly higher than the industry averages of 11.01 and 4.40%, respectively.

For the fourth quarter that ended August 26, 2023, AZO’s net sales increased 6.4% year-over-year to $5.69 billion, and its gross profit grew 8.8% from the year-ago value to $3 billion. Its operating profit rose 10.8% year-over-year to $1.22 billion. The company’s income before taxes grew 7.1% from the prior-year quarter to $1.11 billion.

Furthermore, the company’s net income rose 6.8% from the year-ago value to $864.84 million, and its net income per share came in at $46.46, an increase of 14.7% year-over-year.

Analysts expect AZO’s revenue for the fiscal 2024 first quarter (ending November 2023) to increase by 5.3% year-over-year to $4.19 billion. The consensus EPS estimate of $30.96 for the current quarter reflects a 12.8% year-over-year improvement. Moreover, the company has topped the consensus EPS estimates in all four trailing quarters, which is impressive.

Further, the company’s revenue and EPS for the fiscal year (ending August 2024) are expected to grow 7.3% and 12.8% year-over-year to $18.73 billion and $149.31, respectively.

Over the past six months, AZO’s stock has surged 7.3% to close the last trading session at $2,540.90. Also, the stock has gained 21% over the past year.

AZO’s strong fundamentals are reflected in its POWR Ratings. The stock has an overall B rating, equating to a Buy in our proprietary rating system.

AZO has an A grade for Quality and a B for Sentiment. It is ranked #28 out of 60 stocks in the A-rated Auto Parts industry.

To access additional POWR Ratings of AZO for Momentum, Stability, Value, and Growth, click here.

Stock #1: Modine Manufacturing Company (MOD)

MOD offers engineered heat transfer systems and heat-transfer components for use in on- and off-highway original equipment manufacturer (OEM) vehicular applications. The company operates through the Climate Solutions and Performance Technologies segments.

On September 6, MOD signed a definitive agreement to sell three German-based Modine businesses located in Neuenkirchen, Pliezhausen, and Wackersdorf to affiliates of Regent LP. The sale of these businesses aligns with the company’s strategy to focus its resources on high-margin technologies with solid growth drivers.

On August 15, MOD launched a new electric infrared product line – the MEL Series. This high-wattage, commercial-grade electric infrared heater offers energy efficiency, fast heat-up times, and versatility for various applications, including outdoor patios and commercial spaces. This series is UL-certified for residential outdoor and commercial use, with input voltages ranging from 120V to 480V.

“The MEL Series provides our customers with a low-emissions heating product that can be used in a wide range of applications. We’re excited to add this new product to our growing line of electric heating solutions. Our team is committed to offering products that support Modine’s purpose of engineering a cleaner and healthier world,” said Jon Schlemmer, Vice President and General Manager of Heating Business at MOD.

In terms of the trailing-12-month EBIT margin, MOD’s 8.09% is 9% higher than the 7.42% industry average. Moreover, the stock’s trailing-12-month net income margin and ROCE of 7.72% and 34% are higher than the respective industry averages of 4.40% and 11.17%.

MOD’s net sales increased 15% year-over-year to $622.40 million for the second quarter that ended June 30, 2023. Its gross profit rose 53.4% year-over-year to $127.90 million. Its operating income rose 159.8% from the year-ago value to $66.50 million. The company’s adjusted EBITDA was $80.40 million, an increase of 90.5% year-over-year.

In addition, net earnings attributable to MOD grew 213.3% year-over-year to $44.80 million. The company’s adjusted earnings per share increased 165.6% from the prior year’s quarter to $0.85.

Analysts expect MOD’s revenue and EPS for the fiscal year (ending March 2024) to increase 9.2% and 48.1% year-over-year to $2.51 billion and $2.89. Additionally, the company has surpassed the consensus EPS estimates in each of the trailing four quarters.

The stock has gained 124.1% year-to-date and 234.4% over the past year to close the last trading session at $45.07.

MOD’s POWR Ratings reflect its robust outlook. The stock has an overall rating of A, which translates to a Strong Buy in our proprietary rating system.

The stock has a B grade for Growth, Sentiment, and Quality. It is ranked #15 in the same industry.

In addition to the POWR Ratings I’ve just highlighted, you can see MOD’s ratings for Stability, Value, and Momentum here.

What To Do Next?

Get your hands on this special report with 3 low priced companies with tremendous upside potential even in today’s volatile markets:

3 Stocks to DOUBLE This Year >


AZO shares were unchanged in premarket trading Thursday. Year-to-date, AZO has gained 3.03%, versus a 12.64% rise in the benchmark S&P 500 index during the same period.


About the Author: Mangeet Kaur Bouns

Mangeet’s keen interest in the stock market led her to become an investment researcher and financial journalist. Using her fundamental approach to analyzing stocks, Mangeet’s looks to help retail investors understand the underlying factors before making investment decisions.

More…

The post AutoZone (AZO) vs. Advance Auto Parts (AAP) vs. Modine Manufacturing Company (MOD): Which Is the Best Auto Stock Buy? appeared first on StockNews.com

https://www.entrepreneur.com/finance/autozone-azo-vs-advance-auto-parts-aap-vs-modine/462825


Are Investors Buying Up Stock in BlackBerry (BB) Before Earnings Hit?

BlackBerry Limited (BB), once a dominant force in the smartphone industry, has experienced a significant transformation throughout the years. As the firm prepares to release its second-quarter financial report, we delve into the crucial figures and parameters defining its financial stability to determine whether it’s a buy or a sell before the earnings release. Read on….

Waterloo, Canada-based BlackBerry Limited (BB) is set to unveil its quarterly earnings results on Thursday, September 28, after the market closes. Analysts expect BB’s revenue and EPS for the fiscal second quarter (ended August 2023) to decline 12.5% and 1.8% year-over-year to $146.95 million and negative $0.05, respectively.

For the same quarter, the company projects its overall revenue to reach approximately $132 million, with IoT revenue of about $49 million and Licensing and Other revenue to reach nearly $3 million. Cybersecurity segment revenue is predicted to fall below expectations, with anticipated earnings of merely $80 million, attributed to the failure to materialize government deals during the quarter.

Investors lauded the significant uptick, with the company surpassing top and bottom-line estimates in the last reported quarter ended May 31, 2023. However, upon closer inspection, the increase in revenue can be directly linked to the substantial growth in Licensing and Other revenue to $235 million, principally attributed to proceeds from patent sales.

Since BB went public in 1997, it quickly earned a reputation for its omnipresent smartphone business. In a strategic shift, however, BB shuttered its flagship operations last year and has since concentrated on offloading the remaining patents from its mobile device era.

Revenues from its cybersecurity and IoT businesses saw a year-over-year contraction to $93 million and $45 million, respectively, for the quarter ended May 31, 2023.

A glance at BB’s trajectory over the past three and five years highlights a marked downturn, with revenues dwindling at CAGRs of 4.8% and 1.1%, respectively. Its tangible book value saw a steeper decline, at CAGRs of 28.2% and 44.6% over the same periods.

Moreover, increasing competition casts further uncertainty on BB’s immediate future. Over the past decade, the company has transitioned distinctly from its roots as a smartphone innovator to positioning itself as a cybersecurity and Internet of Things (IoT) software solutions provider. BB competes with established and formidable industrial leaders even with significant inroads into these burgeoning markets.

Furthermore, institutional investors and hedge funds have recently changed their BB stock holdings. Institutions hold roughly 44.7% of BB shares. Of the 260 institutional holders, 94 have decreased their positions in the stock. Moreover, 31 institutions have sold out their positions in the stock with 2,078,592 shares, indicating bearish sentiments.

Over the past year, the stock has declined 1.6% to close the last trading session at $4.99. Over the past month, the stock plunged 4.6%.

Here are the factors that could affect BB’s performance in the near term:

Weak Financials

For the fiscal first quarter that ended May 31, 2023, BB’s revenue stood at $373 million, while its adjusted gross margin stood at $180 million. BB registered an operating loss of $11 million during the quarter. In addition, the company’s adjusted net income and adjusted EPS came in at $35 million and $0.06, respectively.

Moreover, cash, cash equivalents, restricted cash, and restricted cash equivalents declined 8.1% year-over-year to $385 million. As of May 31, 2023, BB’s current assets stood at $696 million, compared to $743 as of February 28, 2023. Furthermore, as of May 31, 2023, its current liabilities came at $736 million, compared to $729 as of February 28, 2023.

Stretched Valuation

In terms of its forward non-GAAP P/E, BB is trading at 998.07x, significantly higher than the industry average of 22.09x. Its EV/EBIT multiple of 183.98 is 936.5% higher than the industry average of 17.75x. The stock’s forward Price/Sales multiple of 3.46 is 33.9% higher than the industry average of 2.58.

Poor Profitability

BB’s trailing-12-month EBIT and net income margin are negative at 17.19% and 65.51%, compared to the industry averages of 4.51% and 2.03%, respectively. Furthermore, the stock’s trailing-12-month asset turnover ratio of 0.42x is 32.5% lower than the industry average of 0.62x.

Disappointing Analyst Estimates

For the fiscal third quarter ending November 2023, BB’s EPS is expected to come at a negative $0.01, whereas its revenue is expected to come at $187.68 million. Moreover, Street expects the company’s EPS to come in at $0.01 for the fiscal year ending February 2024, and revenue is expected to reach $867.57 million.

POWR Ratings Reflect a Somber Outlook

BB’s weak fundamentals are reflected in its POWR Ratings. The stock has an overall D rating, equating to a Sell in our proprietary rating system. The POWR Ratings are calculated by considering 118 different factors, with each factor weighted to an optimal degree.

Our proprietary rating system also evaluates each stock based on eight distinct categories. BB has a Stability grade of D, in sync with its five-year beta of 1.16.

The stock also has a D grade for Quality, consistent with its poor profitability. It has a D grade for Sentiment, in sync with the unfavorable bottom-line estimates.

It is ranked #42 within the D-rated 49-stock Technology – Communication/Networking industry.

Beyond what we have mentioned above, to see the other ratings of BB (Growth, Value, and Momentum), click here.

Bottom Line

The challenging macroeconomic landscape, combined with BB’s unstable financial performance, deteriorating revenues, and unpropitious projections, is exerting substantial pressure on the stock. The current scenario, therefore, advises caution, suggesting that investors might want to steer clear of this stock.

How Does BlackBerry Limited (BB) Stack Up Against Its Peers?

While BB has an overall grade of D, equating to a Sell rating, you may check out these other stocks within the Technology – Communication/Networking industry with an A (Strong Buy) rating: PCTEL, Inc. (PCTI), Eutelsat Communications S.A. (ETCMY), and Cisco Systems, Inc. (CSCO). For exploring more A and B-rated Technology – Communication/Networking stocks, click here.

43 Year Investment Pro Shares Top Picks

Steve Reitmeister is best known for his timely market outlooks & unique trading plans to stay on the right side of the market action. Click below to get his latest insights…

Steve Reitmeister’s Trading Plan & Top Picks >


BB shares rose $0.01 (+0.20%) in premarket trading Tuesday. Year-to-date, BB has gained 53.07%, versus a 14.28% rise in the benchmark S&P 500 index during the same period.


About the Author: Sristi Suman Jayaswal

The stock market dynamics sparked Sristi’s interest during her school days, which led her to become a financial journalist. Investing in undervalued stocks with solid long-term growth prospects is her preferred strategy.Having earned a master’s degree in Accounting and Finance, Sristi hopes to deepen her investment research experience and better guide investors.

More…

The post Are Investors Buying Up Stock in BlackBerry (BB) Before Earnings Hit? appeared first on StockNews.com

https://www.entrepreneur.com/finance/are-investors-buying-up-stock-in-blackberry-bb-before/459708