3 Reasons Why Nvidia (NVDA) Is a Great Growth Stock

You’re reading Entrepreneur United States, an international franchise of Entrepreneur Media. This story originally appeared on Zacks

Growth investors focus on stocks that are seeing above-average financial growth, as this feature helps these securities garner the market’s attention and deliver solid returns. However, it isn’t easy to find a great growth stock.

– Zacks

That’s because, these stocks usually carry above-average risk and volatility. In fact, betting on a stock for which the growth story is actually over or nearing its end could lead to significant loss.

However, the task of finding cutting-edge growth stocks is made easy with the help of the Zacks Growth Style Score (part of the Zacks Style Scores system), which looks beyond the traditional growth attributes to analyze a company’s real growth prospects.

Nvidia (NVDA) is on the list of such stocks currently recommended by our proprietary system. In addition to a favorable Growth Score, it carries a top Zacks Rank.

Research shows that stocks carrying the best growth features consistently beat the market. And for stocks that have a combination of a Growth Score of A or B and a Zacks Rank #1 (Strong Buy) or 2 (Buy), returns are even better.

Here are three of the most important factors that make the stock of this maker of graphics chips for gaming and artificial intelligence a great growth pick right now.

Earnings Growth

Earnings growth is arguably the most important factor, as stocks exhibiting exceptionally surging profit levels tend to attract the attention of most investors. For growth investors, double-digit earnings growth is highly preferable, as it is often perceived as an indication of strong prospects (and stock price gains) for the company under consideration.

While the historical EPS growth rate for Nvidia is 26.7%, investors should actually focus on the projected growth. The company’s EPS is expected to grow 65.5% this year, crushing the industry average, which calls for EPS growth of 61.8%.

Cash Flow Growth

Cash is the lifeblood of any business, but higher-than-average cash flow growth is more beneficial and important for growth-oriented companies than for mature companies. That’s because, high cash accumulation enables these companies to undertake new projects without raising expensive outside funds.

Right now, year-over-year cash flow growth for Nvidia is 94.9%, which is higher than many of its peers. In fact, the rate compares to the industry average of 7.2%.

While investors should actually consider the current cash flow growth, it’s worth taking a look at the historical rate too for putting the current reading into proper perspective. The company’s annualized cash flow growth rate has been 49.5% over the past 3-5 years versus the industry average of 12.9%.

Promising Earnings Estimate Revisions

Superiority of a stock in terms of the metrics outlined above can be further validated by looking at the trend in earnings estimate revisions. A positive trend is of course favorable here. Empirical research shows that there is a strong correlation between trends in earnings estimate revisions and near-term stock price movements.

The current-year earnings estimates for Nvidia have been revising upward. The Zacks Consensus Estimate for the current year has surged 0.3% over the past month.

Bottom Line

While the overall earnings estimate revisions have made Nvidia a Zacks Rank #2 stock, it has earned itself a Growth Score of A based on a number of factors, including the ones discussed above.

You can see the complete list of today’s Zacks #1 Rank (Strong Buy) stocks here.

This combination indicates that Nvidia is a potential outperformer and a solid choice for growth investors.

Zacks Names “Single Best Pick to Double”

From thousands of stocks, 5 Zacks experts each have chosen their favorite to skyrocket +100% or more in months to come. From those 5, Director of Research Sheraz Mian hand-picks one to have the most explosive upside of all.

You know this company from its past glory days, but few would expect that it’s poised for a monster turnaround. Fresh from a successful repositioning and flush with A-list celeb endorsements, it could rival or surpass other recent Zacks’ Stocks Set to Double like Boston Beer Company which shot up +143.0% in a little more than 9 months and Nvidia which boomed +175.9% in one year.

Free: See Our Top Stock and 4 Runners Up >>

Want the latest recommendations from Zacks Investment Research? Today, you can download 7 Best Stocks for the Next 30 Days. Click to get this free report
 
NVIDIA Corporation (NVDA): Free Stock Analysis Report
 
To read this article on Zacks.com click here.

https://www.entrepreneur.com/article/391053



3 Reasons Growth Investors Will Love Wesco International (WCC)

You’re reading Entrepreneur United States, an international franchise of Entrepreneur Media. This story originally appeared on Zacks

Growth stocks are attractive to many investors, as above-average financial growth helps these stocks easily grab the market’s attention and produce exceptional returns. But finding a growth stock that can live up to its true potential can be a tough task.

– Zacks

That’s because, these stocks usually carry above-average risk and volatility. In fact, betting on a stock for which the growth story is actually over or nearing its end could lead to significant loss.

However, the Zacks Growth Style Score (part of the Zacks Style Scores system), which looks beyond the traditional growth attributes to analyze a company’s real growth prospects, makes it pretty easy to find cutting-edge growth stocks.

Wesco International (WCC) is one such stock that our proprietary system currently recommends. The company not only has a favorable Growth Score, but also carries a top Zacks Rank.

Studies have shown that stocks with the best growth features consistently outperform the market. And for stocks that have a combination of a Growth Score of A or B and a Zacks Rank #1 (Strong Buy) or 2 (Buy), returns are even better.

Here are three of the most important factors that make the stock of this maker of electrical and industrial maintenance supplies and construction materials a great growth pick right now.

Earnings Growth

Arguably nothing is more important than earnings growth, as surging profit levels is what most investors are after. And for growth investors, double-digit earnings growth is definitely preferable, and often an indication of strong prospects (and stock price gains) for the company under consideration.

While the historical EPS growth rate for Wesco International is 11.2%, investors should actually focus on the projected growth. The company’s EPS is expected to grow 100.6% this year, crushing the industry average, which calls for EPS growth of 67.8%.

Cash Flow Growth

Cash is the lifeblood of any business, but higher-than-average cash flow growth is more beneficial and important for growth-oriented companies than for mature companies. That’s because, high cash accumulation enables these companies to undertake new projects without raising expensive outside funds.

Right now, year-over-year cash flow growth for Wesco International is 23.4%, which is higher than many of its peers. In fact, the rate compares to the industry average of 9.8%.

While investors should actually consider the current cash flow growth, it’s worth taking a look at the historical rate too for putting the current reading into proper perspective. The company’s annualized cash flow growth rate has been 4.3% over the past 3-5 years versus the industry average of 2.6%.

Promising Earnings Estimate Revisions

Superiority of a stock in terms of the metrics outlined above can be further validated by looking at the trend in earnings estimate revisions. A positive trend is of course favorable here. Empirical research shows that there is a strong correlation between trends in earnings estimate revisions and near-term stock price movements.

There have been upward revisions in current-year earnings estimates for Wesco International. The Zacks Consensus Estimate for the current year has surged 3.6% over the past month.

Bottom Line

Wesco International has not only earned a Growth Score of B based on a number of factors, including the ones discussed above, but it also carries a Zacks Rank #2 because of the positive earnings estimate revisions.

You can see the complete list of today’s Zacks #1 Rank (Strong Buy) stocks here.

This combination indicates that Wesco International is a potential outperformer and a solid choice for growth investors.

Zacks Names “Single Best Pick to Double”

From thousands of stocks, 5 Zacks experts each have chosen their favorite to skyrocket +100% or more in months to come. From those 5, Director of Research Sheraz Mian hand-picks one to have the most explosive upside of all.

You know this company from its past glory days, but few would expect that it’s poised for a monster turnaround. Fresh from a successful repositioning and flush with A-list celeb endorsements, it could rival or surpass other recent Zacks’ Stocks Set to Double like Boston Beer Company which shot up +143.0% in a little more than 9 months and Nvidia which boomed +175.9% in one year.

Free: See Our Top Stock and 4 Runners Up >>

Want the latest recommendations from Zacks Investment Research? Today, you can download 7 Best Stocks for the Next 30 Days. Click to get this free report
 
WESCO International, Inc. (WCC): Free Stock Analysis Report
 
To read this article on Zacks.com click here.

https://www.entrepreneur.com/article/391052


Here is Why Growth Investors Should Buy Daqo (DQ) Now

You’re reading Entrepreneur United States, an international franchise of Entrepreneur Media. This story originally appeared on Zacks

Growth stocks are attractive to many investors, as above-average financial growth helps these stocks easily grab the market’s attention and produce exceptional returns. But finding a great growth stock is not easy at all.

– Zacks

In addition to volatility, these stocks carry above-average risk by their very nature. Also, one could end up losing from a stock whose growth story is actually over or nearing its end.

However, the Zacks Growth Style Score (part of the Zacks Style Scores system), which looks beyond the traditional growth attributes to analyze a company’s real growth prospects, makes it pretty easy to find cutting-edge growth stocks.

Daqo New Energy (DQ) is on the list of such stocks currently recommended by our proprietary system. In addition to a favorable Growth Score, it carries a top Zacks Rank.

Research shows that stocks carrying the best growth features consistently beat the market. And returns are even better for stocks that possess the combination of a Growth Score of A or B and a Zacks Rank #1 (Strong Buy) or 2 (Buy).

While there are numerous reasons why the stock of this solar panel parts maker is a great growth pick right now, we have highlighted three of the most important factors below:

Earnings Growth

Arguably nothing is more important than earnings growth, as surging profit levels is what most investors are after. For growth investors, double-digit earnings growth is highly preferable, as it is often perceived as an indication of strong prospects (and stock price gains) for the company under consideration.

While the historical EPS growth rate for Daqo is 6.1%, investors should actually focus on the projected growth. The company’s EPS is expected to grow 556.6% this year, crushing the industry average, which calls for EPS growth of 48.5%.

Cash Flow Growth

Cash is the lifeblood of any business, but higher-than-average cash flow growth is more beneficial and important for growth-oriented companies than for mature companies. That’s because, high cash accumulation enables these companies to undertake new projects without raising expensive outside funds.

Right now, year-over-year cash flow growth for Daqo is 161.8%, which is higher than many of its peers. In fact, the rate compares to the industry average of -6.2%.

While investors should actually consider the current cash flow growth, it’s worth taking a look at the historical rate too for putting the current reading into proper perspective. The company’s annualized cash flow growth rate has been 29.2% over the past 3-5 years versus the industry average of 4.6%.

Promising Earnings Estimate Revisions

Beyond the metrics outlined above, investors should consider the trend in earnings estimate revisions. A positive trend is a plus here. Empirical research shows that there is a strong correlation between trends in earnings estimate revisions and near-term stock price movements.

The current-year earnings estimates for Daqo have been revising upward. The Zacks Consensus Estimate for the current year has surged 13.5% over the past month.

Bottom Line

Daqo has not only earned a Growth Score of A based on a number of factors, including the ones discussed above, but it also carries a Zacks Rank #1 because of the positive earnings estimate revisions.

You can see the complete list of today’s Zacks #1 Rank (Strong Buy) stocks here.

This combination positions Daqo well for outperformance, so growth investors may want to bet on it.

Zacks Names “Single Best Pick to Double”

From thousands of stocks, 5 Zacks experts each have chosen their favorite to skyrocket +100% or more in months to come. From those 5, Director of Research Sheraz Mian hand-picks one to have the most explosive upside of all.

You know this company from its past glory days, but few would expect that it’s poised for a monster turnaround. Fresh from a successful repositioning and flush with A-list celeb endorsements, it could rival or surpass other recent Zacks’ Stocks Set to Double like Boston Beer Company which shot up +143.0% in a little more than 9 months and Nvidia which boomed +175.9% in one year.

Free: See Our Top Stock and 4 Runners Up >>

Want the latest recommendations from Zacks Investment Research? Today, you can download 7 Best Stocks for the Next 30 Days. Click to get this free report
 
DAQO New Energy Corp. (DQ): Free Stock Analysis Report
 
To read this article on Zacks.com click here.

https://www.entrepreneur.com/article/391055


2 Reddit WallStreetBets Stocks to Buy, 2 to Sell

While the subreddit WallStreetBets’ (WSB) large wagers against short sellers and the resulting short squeezes have caused the shares of several companies to skyrocket in price, they have also resulted in high valuations for several fundamentally weak companies. So, we believe overvalued WSB stocks Root Inc. (ROOT) and Wrap Technologies (WRAP), with bleak growth prospects, are best avoided now. Conversely, we think AZZ Inc. (AZZ) and Del Taco Restaurant (TACO) should continue to deliver big gains and could be ideal picks now. So, read on.

shutterstock.com – StockNews

Following the success with GameStop Corporation (GME) earlier this year, Reddit’s WallStreetBets (WSB) community, which is known for betting on heavily shorted companies and squeezing out short-selling hedge funds, has triggered price rallies in many other stocks, irrespective of their fundamental strength.

While WSB typically targets fundamentally weak stocks with a considerable level of short interest, we believe that a few of the subreddit’s heavily discussed stocks possess sufficient fundamental strength to generate solid returns. AZZ Inc. (AZZ) and Del Taco Restaurant Inc. (TACO) are two such stocks. They could prove to be long-term winners on the back of their improving fundamentals. So, they could be solid bets now.

In contrast, with extremely high price levels relative to their underlying business fundamentals and financial strength, we think Root Inc. (ROOT) and Wrap Technologies Inc. (WRAP) could suffer a major pullback in the near term. Hence, these stocks are best avoided now.

Stocks to Buy:

AZZ Inc. (AZZ)

AZZ in Fort Worth, Tex., serves the power generation, transmission, distribution, refining, and industrial sectors in the United States and abroad with galvanizing and metal coating solutions, welding solutions, specialty electrical equipment, and engineering services. Infrastructure Solutions and Metal Coatings are the company’s two operational segments.

AZZ’s sales increased 7.8% year-over-year to $229.83 million in the first quarter, ended May 31, 2021. Its operating income grew 114.5% from its year-ago value to $30.71 million. The company’s net income surged 303% from the prior-year quarter to $22.34 million, while its EPS increased 319% year-over-year to $0.88.

AZZ’s EPS is expected to grow 43.6% year-over-year to $3.03 in its fiscal year 2021. Analysts expect AZZ’s revenue to increase 10.2% year-over-year to $924.2 million in the current year. The stock has gained 49.6% in price over the past year and 15.2% year-to-date.

AZZ’s POWR Ratings reflect this promising outlook. The company has an overall B rating, which translates to Buy in our proprietary rating system. The POWR Ratings assess stocks by 118 different factors, each with its own weighting.

AZZ is also rated A for Momentum, and a B for Sentiment and Quality. Within the B-rated Industrial – Machinery industry, it is ranked #22 of 81 stocks. To see additional POWR Ratings for Growth, Value, and Stability for AZZ, click here.

Click here to check out our Industrial Sector Report for 2021

Del Taco Restaurant Inc. (TACO)

TACO is the second largest Mexican quick-service restaurant in the United States. Its restaurants are known for offering Mexican-inspired as well as classic American dishes. The Lake Forest, Calif.-based company operated 600 restaurants across 16 states as of June 9, 2021.

This month, TACO signed a deal to set up five outlets in the Raleigh and Durham regions with Ram Restaurants Inc., a prominent North Carolina franchise company. With this collaboration, the company aims to expand its brand footprint in the Southeast U.S. and accelerate its growth.

For the second quarter, ended June 15, 2021, TACO’s total revenue increased 19.5% year-over-year to $124.97 million. Its operating income increased 148.5% year-over-year to $9.21 million over this period. Its net income came in at $6 million for this period, compared to a $576 million net loss in the first quarter of 2020. The company’s EPS totaled $0.16, compared to a $0.02 loss per share in the prior-year period.

The company’s EPS is expected to grow 33.3% year-over-year to $0.48 in the current year. In addition, analysts expect TACO’s revenue to increase 7.4% year-over-year to $528.16 million in its fiscal year 2021. TACO’s stock has gained 6.1% in price over the past month.

It is no surprise that TACO has an overall B rating, which equates to Buy in our POWR Ratings system. The stock also has a B grade for Value, Momentum, and Quality. In the A-rated Restaurant industry, it is ranked #14 of 48 stocks.

In addition to the POWR Ratings grades I have just highlighted, one can see the TACO rating for Stability, Growth, and Sentiment here.

Stocks to Sell:

Root Inc. (ROOT)

ROOT in Columbus, Ohio, offers insurance products and services that include vehicle, house, and renters’ insurance in the United States. The company has a direct-to-consumer strategy and primarily serves clients through mobile applications and its website. In addition, its direct distribution channels cover digital, media, referral channels, and distribution partners.

During the second quarter, ended June 30, 2021, ROOT’s revenue declined 26% year-over-year to $89.8 million. The company’s operating loss grew 451.6% from its year-ago value to $172.1 million, while its net loss surged 359.1% from the prior-year quarter to $178.6 million. The company’s loss per share came in at $0.72 over this period.

Analysts expect its EPS to remain negative in its fiscal year 2021. In addition, ROOT’s revenue is expected to decline 56.8% year-over-year to $266.6 million in the current year. The stock has declined 45.8% in price over the past three months and 68.4% year-to-date.

Currently, ROOT looks highly overvalued. In terms of forward Price/Book, ROOT’s 2.14x is 77.1% higher than the 1.21x industry average. In addition, its 4.65x forward Price/Sales is 36.2% higher than the 3.42x industry average.

ROOT’s poor prospects are also apparent in its POWR Ratings. The stock has an overall F rating, which equates to Strong Sell in our proprietary rating system.

It also has an F grade for Value, Sentiment, and Growth. ROOT is ranked #54 of 55 stocks in the C-rated Insurance – Property & Casualty industry. Click here to see the additional POWR Ratings for ROOT (Stability, Quality, and Momentum).

Wrap Technologies Inc. (WRAP)

WRAP, a Tempe. Ariz.-based public safety technology and services provider, creates policing solutions for law enforcement and security professionals. The company develops BolaWrap 100, a hand-held remote restraint device that deploys an eight-foot bola-style kevlar tether to entangle a victim at 10-25 feet.

WRAP’s operating expenses increased 148.5% year-over-year to $7.74 million for the second quarter ended June 30, 2021. Its operating loss grew 174% from its year-ago value to $7.80 million. The company’s net loss surged 180% from the prior-year quarter to $7.79 million, while its loss per share increased 122.2% year-over-year to $0.20.

The company’s EPS is expected to decline 73.7% and remain negative in the current year. WRAP’s stock has declined 13.9% in price over the past three months and 5.5% over the past month.

In terms of forward Price/Sales, WRAP is currently trading at 26.67x, which is 578.7% higher than the 3.93x industry average. Also, in terms of its forward EV/Sales, the stock is currently trading at 21.86x, which is 445.1% higher than the 4.01x industry average.

WRAP’s POWR ratings are consistent with this bleak outlook. It has an F grade for Growth, Quality, and Value. The stock is ranked #88 of 92 in the C-rated Industrial – Equipment industry.

Beyond the POWR Ratings grades I have just highlighted, one can see the WRAP ratings for Sentiment, Stability, and Momentum.

Click here to check out our Industrial Sector Report for 2021


AZZ shares were trading at $57.86 per share on Tuesday morning, up $3.19 (+5.84%). Year-to-date, AZZ has gained 23.20%, versus a 17.38% rise in the benchmark S&P 500 index during the same period.


About the Author: Pragya Pandey

Pragya is an equity research analyst and financial journalist with a passion for investing. In college she majored in finance and is currently pursuing the CFA program and is a Level II candidate.

More…

The post 2 Reddit WallStreetBets Stocks to Buy, 2 to Sell appeared first on StockNews.com

https://www.entrepreneur.com/article/390724


As Oil Prices Rally, is Enbridge a Good Pipeline Stock to Invest in?

Oil prices have hit their multi-year highs, fueled by a global supply crunch amid surging demand. And because oil prices are expected to continue moving higher, we think pipeline operators and oil-producing companies should garner big returns. However, considering Enbridge (ENB)’s weak debt profile, is the stock a good choice now? Keep reading to find out.

shutterstock.com – StockNews

Canada-based Enbridge Inc. (ENB) is an energy infrastructure company with business platforms that include a network of crude oil, liquids, natural gas pipelines, regulated natural gas distribution utilities, and renewable power generation. The stock has delivered solid returns over the past year and year-to-date and is currently trading above its 50-day and 200-day moving averages.

The supercharged oil price rally shows no signs of slowing, with oil prices now reaching multi-year highs. U.S crude rose above $80 per barrel for the first time since late 2014, marking a 125% gain since the end of last October. And last week, OPEC and its allies announced that they are firm on their prior agreement to raise production by a modest 400,000 barrels per day in November, which may not be enough to meet the current demand surge.

The global supply crunch is expected to push the oil prices higher. Analysts expect this momentum to continue through the winter, and oil prices could hit the $100 per barrel mark. As a leading energy infrastructure company, ENB should benefit from the oil price rally.

However, the stock’s current valuation looks mixed. In terms of forward non-GAAP PEG, ENB is currently trading at 2.61x, which is 115.3% higher than the 1.21x industry average. However, ENB’s 17.12 trailing-12-months GAAP P/E ratio is 6.5% lower than the 18.30 industry average.

Here’s what could shape ENB’s performance in the near term:

Extensive Network

ENB is taking active steps to achieve its net-zero emission target by 2050. Recently, the company announced its partnership with Vanguard Renewables to buy renewable natural gas (RNG). ENB intends to invest approximately $100 million in RNG upgrading equipment to convert RNG into pipeline-quality renewable natural gas, which it will then market to its customers.

In September, the company also updated the extension of its pipeline from Canada’s oil sands to the U.S. Midwest, which earlier was delayed due to opposition from environmentalists and indigenous groups. However, the company faces legal challenges, including a case filed in tribal court over a Minnesota water permit issued to ENB.

Also, ENB has entered an agreement with Moda Midstream, LLC and Moda’s financial sponsor EnCap Flatrock Midstream to acquire Moda Ingleside Energy Center (MIEC) and other Moda assets. MIEC is the nation’s largest crude export terminal by volume, with an aggregate storage capacity of more than 15 million barrels and an export capacity of 1.6 million barrels per day. So, the acquisition should prove to be highly beneficial for ENB.

Mixed Financials

For the three months ended June 30, 2021, ENB’s total operating revenues increased 37.6% from the same period last year to CAD10.95 billion ($8.77 billion). Its operating income declined 13.4% from its year-ago value to CAD1.82 billion ($1.46 billion), while its earnings attributable to common shareholders fell 15.4% year-over-year to CAD1.39 billion ($1.11 billion). The company’s EPS also decreased 15.9% year-over-year to CAD$0.69.

ENB’s trailing-12-months total debt stands at $55.29 billion, while its net debt came in at $54.98 billion. Its trailing-12-months operating cash flow stood at $7.54 billion, but its trailing-12-months levered free cash flow stood at negative $172.62 million. ENB’s debt/free cash flow ratio is negative 302.08.

POWR Ratings Reflect Uncertainty

ENB has an overall C rating, which translates to Neutral in our proprietary POWR Ratings system. The POWR Ratings are calculated by considering 118 distinct factors, with each factor weighted to an optimal degree.

The stock has a grade of C for Value, consistent with its mixed valuation.

ENB has a B grade for Sentiment. This is justified because the company’s revenue and EPS are expected to increase 17.2% and 36.2%, respectively, year-over-year in the current quarter, ending December 2021.

Of the 49 stocks in the Foreign Oil & Gas industry, ENB is ranked #41.

Beyond what I have stated above, one can also view ENB’s grades for Quality, Growth, Momentum, and Stability here.

View the top-rated stocks in the Foreign Oil & Gas industry here.

Bottom Line

Recent oil price trends favor companies that are engaged in the oil exploration and distribution business. ENB, with its extensive network of pipelines and assets, is one of the leading energy infrastructure providers and is expected to benefit from the industry tailwinds. However, ENB stock is currently trading at a somewhat stretched valuation, given its weak debt profile. So, we think it could be wise to wait for a better entry point in the stock.

How Does Enbridge Inc. (ENB) Stack Up Against its Peers?

While ENB has an overall POWR Rating of C, one  might want to consider taking a look at its industry peer, LUKOIL PJSC (LUKOY), Ampol Limited (CTXAY), and Parex Resources Inc.( PARXF), which has an A (Strong Buy) rating.


ENB shares were trading at $41.59 per share on Tuesday morning, up $0.25 (+0.60%). Year-to-date, ENB has gained 34.63%, versus a 17.21% rise in the benchmark S&P 500 index during the same period.


About the Author: Subhasree Kar

Subhasree’s keen interest in financial instruments led her to pursue a career as an investment analyst. After earning a Master’s degree in Economics, she gained knowledge of equity research and portfolio management at Finlatics.

More…

The post As Oil Prices Rally, is Enbridge a Good Pipeline Stock to Invest in? appeared first on StockNews.com

https://www.entrepreneur.com/article/390723


EVgo vs. Blink Charging: Which Electric Vehicle Infrastructure Stock is a Better Choice?

You’re reading Entrepreneur United States, an international franchise of Entrepreneur Media. This story originally appeared on StockNews

Electric vehicle (EV) charging infrastructure companies such as EVgo (EVGO) and Blink Charging (BLNK) remain unprofitable but are forecast to grow sales at an exponential rate going forward. Which stock between the two should be part of your portfolio today?.

shutterstock.com – StockNews

If you’re bullish on the electric vehicle (EV) industry, then you should consider investing in ancillary EV companies. For example, one of the key factors that will drive EV adoption is the expansion of charging infrastructure.

According to a report from Research and Markets, the global electric vehicle charging infrastructure market is forecast to increase from $7.4 billion in 2020 to $36.72 billion in 2026, indicating an annual growth rate of 31.22% in this period.

A rapidly expanding addressable market is always a positive development for growth investors making stocks such as EVgo (EVGO) and Blink Charging (BLNK) market-beating bets for 2021 and beyond. Let’s see which EV charging company should be part of your portfolio today.

EVgo stock is down 65% from all-time highs

EVgo, valued at a market cap of $2.05 billion,owns and operates a direct current fast-charging network for battery electric vehicles in the U.S. As of May 2021, it operated 800 DCFC locations across 34 states in the U.S. serving 250,000 private and commercial EV drivers.

EVgo has gained traction in this high-growth vertical on the back of partnerships with original equipment manufacturers, rideshare providers, site host partners, and other e-mobility stakeholders. EVgo has also collaborated with General Motors (GM) where it will be the primary charging provider for the automobile giant.

In the next five years, EVgo expects to add 2,700 fast chargers to its network which will be a key driver of top-line growth. In fact, EVgo estimates sales to rise from $20 million in 2021 to $1.28 billion in 2027. Its adjusted EBITDA is also forecast to swing from a loss of $58 million to a profit of $507 million over the next six years.

EVgo stock is down 65% from record highs due to sector-wide volatility as well as the company’s decision to raise additional capital one month after it went public. In the second quarter of 2021, EVgo reported sales of $4.8 million which were 62% higher compared to its year-ago period.

Blink Charging sales almost tripled in Q2

A pure-play EV charging company, Blink Charging owns, operates, and manufactures charging equipment that is used by residential and commercial customers. Blink Charging has deployed over 23,000 charging stations all over the world and has a 10% market share in the U.S.

Its charging stations generate sales via a revenue-sharing model where Blink monetizes energy sales to recover installation costs resulting in higher charging prices compared to peers.

In the second quarter of 2021, Blink’s sales rose by 177% year over year to $4.4 million and the company reported a net loss of $13.5 million or $0.32 per share. It sold, contracted, or installed 3,264 charging stations, compared to just 380 in the year-ago figure period.

The verdict

While the two companies continue to grow top-line rapidly, they are part of a capital-intensive vertical and will remain unprofitable over the next few years. This means, both EVgo and Blink Charging will need to raise equity several times going forward, which could mean a dilution in shareholder value.

At the time of writing, EVGO stock is valued at a forward price to 2022 sales multiple of 36.6x while the ratio for Blink Charging is also steep at 39x. Between the two companies, I believe EVgo seems a better stock right now, given its trading at a discount of over 75%, according to Wall Street price target estimates. Comparatively, Blink Charging is trading at a discount of 29% compared to consensus estimates.


EVGO shares . Year-to-date, EVGO has declined -28.57%, versus a 18.26% rise in the benchmark S&P 500 index during the same period.


About the Author: Aditya Raghunath

Aditya Raghunath is a financial journalist who writes about business, public equities, and personal finance. His work has been published on several digital platforms in the U.S. and Canada, including The Motley Fool, Finscreener, and Market Realist.

More…

The post EVgo vs. Blink Charging: Which Electric Vehicle Infrastructure Stock is a Better Choice? appeared first on StockNews.com

https://www.entrepreneur.com/article/390355


3 Chinese Electric Vehicle Stocks That Beat Sales in Q3

While the global chip shortage continues to impact Chinese EV companies, the industry has immense long-term growth potential. So, popular Chinese EV stocks NIO Inc. (NIO), XPeng Inc. (XPEV), and Li Auto Inc. (LI), which beat their third-quarter vehicle sales estimates, could be worth watching.

shutterstock.com – StockNews

Despite the semiconductor chip shortage severely affecting the electric vehicle (EV) industry, EV sales of Chinese companies have gotten a boost due to government subsidies and other preferential policies. In addition, the Chinese government would like 20% of new cars sold to be new energy vehicles by 2025.

Moreover, China’s Ministry of Industry and Information Technology indicated there could be sector consolidation. Tu Le, the founder of Beijing-based advisory firm Sino Auto Insights, said that he expects China’s top electric-car makers to benefit from efforts to consolidate the industry “since it’ll eliminate potential competitors and perhaps allow them to acquire a team or technology to enhance their products.”

As a result, famous Chinese EV makers NIO Inc. (NIO), XPeng Inc. (XPEV), and Li Auto Inc. (LI), which delivered higher-than-expected EV sales in the third quarter, could be solid additions to your watch list.

NIO Inc. (NIO)

Shanghai-based NIO designs, develops, manufactures, and sells smart EVs. Its offerings include five, six, and seven-seater electric SUVs and smart electric sedans. In addition, the company is involved in the provision of energy and service packages to its users and offers power solutions such as Power Home, which is a home charging solution.

On October 1, 2021, NIO announced that it had delivered 10,628 vehicles globally in September 2021, an all-time high monthly record representing a robust growth of 125.7% year-over-year. Moreover, it delivered 24,439 vehicles in the third quarter, representing a 100.2% year-over-year rise. The company exceeded the higher end of its quarterly guidance.

NIO’s total revenues grew 127.2% year-over-year to $1.31 billion for the second quarter ended June 30, 2021. While its adjusted net loss decreased 70.3% year-over-year to $52 million, its loss per share came in at $0.03, down 80.6% year-over-year.

Analysts expect NIO’s EPS to increase 106.2% for the quarter ending December 31, 2021. In addition, the company’s revenue is expected to increase 120.5% year-over-year to $5.63 billion in fiscal 2021. The stock gained 66.9% over the past year to close yesterday’s trading session at $35.99.

XPeng Inc. (XPEV)

Based in Guangzhou, XPEV designs, develops, manufactures, and markets smart EVs in China. It offers SUVs under the G3 name and four-door sports sedans under the P7 name. The company also provides sales contracts, maintenance, supercharging, vehicle leasing, and ride-hailing services.

On September 15, 2021, XPEV launched its third production model, the XPeng P5 smart family sedan, marking a generational leap in smart EV technology, safety, and sophistication for family cars in its class and price range. This could lead to an increase in sales.

XPEV achieved a quarterly record of 25,666 deliveries in the fiscal third quarter, representing a 48% quarter-over-quarter increase and a 199% year-over-year rise. The company’s total revenues grew 536.7% year-over-year to $582.50 million for the second quarter ended June 30, 2021. Also, its loss per share came in at $0.21, down 67.4% year-over-year.

XPEV’s EPS is expected to increase 42.3% in fiscal 2022. In addition, the company’s revenue is expected to increase 213.9% year-over-year to $2.85 billion in fiscal 2021. The stock has soared 89.8% over the past year to close yesterday’s trading session at $38.26.

Li Auto Inc. (LI)

Beijing-based LI designs, develops, manufactures, and sells smart electric sport utility vehicles in China. It offers Li ONE, a six-seat electric SUV equipped with a range of extension systems and smart vehicle solutions.

On October 1, 2021, LI announced that the company delivered 7,094 Li ONEs in September 2021, up 102.5% year-over-year. Its deliveries for the third quarter were 25,116, up 190% year-over-year.

For the second quarter ended June 30, 2021, LI’s total revenues grew 158.8% year-over-year to $780.40 million. The company’s non-GAAP net loss decreased 59.1% year-over-year to $10.10 million. Also, its free cash flow came in at $152.10 million, up 226.5% year-over-year.

For fiscal 2022, analysts expect LI’s EPS to increase 180% year-over-year to $0.08. In addition, the company’s revenue is expected to increase 154.2% year-over-year to $3.71 billion in fiscal 2021. The stock gained 62% over the past year to close yesterday’s trading session at $28.78.


NIO shares closed at $35.83 on Friday, down $-0.16 (-0.44%). Year-to-date, NIO has declined -26.49%, versus a 18.26% rise in the benchmark S&P 500 index during the same period.


About the Author: Nimesh Jaiswal

Nimesh Jaiswal’s fervent interest in analyzing and interpreting financial data led him to a career as a financial analyst and journalist. The importance of financial statements in driving a stock’s price is the key approach that he follows while advising investors in his articles.

More…

The post 3 Chinese Electric Vehicle Stocks That Beat Sales in Q3 appeared first on StockNews.com

https://www.entrepreneur.com/article/390354


Zacks.com featured highlights include: Penske Automotive, HCA Healthcare, Applied Materials, Boyd Gaming and General Dynamics

You’re reading Entrepreneur United States, an international franchise of Entrepreneur Media. This story originally appeared on Zacks

For Immediate Release

Chicago, IL – October 11, 2021 – Stocks in this week’s article are Penske Automotive Group Inc. PAG, HCA Healthcare Inc. HCA, Applied Materials Inc. AMAT, Boyd Gaming Corp. BYD and General Dynamics Corporation GD.

– Zacks

5 Cheap Dividend Growth Stocks Worthy of Your Attention

Stock market volatility has been driving the appeal for dividend investing. Though the strategy doesn’t offer dramatic price appreciation, it is a major source of consistent income in the form of an increase in payout in any type of market.

Stocks that have a strong history of dividend growth as opposed to those that offer high yields form a healthy portfolio with more scope for capital appreciation.

For the rest of this Screen of the Week article please visit Zacks.com at: https://www.zacks.com/stock/news/1808220/5-cheap-dividend-growth-stocks-worth-your-attention

Disclosure: Officers, directors and/or employees of Zacks Investment Research may own or have sold short securities and/or hold long and/or short positions in options that are mentioned in this material. An affiliated investment advisory firm may own or have sold short securities and/or hold long and/or short positions in options that are mentioned in this material.

About Screen of the Week

Zacks.com created the first and best screening system on the web earning the distinction as the “#1 site for screening stocks” by Money Magazine.  But powerful screening tools is just the start. That is why Zacks created the Screen of the Week to highlight profitable stock picking strategies that investors can actively use.

Strong Stocks that Should Be in the News

Many are little publicized and fly under the Wall Street radar. They’re virtually unknown to the general public. Yet today’s 220 Zacks Rank #1 “Strong Buys” were generated by the stock-picking system that has more than doubled the market from 1988 through 2016. Its average gain has been a stellar +25% per year. See these high-potential stocks free >>.

Follow us on Twitter:  https://www.twitter.com/zacksresearch


Join us on Facebook:  https://www.facebook.com/ZacksInvestmentResearch


Zacks Investment Research is under common control with affiliated entities (including a broker-dealer and an investment adviser), which may engage in transactions involving the foregoing securities for the clients of such affiliates.


Contact: Jim Giaquinto

Company: Zacks.com

Phone: 312-265-9268

Email: pr@zacks.com

Visit: www.Zacks.com


Zacks.com provides investment resources and informs you of these resources, which you may choose to use in making your own investment decisions. Zacks is providing information on this resource to you subject to the Zacks “Terms and Conditions of Service” disclaimer. www.zacks.com/disclaimer.


Past performance is no guarantee of future results. Inherent in any investment is the potential for loss. This material is being provided for informational purposes only and nothing herein constitutes investment, legal, accounting or tax advice, or a recommendation to buy, sell or hold a security. No recommendation or advice is being given as to whether any investment is suitable for a particular investor. It should not be assumed that any investments in securities, companies, sectors or markets identified and described were or will be profitable. All information is current as of the date of herein and is subject to change without notice. Any views or opinions expressed may not reflect those of the firm as a whole. Zacks Investment Research does not engage in investment banking, market making or asset management activities of any securities. These returns are from hypothetical portfolios consisting of stocks with Zacks Rank = 1 that were rebalanced monthly with zero transaction costs. These are not the returns of actual portfolios of stocks. The S&P 500 is an unmanaged index. Visit https://www.zacks.com/performance for information about the performance numbers displayed in this press release.

Tech IPOs With Massive Profit Potential

In the past few years, many popular platforms and like Uber and Airbnb finally made their way to the public markets. But the biggest paydays came from lesser-known names.

For example, electric carmaker X Peng shot up +299.4% in just 2 months. Think of it this way…

If you had put $5,000 into XPEV at its IPO in September 2020, you could have cashed out with $19,970 in November.

With record amounts of cash flooding into IPOs and a record-setting stock market, this year’s lineup could be even more lucrative.

See Zacks Hottest Tech IPOs Now >>

Want the latest recommendations from Zacks Investment Research? Today, you can download 7 Best Stocks for the Next 30 Days. Click to get this free report
 
General Dynamics Corporation (GD): Free Stock Analysis Report
 
Penske Automotive Group, Inc. (PAG): Free Stock Analysis Report
 
Applied Materials, Inc. (AMAT): Free Stock Analysis Report
 
Boyd Gaming Corporation (BYD): Free Stock Analysis Report
 
HCA Healthcare, Inc. (HCA): Free Stock Analysis Report
 
To read this article on Zacks.com click here.
 
Zacks Investment Research

https://www.entrepreneur.com/article/390392


Penn Virginia (PVAC), Lonestar Complete All-Stock Merger Deal

You’re reading Entrepreneur United States, an international franchise of Entrepreneur Media. This story originally appeared on Zacks

Penn Virginia Corporation PVAC completed its previously announced all-stock merger deal with Lonestar Resources US Inc.

– Zacks

The company aims to officially rebrand itself as Ranger Oil Corporation, which will be in effect from Oct 18, 2021. The merged entity will begin trading under the ticker symbol of ROCC. The official rebranding is expected to complete by the end of 2021.

Per the terms of the deal, Penn Virginia shareholders will now own 87% of the merged entity, while Lonestar shareholders will own the rest. The transaction strengthens Penn Virginia’s position as a leading Eagle Ford operator and will provide additional scale and synergies.

The resources of both companies will create a consolidated asset position, which spreads about 140,000 net acres placed in the core of the Eagle Ford shale in South Texas. It is expected to have a production capacity of 40,000 barrels of oil equivalent per day.

Penn Virginia has been identified among the Eagle Ford operators with a lower carbon footprint. The company currently plans to target further developments as it integrates the Lonestar assets. In addition, the company will continue to develop its diverse and inclusive environment, and increase its community engagement efforts.

In fourth-quarter 2021, the new company will proceed with the ongoing development operations planned for both Penn Virginia and Lonestar, which include the continuation of the two currently operating rigs and ongoing completion activities. Total capital expenditure for fourth-quarter 2021 is expected to be $65-$75 million.

The merged entity’s impressive financial position and additional scope are expected to provide potential consolidation opportunities. Penn Virginia expects the combined company Ranger to produce more than $200 million of free cash flow in 2022.

Company Profile & Price Performance

Headquartered in Houston, TX, Penn Virginia is an upstream company that engages in the exploration, development, and production of oil, NGLs and natural gas.

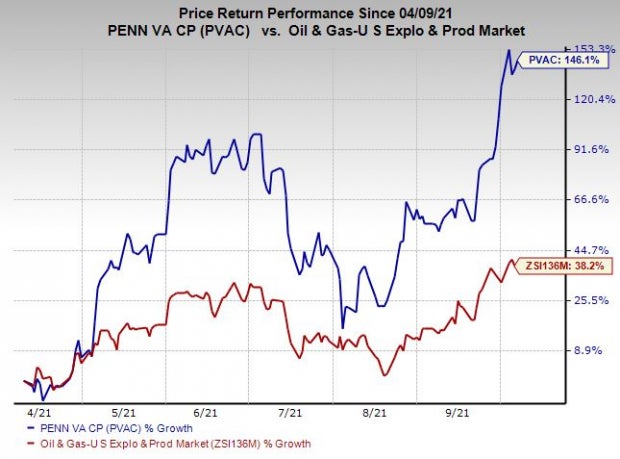
Shares of the company have outperformed the industry in the past six months. The stock has gained 146.1% compared with the industry’s 38.2% growth.

Zacks Investment ResearchImage Source: Zacks Investment Research

Zacks Rank & Other Key Picks

Penn Virginia currently has a Zack Rank #2 (Buy).

Some other top-ranked players in the energy space are Cheniere Energy, Inc. LNG, Tullow Oil plc TUWOY and Enbridge Inc. ENB, each currently carrying a Zacks Rank #2. You can see the complete list of today’s Zacks #1 Rank (Strong Buy) stocks here.

Cheniere’s 2021 earnings are expected to surge 119.7% year over year.

Tullow’s 2021 earnings are expected to increase 33.3% year over year.

Enbridge’s 2021 earnings are expected to rise 13.4% year over year.

Infrastructure Stock Boom to Sweep America

A massive push to rebuild the crumbling U.S. infrastructure will soon be underway. It’s bipartisan, urgent, and inevitable. Trillions will be spent. Fortunes will be made.

The only question is “Will you get into the right stocks early when their growth potential is greatest?”

Zacks has released a Special Report to help you do just that, and today it’s free. Discover 7 special companies that look to gain the most from construction and repair to roads, bridges, and buildings, plus cargo hauling and energy transformation on an almost unimaginable scale.

Download FREE: How to Profit from Trillions on Spending for Infrastructure >>

Want the latest recommendations from Zacks Investment Research? Today, you can download 7 Best Stocks for the Next 30 Days. Click to get this free report
 
Enbridge Inc (ENB): Free Stock Analysis Report
 
Cheniere Energy, Inc. (LNG): Free Stock Analysis Report
 
Tullow Oil PLC (TUWOY): Free Stock Analysis Report
 
Penn Virginia Corporation (PVAC): Free Stock Analysis Report
 
To read this article on Zacks.com click here.
 
Zacks Investment Research

https://www.entrepreneur.com/article/390284


What Will Q3 Bank Earnings Show?

The large money-center banks that will kick-off the 2021 Q3 earnings season for the sector this week have enjoyed an impressive run lately, helping these stocks handily outperform the broader market this year.

– Zacks

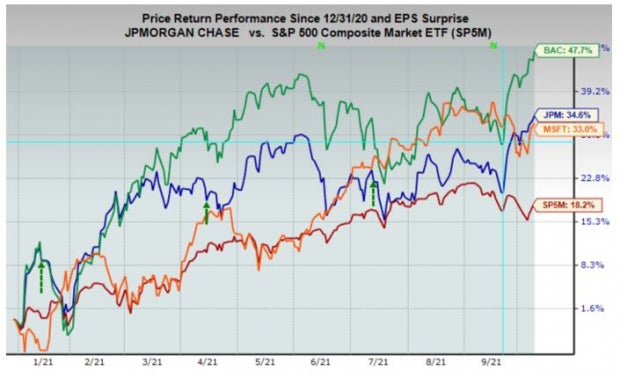
You can see this in the chart below that plots the year-to-date performance of JPMorgan JPM and Bank of America BAC, which will report September-quarter results before the market’s open on Wednesday (10/13) and Thursday (10/14), respectively.

Zacks Investment ResearchImage Source: Zacks Investment Research

We added Microsoft MSFT to the chart above (orange line) to give you a sense of how the bank stocks have fared relative to one of the strongest performing mega-cap tech stocks. The red line in the chart represents the S&P 500 index, which is up only +18.2% and has clearly lagged these three stocks.

With respect to reserve releases, the bulk of the activity took place in the first half of the year. But we do expect some additional reserve releases in the Q3 reports, given the stable macroeconomic and credit market conditions.

On the core banking side, we don’t expect any notable improvement in performance, with the market looking for evidence that the long-awaited loan growth trend has finally arrived. Net interest margin likely ticked up in Q3 on the back of the September rise in treasury yields.

While we don’t expect much on the core banking side, we do expect strong numbers in the capital markets business, particularly on the investment banking side, while trading revenues are faced with tough comparisons to the year-earlier period. Trading revenues are expected to be below the year-earlier period, with fixed income weakness offsetting equities strength. The advisory side of the business continued to hum, with M&A activities continuing their record volume from the preceding period.

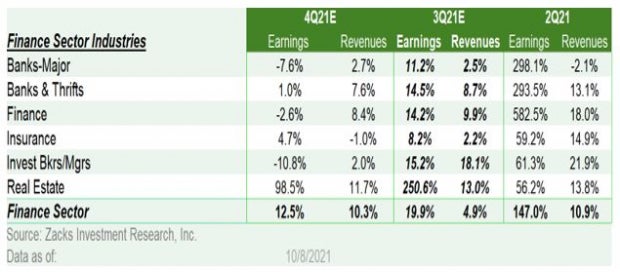
For the Zacks Major Banks industry, which includes these major banks and account for roughly 45% of the Finance sector’s total earnings, Q3 earnings are expected to be up +11.2% on +2.5% higher revenues. This would follow +298.1% earnings growth on -2.1% lower revenues in the preceding period (2021 Q2).

For the Finance sector as a whole, total Q3 earnings are expected to be up +19.9% on +4.9% higher revenues.

The chart below shows Q3 expectations for the Finance sector’s constituent industries in the context of what these industries reported in 2021 Q2 and what is expected for 2021 Q4 when the comparisons ease off further.

Zacks Investment ResearchImage Source: Zacks Investment Research

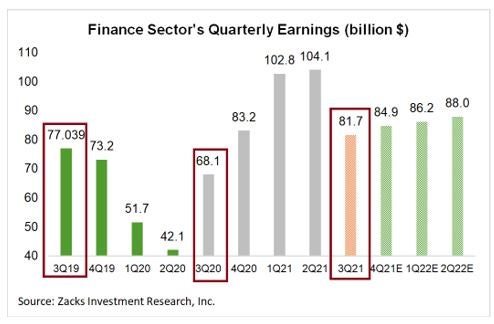
The market knows that the eye-popping earnings growth of the last few quarters was mostly due to easy comparisons. But the sector’s Q2 earnings are expected to be above the pre-Covid 2019 Q2 period by +6%. You can see this in the chart below that shows the sector’s Q3 aggregate earnings expectations in the context of what has been reported in the preceding 8 periods and estimates for the coming 3 quarters.

Zacks Investment ResearchImage Source: Zacks Investment Research

Please note that Q3 is typically the seasonally weak period for the group.

Expectations for Q3 & Beyond

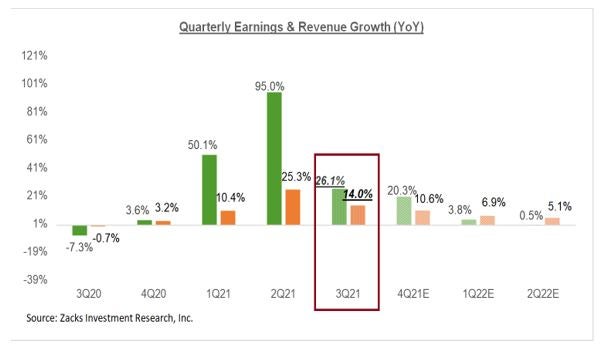
Total Q3 earnings for the S&P 500 index are expected to be up +26.1% from the same period last year on +14% higher revenues.

The revisions trend for the period showed signs of deceleration after remaining positive for the last few quarters. A combination of the impact of the Delta variant and supply-chain disruptions are likely at play in the unfavorable shift in the revisions trend.

Some of the early Q3 reports from the likes of FedEx FDX, Nike NKE and others have reconfirmed these unfavorable developments that are weighing on the near-term earnings outlook. It is reasonable to expect this trend to continue into the last quarter of the year as well (2021 Q4), but current consensus estimates don’t reflect this unfavorable trend having any enduring staying power.

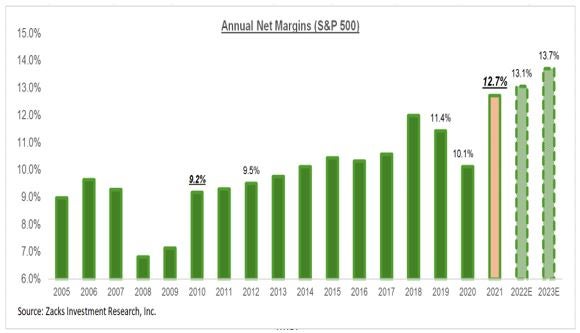
This view is in-line with the Fed’s ‘pricing-pressures-are-transitory’ narrative, which leaves estimates at risk of negative adjustment should the inflation issue turns out to be more troublesome. You can see this view at play in the below net income margins picture.

Zacks Investment ResearchImage Source: Zacks Investment Research

The chart below presents the earnings and revenue growth picture on a quarterly basis, with expectations for 2021 Q3 contrasted with the actual growth achieved over the preceding four quarters and estimates for the following three.

Zacks Investment ResearchImage Source: Zacks Investment Research

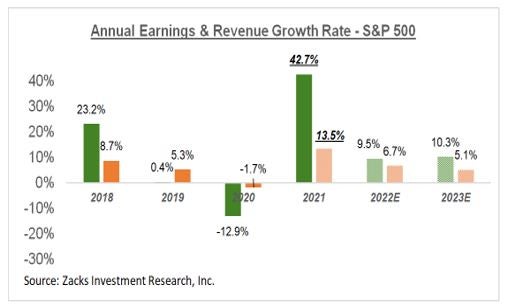
The chart below shows the comparable picture on an annual basis.

Zacks Investment ResearchImage Source: Zacks Investment Research

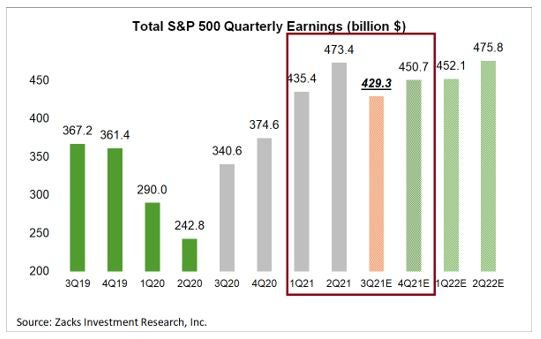
We mentioned earlier how the aggregate 2021 Q2 earnings tally represented a new all-time quarterly record. You can see that in the chart below, with this year’s four quarters highlighted.

Zacks Investment ResearchImage Source: Zacks Investment Research

We all know that large segments of the economy, particularly in the broader leisure, travel and hospitality spaces are held down by the pandemic, with companies in these areas still earning significantly less than they did in the pre-Covid period. In fact, many of these companies aren’t expected to get back to pre-Covid profitability levels for almost one more year.

The impressive feature of the record earnings in each of the last two quarters is that they were achieved without help from these key parts of the economy.

Earnings Season Gets Underway

Most companies have fiscal quarters that correspond with the calendar periods. As such, the wide majority of Q3 earnings reports will be from companies that have fiscal quarters ending in September. But there are some companies that have fiscal quarters ending in August and a number of them have been reporting their fiscal August-quarter results in recent days.

The earnings releases in recent days from the likes of FedEx, Oracle ORCL, Adobe ADBE, Nike and others all fall in this category; they all had fiscal quarters ending in August. We count all of these reports as part of our Q3 earnings tally.

Through Friday, October 8th, we have seen such Q3 results from 21 S&P 500 members. This week will bring results from companies with fiscal quarters ending in September, starting with Fastenal FAST on Monday, October 12th. In total, we will see Q3 results from 17 index members, including the aforementioned major banks and brokers.

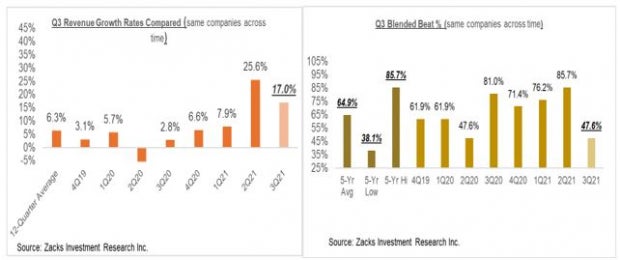
For the 21 index members that have reported Q3 results already, total earnings are up +20.1% from the same period last year on +17% higher revenues, with 76.2% beating EPS estimates and 61.9% beating revenue estimates. The proportion of these 21 index members beating both EPS and revenue estimates is 47.6%.

This is too early and the sample size is too small to offer us any interpretive guidance, but the very strong momentum on the revenue side that was a notable feature of the Q2 earnings season doesn’t appear to be present at this admittedly early stage.

Zacks Investment ResearchImage Source: Zacks Investment Research

For a detailed look at the overall earnings picture, including expectations for the coming periods, please check out our weekly Earnings Trends report >>>>Q3 Earnings Season Gets Underway

Infrastructure Stock Boom to Sweep America

A massive push to rebuild the crumbling U.S. infrastructure will soon be underway. It’s bipartisan, urgent, and inevitable. Trillions will be spent. Fortunes will be made.

The only question is “Will you get into the right stocks early when their growth potential is greatest?”

Zacks has released a Special Report to help you do just that, and today it’s free. Discover 7 special companies that look to gain the most from construction and repair to roads, bridges, and buildings, plus cargo hauling and energy transformation on an almost unimaginable scale.

Download FREE: How to Profit from Trillions on Spending for Infrastructure >>

Want the latest recommendations from Zacks Investment Research? Today, you can download 7 Best Stocks for the Next 30 Days. Click to get this free report
 
Bank of America Corporation (BAC): Free Stock Analysis Report
 
JPMorgan Chase & Co. (JPM): Free Stock Analysis Report
 
Microsoft Corporation (MSFT): Free Stock Analysis Report
 
NIKE, Inc. (NKE): Free Stock Analysis Report
 
Fastenal Company (FAST): Free Stock Analysis Report
 
Oracle Corporation (ORCL): Free Stock Analysis Report
 
Adobe Inc. (ADBE): Free Stock Analysis Report
 
FedEx Corporation (FDX): Free Stock Analysis Report
 
To read this article on Zacks.com click here.
 
Zacks Investment Research

https://www.entrepreneur.com/article/390285