Here’s What Makes Chemours (CC) Stock A Solid Bet Right Now

You’re reading Entrepreneur United States, an international franchise of Entrepreneur Media. This story originally appeared on Zacks

The Chemours Company CC is benefiting from higher demand for Opteon in mobile applications, strong execution and cost-cutting measures. We are positive on the company’s prospects and believe that the time is right for you to add the stock to the portfolio as it looks promising and is poised to carry the momentum ahead.
Chemours currently carries a Zacks Rank #1 (Strong Buy) and a VGM Score of A. Our research shows that stocks with a VGM Score of A or B, combined with a Zacks Rank #1 or 2 (Buy), offer the best investment opportunities for investors.
Let’s see what makes this chemical maker a compelling investment option at the moment.

– Zacks

Price Performance

Shares of Chemours have rallied 36.6% over a year compared with the 20.7% rise of its industry. It has also outperformed the S&P 500’s 31.3% rise over the same period.
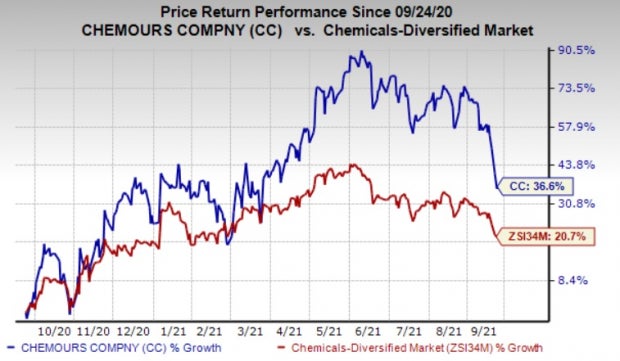
 

Zacks Investment Research
Image Source: Zacks Investment Research


Estimates Moving Up

Over the past two months, the Zacks Consensus Estimate for Chemours for the current year has increased around 11.5%. The consensus estimate for third-quarter 2021 has also been revised 9% upward over the same time frame. The favorable estimate revisions instill investor confidence in the stock.

Positive Earnings Surprise History

Chemours has outpaced the Zacks Consensus Estimate in each of the trailing four quarters. In this time frame, it has delivered an earnings surprise of 38.9%, on average.

Solid Growth Prospects

The Zacks Consensus Estimate for earnings for 2021 for Chemours is currently pegged at $3.69, reflecting an expected year-over-year growth of 86.4%. Moreover, earnings are expected to register 106.4% growth in third-quarter 2021.

Attractive Valuation

Valuation looks attractive as Chemours’ shares are currently trading at a level that is lower than the industry average, suggesting that the stock still has upside potential.
Going by the EV/EBITDA (Enterprise Value/ Earnings before Interest, Tax, Depreciation and Amortization) multiple, which is often used to value chemical stocks, Chemours is currently trading at trailing 12-month EV/EBITDA multiple of 7.67, cheaper compared with the industry average of 9.89.

Upbeat Prospects

Chemours is gaining from a rebound in demand from the pandemic-led lows, strong execution and its cost-reduction actions. The company is seeing demand revival across all markets and regions on the global macroeconomic recovery.
The company is witnessing increasing adoption of the Opteon platform. Demand for Opteon remains strong in mobile and stationary applications. Chemours remains committed toward driving Opteon adoption. It is ramping up production at the new low-cost Opteon Corpus Christi facility.
Chemours should also gain from its efforts to reduce costs. It is undertaking actions to cut costs by reducing overhead, discretionary spend and capital expenditures. The company’s cost-reduction program along with its productivity and operational improvement actions across its businesses are expected to support margins in 2021.
The company also remains focused on boosting its cash flows and returning value to shareholders. It generated strong free cash flow of $189 million in the second quarter. Chemours expects to generate free cash flow of more than $450 million in 2021 and return the majority of this to its shareholders through dividend and share repurchases.


Stocks to Consider

Other top-ranked stocks worth considering in the basic materials space include The Mosaic Company MOS, United States Steel Corporation X and AdvanSix Inc. ASIX, each sporting a Zacks Rank #1. You can see the complete list of today’s Zacks #1 Rank stocks here.
Mosaic has an expected earnings growth rate of 471.8% for the current year. The stock has also rallied around 76% over a year.

U.S. Steel has a projected earnings growth rate of 368.9% for the current year. The company’s shares have shot up around 204% in a year.
AdvanSix has a projected earnings growth rate of 160.4% for the current year. The company’s shares have surged around 204% in a year.

More Stock News: This Is Bigger than the iPhone!

It could become the mother of all technological revolutions. Apple sold a mere 1 billion iPhones in 10 years but a new breakthrough is expected to generate more than 77 billion devices by 2025, creating a $1.3 trillion market.

Zacks has just released a Special Report that spotlights this fast-emerging phenomenon and 4 tickers for taking advantage of it. If you don’t buy now, you may kick yourself in 2022.

Click here for the 4 trades >>

Want the latest recommendations from Zacks Investment Research? Today, you can download 7 Best Stocks for the Next 30 Days. Click to get this free report
 
United States Steel Corporation (X): Free Stock Analysis Report
 
The Mosaic Company (MOS): Free Stock Analysis Report
 
The Chemours Company (CC): Free Stock Analysis Report
 
AdvanSix Inc. (ASIX): Free Stock Analysis Report
 
To read this article on Zacks.com click here.

https://www.entrepreneur.com/article/387246



Saia (SAIA) Sees Hammer Chart Pattern: Time to Buy?

You’re reading Entrepreneur United States, an international franchise of Entrepreneur Media. This story originally appeared on Zacks

Saia, Inc. SAIA has been struggling lately, but the selling pressure may be coming to an end soon. That is because SAIA recently saw a Hammer Chart Pattern which can signal that the stock is nearing a bottom.

– Zacks

What is a Hammer Chart Pattern?

A hammer chart pattern is a popular technical indicator that is used in candlestick charting. The hammer appears when a stock tumbles during the day, but then finds strength at some point in the session to close near or above its opening price. This forms a candlestick that resembles a hammer, and it can suggest that the market has found a low point in the stock, and that better days are ahead.

Other Factors

Plus, earnings estimates have been rising for this company, even despite the sluggish trading lately. In just the past 60 days alone 9 estimates have gone higher, compared to none lower, while the consensus estimate has also moved in the right direction.

Estimates have actually risen so much that the stock now has a Zacks Rank #2 (Buy) suggesting this relatively unloved stock could be due for a breakout soon. This will be especially true if SAIA stock can build momentum from here and find a way to continue higher of off this encouraging trading development. You can see the complete list of today’s Zacks #1 Rank (Strong Buy) stocks here.

Infrastructure Stock Boom to Sweep America

A massive push to rebuild the crumbling U.S. infrastructure will soon be underway. It’s bipartisan, urgent, and inevitable. Trillions will be spent. Fortunes will be made.

The only question is “Will you get into the right stocks early when their growth potential is greatest?”

Zacks has released a Special Report to help you do just that, and today it’s free. Discover 7 special companies that look to gain the most from construction and repair to roads, bridges, and buildings, plus cargo hauling and energy transformation on an almost unimaginable scale.

Download FREE: How to Profit from Trillions on Spending for Infrastructure >>

Want the latest recommendations from Zacks Investment Research? Today, you can download 7 Best Stocks for the Next 30 Days. Click to get this free report
 
Saia, Inc. (SAIA): Free Stock Analysis Report
 
To read this article on Zacks.com click here.
 
Zacks Investment Research

https://www.entrepreneur.com/article/386971


Nucor (NUE) Sees Hammer Chart Pattern: Time to Buy?

You’re reading Entrepreneur United States, an international franchise of Entrepreneur Media. This story originally appeared on Zacks

Nucor Corporation NUE has been struggling lately, but the selling pressure may be coming to an end soon. That is because NUE recently saw a Hammer Chart Pattern which can signal that the stock is nearing a bottom.

– Zacks

What is a Hammer Chart Pattern?

A hammer chart pattern is a popular technical indicator that is used in candlestick charting. The hammer appears when a stock tumbles during the day, but then finds strength at some point in the session to close near or above its opening price. This forms a candlestick that resembles a hammer, and it can suggest that the market has found a low point in the stock, and that better days are ahead.

Other Factors

Plus, earnings estimates have been rising for this company, even despite the sluggish trading lately. In just the past 60 days alone 3 estimates have gone higher, compared to none lower, while the consensus estimate has also moved in the right direction.

Estimates have actually risen so much that the stock now has a Zacks Rank #1 (Strong Buy) suggesting this relatively unloved stock could be due for a breakout soon. This will be especially true if NUE stock can build momentum from here and find a way to continue higher of off this encouraging trading development. You can see the complete list of today’s Zacks #1 Rank stocks here.

Infrastructure Stock Boom to Sweep America

A massive push to rebuild the crumbling U.S. infrastructure will soon be underway. It’s bipartisan, urgent, and inevitable. Trillions will be spent. Fortunes will be made.

The only question is “Will you get into the right stocks early when their growth potential is greatest?”

Zacks has released a Special Report to help you do just that, and today it’s free. Discover 7 special companies that look to gain the most from construction and repair to roads, bridges, and buildings, plus cargo hauling and energy transformation on an almost unimaginable scale.

Download FREE: How to Profit from Trillions on Spending for Infrastructure >>

Want the latest recommendations from Zacks Investment Research? Today, you can download 7 Best Stocks for the Next 30 Days. Click to get this free report
 
Nucor Corporation (NUE): Free Stock Analysis Report
 
To read this article on Zacks.com click here.
 
Zacks Investment Research

https://www.entrepreneur.com/article/386972


Bear of the Day: Americas CarMart (CRMT)

You’re reading Entrepreneur United States, an international franchise of Entrepreneur Media. This story originally appeared on Zacks
[embedded content]

America’s Car-Mart (CRMT) is a Zacks Rank #5 (Strong Sell) that operates automotive dealerships and is one of the largest auto retailers in the United States.

– Zacks

The stock has benefitted all year as the used car market was hot due to higher prices on short supply. However, that dynamic might be hurting the industry now. After the company reported earnings, the stock has pulled back significantly and is now off 33% from 2021 highs.

More about CRMT

America’s Car-Mart was founded in 1981 and is headquartered in Rogers, Arkansas. As of April 30, 2021, it operated 151 dealerships in the South-Central United States. CRMT employs 2000 people and has a market cap of $800 million.  

The Company operates its dealerships primarily in small cities and rural locations throughout the South-Central United States. They focus on customers that may not qualify for traditional used car financing because of bad credit history.

The stock has a Zacks Style Score of “B” in Value. However, the stock is rated “F” in both Growth and Momentum.

Q1 Earnings

In August, the company reported a Q1 EPS beat of half a percent. Revenue came in above expectations and same store revenue growth was up 46.7% v 5.5% last year.

At first glance the numbers look fine, but while the market was expecting the number that was reported, investors were used to the company blowing out numbers. For the quarter reported in May, the company saw a 130% EPS beat, so when EPS came in as expected, investors were a bit disappointed.  

Additionally, the company saw margins compressed more than expected. This is due to the tight used car market as inventory’s remain low.

Stock Crashes

While the sales numbers aren’t bad, investors are worried about the used car market. What used to be a tailwind in rising prices is now a headwind in low supply. The stock dropped from $160, to $130 in one day, a drop of almost 20%. 

Estimates

Over the last 60 days, analysts have consistently taken down their numbers. For the current quarter, estimates have fallen 7%, from $3.68 to $3.41. For the current year, numbers have fallen by 6%.

The Technicals

Before earnings, CRMT had a great looking chart. However, the stock saw no support at the 200-day moving average. While the stock is down only slightly from the post-earnings lows, there seems to be no life. Investors likely have to wait for the next catalyst to get some movement either way.

For those that might want to buy the dip, the $90 level is the 61.8% Fib retracement drawn from the COVID lows to all-time highs.

In Summary

CRMT has had a major setback with investors, causing the stock to fall in similar fashion to the COVID crash. Until the supply/demand dynamic of the used car market normalizes, investors are best looking somewhere else.

For those interested in the auto retail space, AutoNation (AN) might be a better bet. This company is seeing estimates trend higher for the current year and is a Zacks Rank #1 (Strong Buy). 
 

Infrastructure Stock Boom to Sweep America

A massive push to rebuild the crumbling U.S. infrastructure will soon be underway. It’s bipartisan, urgent, and inevitable. Trillions will be spent. Fortunes will be made.

The only question is “Will you get into the right stocks early when their growth potential is greatest?”

Zacks has released a Special Report to help you do just that, and today it’s free. Discover 7 special companies that look to gain the most from construction and repair to roads, bridges, and buildings, plus cargo hauling and energy transformation on an almost unimaginable scale.

Download FREE: How to Profit from Trillions on Spending for Infrastructure >>

Want the latest recommendations from Zacks Investment Research? Today, you can download 7 Best Stocks for the Next 30 Days. Click to get this free report
 
Americas CarMart, Inc. (CRMT): Free Stock Analysis Report
 
To read this article on Zacks.com click here.

https://www.entrepreneur.com/article/386973


Bull of the Day: Caseys General Stores (CASY)

You’re reading Entrepreneur United States, an international franchise of Entrepreneur Media. This story originally appeared on Zacks

Casey’s General Stores (CASY) is a Zacks Rank #1 (Strong Buy) that operates convenience stores under the Casey’s and Casey’s General Store names.

– Zacks

The stock had a nice run higher earlier in the year, but after a recent earnings beat, almost all the 2021 gains have been erased. Investors are now looking at why the stock has sold off and eyeing levels to buy the dip.

About the Company

Casey’s stores offer a selection of food, nicotine products, automotive products, and many more items you would typically find in convenient stores. Loyal customers are a fan of their pizza, but if you have traveled in the Midwest, you might be familiar with the company as a gas station. Casey provides gasoline and diesel fuel in over 2000 stores in 16 states.

The company has almost 18,000 full time employees and is headquartered in Ankeny, Iowa. Casey’s has a market cap of $7 Billion and has Zacks Style Scores of “B” in Growth and Value. The stock has a Forward PE of 22 and pays a 0.75% dividend.

Q1 Earnings

Earlier this month the company reported earnings, seeing a 13% EPS beat. The company also beat on revenue and raised its dividend by a penny. Adjusted EBITDA came in above expectations and inside SSS were up 8%.

Casey’s also affirmed FY22 fuel and inside SSS, which indicates growth of mid-single digit percentages.

CEO Darren Rebelez had the following comments on the quarter:

“Total revenue was up across the board as guest traffic returned throughout the quarter. Inside gross profit was up almost 17% due in part to the merchandise resets and strategic sourcing initiatives the Company implemented earlier this calendar year.”

While the numbers looked good, the stock sold off to prices not seen since February.

Pullback Unjustified

Jefferies was out with a note shortly after earnings making the case that the post-earnings sell-off was not justified. The firm believes the year over year opex growth created some fear, but there are many positives that were overshadowed by the headline.

Jefferies points out that elevated fuel margins, longer-term growth due to M&A, and positioning relative to peers as reasons as why they have a Buy rating. The firm has a $237 price target, about 25% higher from current levels.

Estimates

Jefferies isn’t the only analyst that likes the stock, as estimates are going up across the board.

Over the last month, estimates for the current quarter have been raised by 8%, from $2.57 to $2.78. For the current year, we have seen jump of 11% in that same time frame.

Since earnings, both Deutsche Bank and Northcoast Research raised price targets to $256 and $247 respectively.

The Technicals

CASY was up almost 30% on the year when it hit an all-time high of $229 back in May. However, the stock is now trading under $190, or 17% lower.

The stock is below all moving averages, with the 50-day at $197 and the 200-day at $202. Eventually, the bulls will need to recapture those levels for technical analysts to get bullish again.

In the meantime, investors should look at $180 a as long-term support area to accumulate. If the market does see a sell off, CASY could fall in sympathy to the 61.8% Fibonacci retracement at $160. This area between $160-$180 should a buy zone for anyone interested in the stock.

Bottom Line

Those that have driven though the Midwest are familiar with Casey’s. Their gas stations and convenience stores are a staple on any road trip in the middle of the country.

The stock has had a rough summer, but the recent sell off isn’t justified. Estimates are going up and the company has a lot of growth potential as it expands through M&A. Additionally, with gas prices elevated, margins will continue to help the bottom line.

With the recent sell off, the stock might need time to digest. Investors should be eyeballing current prices as an opportunity for long-term entry.

Infrastructure Stock Boom to Sweep America

A massive push to rebuild the crumbling U.S. infrastructure will soon be underway. It’s bipartisan, urgent, and inevitable. Trillions will be spent. Fortunes will be made.

The only question is “Will you get into the right stocks early when their growth potential is greatest?”

Zacks has released a Special Report to help you do just that, and today it’s free. Discover 7 special companies that look to gain the most from construction and repair to roads, bridges, and buildings, plus cargo hauling and energy transformation on an almost unimaginable scale.

Download FREE: How to Profit from Trillions on Spending for Infrastructure >>

Want the latest recommendations from Zacks Investment Research? Today, you can download 7 Best Stocks for the Next 30 Days. Click to get this free report
 
Caseys General Stores, Inc. (CASY): Free Stock Analysis Report
 
To read this article on Zacks.com click here.
 
Zacks Investment Research

https://www.entrepreneur.com/article/386974


ICF International (ICFI) Sees Hammer Chart Pattern: Time to Buy?

You’re reading Entrepreneur United States, an international franchise of Entrepreneur Media. This story originally appeared on Zacks

ICF International, Inc. ICFI has been struggling lately, but the selling pressure may be coming to an end soon. That is because ICFI recently saw a Hammer Chart Pattern which can signal that the stock is nearing a bottom.

– Zacks

What is a Hammer Chart Pattern?

A hammer chart pattern is a popular technical indicator that is used in candlestick charting. The hammer appears when a stock tumbles during the day, but then finds strength at some point in the session to close near or above its opening price. This forms a candlestick that resembles a hammer, and it can suggest that the market has found a low point in the stock, and that better days are ahead.

Other Factors

Plus, earnings estimates have been rising for this company, even despite the sluggish trading lately. In just the past 60 days alone 2 estimates have gone higher, compared to none lower, while the consensus estimate has also moved in the right direction.

Estimates have actually risen so much that the stock now has a Zacks Rank #2 (Buy) suggesting this relatively unloved stock could be due for a breakout soon. This will be especially true if ICFI stock can build momentum from here and find a way to continue higher of off this encouraging trading development. You can see the complete list of today’s Zacks #1 Rank (Strong Buy) stocks here.

Infrastructure Stock Boom to Sweep America

A massive push to rebuild the crumbling U.S. infrastructure will soon be underway. It’s bipartisan, urgent, and inevitable. Trillions will be spent. Fortunes will be made.

The only question is “Will you get into the right stocks early when their growth potential is greatest?”

Zacks has released a Special Report to help you do just that, and today it’s free. Discover 7 special companies that look to gain the most from construction and repair to roads, bridges, and buildings, plus cargo hauling and energy transformation on an almost unimaginable scale.

Download FREE: How to Profit from Trillions on Spending for Infrastructure >>

Want the latest recommendations from Zacks Investment Research? Today, you can download 7 Best Stocks for the Next 30 Days. Click to get this free report
 
ICF International, Inc. (ICFI): Free Stock Analysis Report
 
To read this article on Zacks.com click here.
 
Zacks Investment Research

https://www.entrepreneur.com/article/386975


Daseke (DSKE) Sees Hammer Chart Pattern: Time to Buy?

You’re reading Entrepreneur United States, an international franchise of Entrepreneur Media. This story originally appeared on Zacks

Daseke, Inc. DSKE has been struggling lately, but the selling pressure may be coming to an end soon. That is because DSKE recently saw a Hammer Chart Pattern which can signal that the stock is nearing a bottom.

– Zacks

What is a Hammer Chart Pattern?

A hammer chart pattern is a popular technical indicator that is used in candlestick charting. The hammer appears when a stock tumbles during the day, but then finds strength at some point in the session to close near or above its opening price. This forms a candlestick that resembles a hammer, and it can suggest that the market has found a low point in the stock, and that better days are ahead.

Other Factors

Plus, earnings estimates have been rising for this company, even despite the sluggish trading lately. In just the past 60 days alone 2 estimates have gone higher, compared to none lower, while the consensus estimate has also moved in the right direction.

Estimates have actually risen so much that the stock now has a Zacks Rank #2 (Buy) suggesting this relatively unloved stock could be due for a breakout soon. This will be especially true if DSKE stock can build momentum from here and find a way to continue higher of off this encouraging trading development. You can see the complete list of today’s Zacks #1 Rank (Strong Buy) stocks here.

Infrastructure Stock Boom to Sweep America

A massive push to rebuild the crumbling U.S. infrastructure will soon be underway. It’s bipartisan, urgent, and inevitable. Trillions will be spent. Fortunes will be made.

The only question is “Will you get into the right stocks early when their growth potential is greatest?”

Zacks has released a Special Report to help you do just that, and today it’s free. Discover 7 special companies that look to gain the most from construction and repair to roads, bridges, and buildings, plus cargo hauling and energy transformation on an almost unimaginable scale.

Download FREE: How to Profit from Trillions on Spending for Infrastructure >>

Want the latest recommendations from Zacks Investment Research? Today, you can download 7 Best Stocks for the Next 30 Days. Click to get this free report
 
Daseke, Inc. (DSKE): Free Stock Analysis Report
 
To read this article on Zacks.com click here.
 
Zacks Investment Research

https://www.entrepreneur.com/article/386976


CSW Industrials (CSWI) Sees Hammer Chart Pattern: Time to Buy?

You’re reading Entrepreneur United States, an international franchise of Entrepreneur Media. This story originally appeared on Zacks

CSW Industrials, Inc. CSWI has been struggling lately, but the selling pressure may be coming to an end soon. That is because CSWI recently saw a Hammer Chart Pattern which can signal that the stock is nearing a bottom.

– Zacks

What is a Hammer Chart Pattern?

A hammer chart pattern is a popular technical indicator that is used in candlestick charting. The hammer appears when a stock tumbles during the day, but then finds strength at some point in the session to close near or above its opening price. This forms a candlestick that resembles a hammer, and it can suggest that the market has found a low point in the stock, and that better days are ahead.

Other Factors

Plus, earnings estimates have been rising for this company, even despite the sluggish trading lately. In just the past 60 days alone 1 estimate has gone higher, compared to none lower, while the consensus estimate has also moved in the right direction.

Estimates have actually risen so much that the stock now has a Zacks Rank #2 (Buy) suggesting this relatively unloved stock could be due for a breakout soon. This will be especially true if CSWI stock can build momentum from here and find a way to continue higher of off this encouraging trading development. You can see the complete list of today’s Zacks #1 Rank (Strong Buy) stocks here.

Infrastructure Stock Boom to Sweep America

A massive push to rebuild the crumbling U.S. infrastructure will soon be underway. It’s bipartisan, urgent, and inevitable. Trillions will be spent. Fortunes will be made.

The only question is “Will you get into the right stocks early when their growth potential is greatest?”

Zacks has released a Special Report to help you do just that, and today it’s free. Discover 7 special companies that look to gain the most from construction and repair to roads, bridges, and buildings, plus cargo hauling and energy transformation on an almost unimaginable scale.

Download FREE: How to Profit from Trillions on Spending for Infrastructure >>

Want the latest recommendations from Zacks Investment Research? Today, you can download 7 Best Stocks for the Next 30 Days. Click to get this free report
 
CSW Industrials, Inc. (CSWI): Free Stock Analysis Report
 
To read this article on Zacks.com click here.
 
Zacks Investment Research

https://www.entrepreneur.com/article/386977


Astronics Corporation (ATRO) Soars 8.3%: Is Further Upside Left in the Stock?

You’re reading Entrepreneur United States, an international franchise of Entrepreneur Media. This story originally appeared on Zacks

Astronics Corporation (ATRO) shares soared 8.3% in the last trading session to close at $13.66. The move was backed by solid volume with far more shares changing hands than in a normal session. This compares to the stock’s 4% loss over the past four weeks.

– Zacks

The recent uptick in Astronics’ share price can be attributed to its latest upgrade reportedly made by Richard Ryan, an analyst at Colliers Securities, from Neutral to Buy with a price target of $19. Per a few reports, over the past quarter, there has been active corporate inside buying at Astronics, which in turn might have led Richard Ryan to upgrade the company’s rating, thereby leading to an upside in its share price.

This company is expected to post quarterly loss of $0.15 per share in its upcoming report, which represents a year-over-year change of +11.8%. Revenues are expected to be $116.52 million, up 9.4% from the year-ago quarter.

Earnings and revenue growth expectations certainly give a good sense of the potential strength in a stock, but empirical research shows that trends in earnings estimate revisions are strongly correlated with near-term stock price movements.

For Astronics Corporation, the consensus EPS estimate for the quarter has remained unchanged over the last 30 days. And a stock’s price usually doesn’t keep moving higher in the absence of any trend in earnings estimate revisions. So, make sure to keep an eye on ATRO going forward to see if this recent jump can turn into more strength down the road.

The stock currently carries a Zacks Rank 3 (Hold). You can see the complete list of today’s Zacks Rank #1 (Strong Buy) stocks here >>>>

5 Stocks Set to Double

Each was handpicked by a Zacks expert as the #1 favorite stock to gain +100% or more in 2021. Previous recommendations have soared +143.0%, +175.9%, +498.3% and +673.0%.

Most of the stocks in this report are flying under Wall Street radar, which provides a great opportunity to get in on the ground floor.

Today, See These 5 Potential Home Runs >>

Want the latest recommendations from Zacks Investment Research? Today, you can download 7 Best Stocks for the Next 30 Days. Click to get this free report
 
Astronics Corporation (ATRO): Free Stock Analysis Report
 
To read this article on Zacks.com click here.
 
Zacks Investment Research

https://www.entrepreneur.com/article/386688


Will ETFs Gain as US Consumer Sentiment Improves in September?

You’re reading Entrepreneur United States, an international franchise of Entrepreneur Media. This story originally appeared on Zacks

The U.S. consumer sentiment has marginally improved amid rising concerns about surging coronavirus cases and inflationary levels. The University of Michigan’s preliminary consumer sentiment inched up to 71 in September from 70.3 last month. The metric, however, lagged market’s forecast of 72, per a Bloomberg survey of economists.

– Zacks

The measure of current economic conditions slipped to 77.1 in September from August’s 78.5. Meanwhile, a gauge of consumer expectations edged up to 67.1 in September from 65.1 in the previous month.

Moving on, one-year inflation expectation increased to 4.7% (the highest since 2008) in September from 4.6% in August. Meanwhile, the survey’s five-year inflation outlook remained steady at 2.9% in September.

In this regard, Surveys of Consumers chief economist Richard Curtin, said that “The steep August falloff in consumer sentiment ended in early September, but the small gain still meant that consumers expected the least favorable economic prospects in more than a decade,” (per a Reuters article).

Notably, consumers seem to be disturbed about the rising prices of homes, vehicles and household durables. In fact, the buying attitude for vehicles and homes is contracting.

Current U.S. Economic Scenario

Investors have their eyes on the minutes from the Fed’s two-day policy meeting that will begin on Sep 21. Fears surrounding the rising inflationary levels have aggravated as the producer price index witnessed the largest annual surge since November 2010 (per a CNBC article). The metric rose 0.7% in August and 8.3% year over year. It is being speculated that rising inflation levels may build more pressure on the Fed to tighten monetary policies.

Several economic data releases are also weighing on investors’ minds. The U.S. economy added only 235,000 jobs in August 2021 (the lowest in seven months). The metric lagged the forecast of 750,000 as a surge in COVID-19 infections kept companies from hiring and workers from actively looking for a job. Consumer confidence in the United States slipped to a six-month low in August.

The latest update on U.S. industrial output looks disappointing as the damages from Hurricane Ida and the ongoing health crisis took a toll on the metric. The consistent crunch in raw material supplies and labor as a result of the pandemic has been a serious concern. Per the Fed’s recently-released data, total industrial production rose 0.4% in August versus an increase of 0.8% in July.

There are still certain positive developments that can help stimulate a market rally. President Joe Biden has outlined a very effective plan to increase the vaccination rate and control the outbreak. He has made it mandatory for federal employees to get the COVID-19 vaccination, per a CNBC article. The Biden government will also issue guidelines to the Labor Department for imposing vaccine mandates for employers with more than 100 employees or run weekly tests.

The latest retail sales data has pleasantly surprised investors. The metric rose 0.7% sequentially in August 2021, comparing favorably with market expectations of a 0.8% decline, per a CNBC article.

The latest ISM Manufacturing Purchasing Managers’ Index (PMI) data for the United States is painting a rosy picture for the industrial sector. The metric rose to 59.9 in August  from 59.5 in July and surpassed forecasts of 58.6, per a Reuters article. Any reading above 50% indicates expansion in U.S. manufacturing activities. Notably, the manufacturing sector, which makes up 11.9% of the U.S. economy, saw the reading expanding for the 15th consecutive month.

ETFs That Might Gain

The nominal improvement in consumer sentiment might support the consumer discretionary sector, which attracts a major portion of consumer spending amid rising inflation levels. Here we have highlighted the four most popular funds that target the broader consumer discretionary sector (see all Consumer Discretionary ETFs):

The Consumer Discretionary Select Sector SPDR Fund XLY

This is the largest and most popular product in the consumer discretionary space, with AUM of $19.94 billion. It tracks the Consumer Discretionary Select Sector Index. The fund charges 12 basis points (bps) in fees per year and carries a Zacks ETF Rank #2 (Buy), with a Medium-risk outlook (read: ETF Areas to Gain From the Upcoming Holiday Shopping Season).

Vanguard Consumer Discretionary ETF VCR

This fund currently follows the MSCI US Investable Market Consumer Discretionary 25/50 Index. VCR charges investors 10 bps in annual fees. The product has managed $6.70 billion in its asset base and carries a Zacks ETF Rank #1 (Strong Buy), with a Medium-risk outlook (read: Will ETFs Gain on Starbucks’ Q3 Earnings Beat Amid Pandemic?).

First Trust Consumer Discretionary AlphaDEX Fund FXD

This fund tracks the StrataQuant Consumer Discretionary Index, which employs the AlphaDEX stock-selection methodology to select stocks from the Russell 1000 Index. FXD has AUM of $1.99 billion. It charges 63 bps in annual fees and has a Zacks ETF Rank #3 (Hold), with a Medium-risk outlook.

Fidelity MSCI Consumer Discretionary Index ETF FDIS

This fund tracks the MSCI USA IMI Consumer Discretionary Index. The product has amassed $1.62 billion in its asset base. It charges 8 bps in annual fees from investors and carries a Zacks ETF Rank #2, with a Medium-risk outlook (read: ETFs to Rise on Full FDA Approval for Pfizer COVID-19 Vaccine).

Breakout Biotech Stocks with Triple-Digit Profit Potential

The biotech sector is projected to surge beyond $2.4 trillion by 2028 as scientists develop treatments for thousands of diseases. They’re also finding ways to edit the human genome to literally erase our vulnerability to these diseases.

Zacks has just released Century of Biology: 7 Biotech Stocks to Buy Right Now to help investors profit from 7 stocks poised for outperformance. Recommendations from previous editions of this report have produced gains of +205%, +258% and +477%. The stocks in this report could perform even better.

See these 7 breakthrough stocks now>>

Want the latest recommendations from Zacks Investment Research? Today, you can download 7 Best Stocks for the Next 30 Days. Click to get this free report
 
Consumer Discretionary Select Sector SPDR ETF (XLY): ETF Research Reports
 
Vanguard Consumer Discretionary ETF (VCR): ETF Research Reports
 
Fidelity MSCI Consumer Discretionary Index ETF (FDIS): ETF Research Reports
 
First Trust Consumer Discretionary AlphaDEX ETF (FXD): ETF Research Reports
 
To read this article on Zacks.com click here.
 
Zacks Investment Research

https://www.entrepreneur.com/article/386656