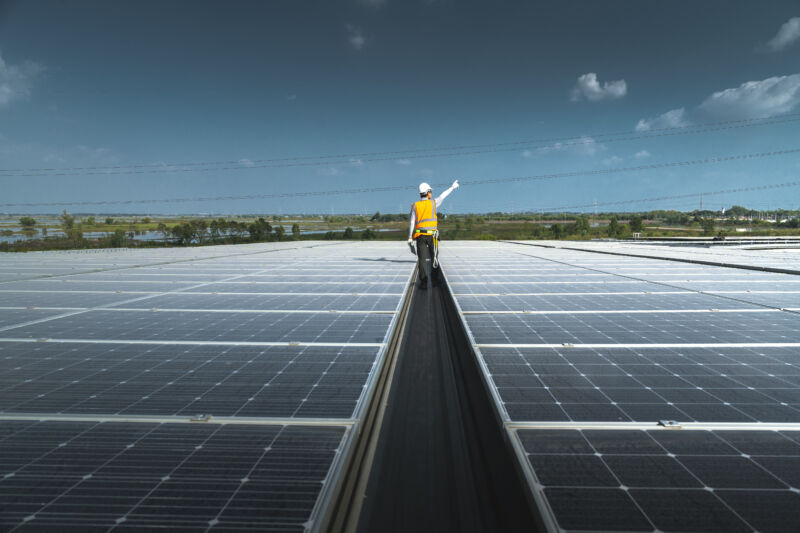
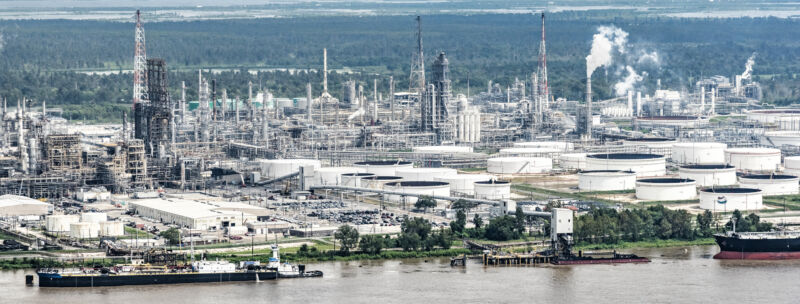
Climate damages by 2050 will be 6 times the cost of limiting warming to 2°

A worker walks between long rows of solar panels.

Almost from the start, arguments about mitigating climate change have included an element of cost-benefit analysis: Would it cost more to move the world off fossil fuels than it would to simply try to adapt to a changing world? A strong consensus has built that the answer to the question is a clear no, capped off by a Nobel in Economics given to one of the people whose work was key to building that consensus.

While most academics may have considered the argument put to rest, it has enjoyed an extended life in the political sphere. Large unknowns remain about both the costs and benefits, which depend in part on the remaining uncertainties in climate science and in part on the assumptions baked into economic models.

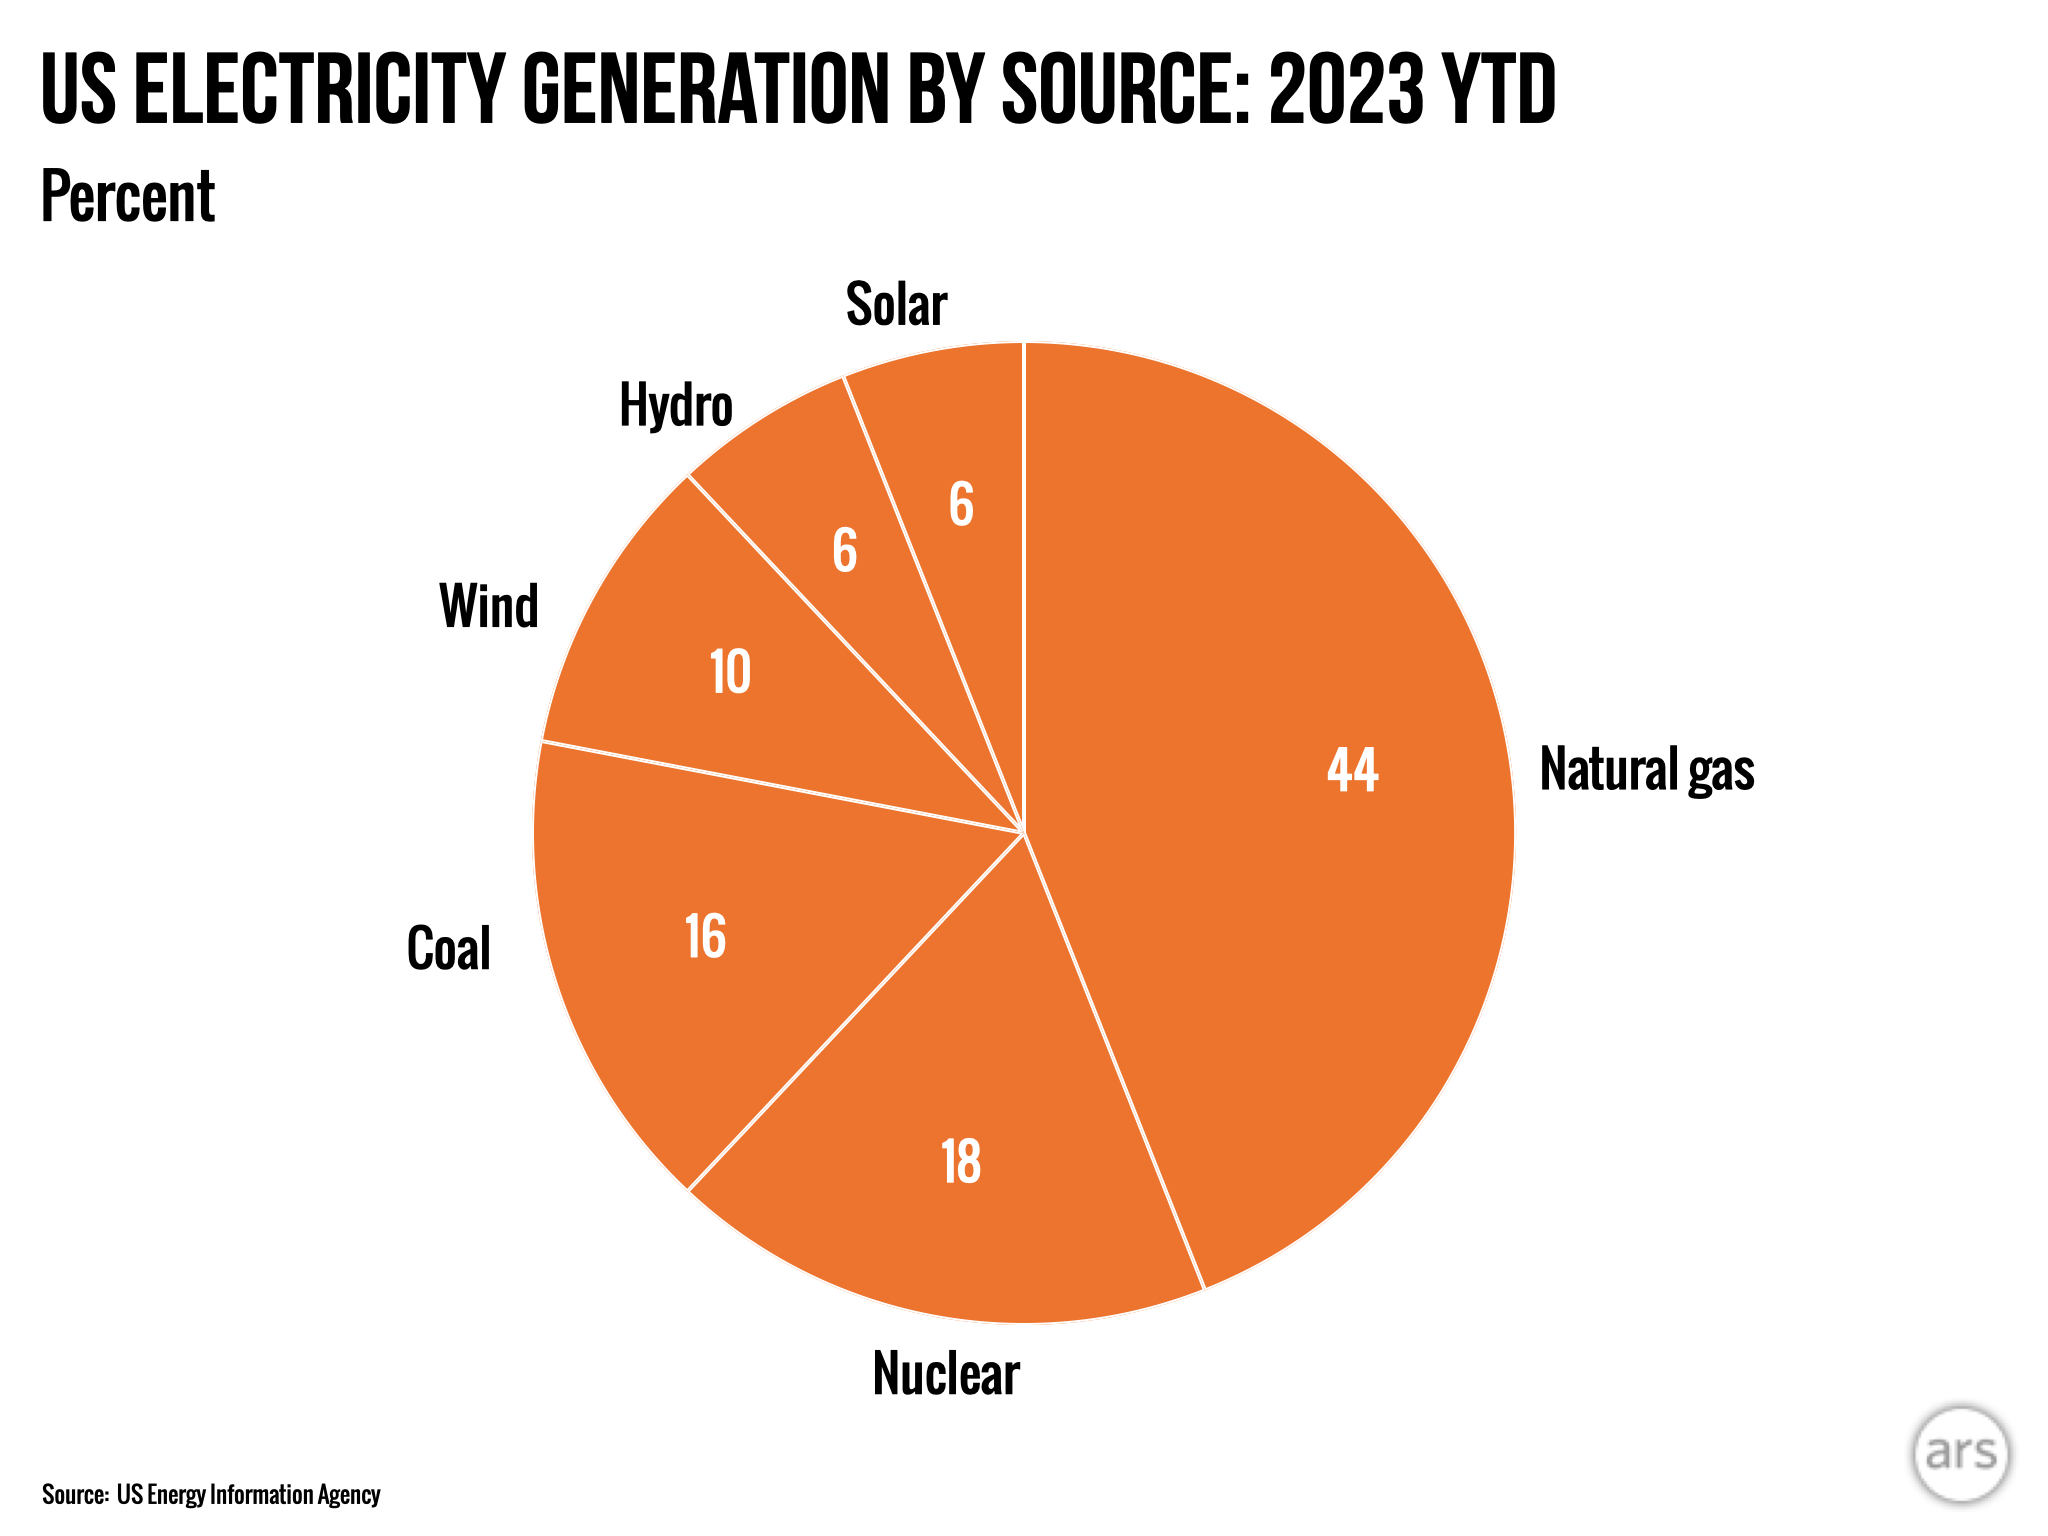
In Wednesday’s edition of Nature, a small team of researchers analyzed how local economies have responded to the last 40 years of warming and projected those effects forward to 2050. They find that we’re already committed to warming that will see the growth of the global economy undercut by 20 percent. That places the cost of even a limited period of climate change at roughly six times the estimated price of putting the world on a path to limit the warming to 2° C.

Linking economics and climate

Many economic studies of climate change involve assumptions about the value of spending today to avoid the costs of a warmer climate in the future, as well as the details of those costs. But the people behind the new work, Maximilian Kotz, Anders Levermann, and Leonie Wenz decided to take an empirical approach. They obtained data about the economic performance of over 1,600 individual regions around the globe, going back 40 years. They then attempted to look for connections between that performance and climate events.

Previous research already identified a number of climate measures—average temperatures, daily temperature variability, total annual precipitation, the annual number of wet days, and extreme daily rainfall—that have all been linked to economic impacts. Some of these effects, like extreme rainfall, are likely to have immediate effects. Others on this list, like temperature variability, are likely to have a gradual impact that is only felt over time.

The researchers tested each factor for lagging effects, meaning an economic impact sometime after their onset. These suggested that temperature factors could have a lagging impact up to eight years after they changed, while precipitation changes were typically felt within four years of climate-driven changes. While this relationship might be in error for some of the economic changes in some regions, the inclusion of so many regions and a long time period should help limit the impact of those spurious correlations.

With the climate/economic relationship worked out, the researchers obtained climate projections from the Coupled Model Intercomparison Project (CMIP) project. With that in hand, they could look at future climates and estimate their economic costs.

Obviously, there are limits to how far into the future this process will work. The uncertainties of the climate models grow with time; the future economy starts looking a lot less like the present, and things like temperature extremes start to reach levels where past economic behavior no longer applies.

To deal with that, Kotz, Levermann, and Wenz performed a random sampling to determine the uncertainty in the system they developed. They look for the point where the uncertainties from the two most extreme emissions scenarios overlap. That occurs in 2049; after that, we can’t expect the past economic impacts of climate to apply.

Kotz, Levermann, and Wenz suggest that this is an indication of warming we’re already committed to, in part because the effect of past emissions hasn’t been felt in its entirety and partly because the global economy is a boat that turns slowly, so it will take time to implement significant changes in emissions. “Such a focus on the near term limits the large uncertainties about diverging future emission trajectories, the resulting long-term climate response and the validity of applying historically observed climate–economic relations over long timescales during which socio-technical conditions may change considerably,” they argue.

https://arstechnica.com/?p=2018002


EPA seeks to cut “Cancer Alley” pollutants

Image of a large industrial facility on the side of a river.
Enlarge / An oil refinery in Louisiana. Facilities such as this have led to a proliferation of petrochemical plants in the area.

On Tuesday, the US Environmental Protection Agency announced new rules that are intended to cut emissions of two chemicals that have been linked to elevated incidence of cancer: ethylene oxide and chloroprene. While production and use of these chemicals takes place in a variety of locations, they’re particularly associated with an area of petrochemical production in Louisiana that has become known as “Cancer Alley.”

The new regulations would require chemical manufacturers to monitor the emissions at their facilities and take steps to repair any problems that result in elevated emissions. Despite extensive evidence linking these chemicals to elevated risk of cancer, industry groups are signaling their opposition to these regulations, and the EPA has seen two previous attempts at regulation set aside by courts.

Dangerous stuff

The two chemicals at issue are primarily used as intermediates in the manufacture of common products. Chloroprene, for example, is used for the production of neoprene, a synthetic rubber-like substance that’s probably familiar from products like insulated sleeves and wetsuits. It’s a four-carbon chain with two double-bonds that allow for polymerization and an attached chlorine that alters its chemical properties.

According to the National Cancer Institute (NCI), chloroprene “is a mutagen and carcinogen in animals and is reasonably anticipated to be a human carcinogen.” Given that cancers are driven by DNA damage, any mutagen would be “reasonably anticipated” to drive the development of cancer. Beyond that, it appears to be pretty nasty stuff, with the NCI noting that “exposure to this substance causes damage to the skin, lungs, CNS, kidneys, liver and depression of the immune system.”

The NCI’s take on Ethylene Oxide is even more definitive, with the Institute placing it on its list of cancer-causing substances. The chemical is very simple, with two carbons that are linked to each other directly, and also linked via an oxygen atom, which makes the molecule look a bit like a triangle. This configuration allows the molecule to participate in a broad range of reactions that break one of the oxygen bonds, making it useful in the production of a huge range of chemicals. Its reactivity also makes it useful for sterilizing items such as medical equipment.

Its sterilization function works through causing damage to DNA, which again makes it prone to causing cancers.

In addition to these two chemicals, the EPA’s new regulations will target a number of additional airborne pollutants, including benzene, 1,3-butadiene, ethylene dichloride, and vinyl chloride, all of which have similar entries at the NCI.

Despite the extensive record linking these chemicals to cancer, The New York Times quotes the US Chamber of Commerce, a pro-industry group, as saying that “EPA should not move forward with this rule-making based on the current record because there remains significant scientific uncertainty.”

A history of exposure

The petrochemical industry is the main source of these chemicals, so their release is associated with areas where the oil and gas industry has a major presence; the EPA notes that the regulations will target sources in Delaware, New Jersey, and the Ohio River Valley. But the primary focus will be on chemical plants in Texas and Louisiana. These include the area that has picked up the moniker Cancer Alley due to a high incidence of the disease in a stretch along the Mississippi River with a large concentration of chemical plants.

As is the case with many examples of chemical pollution, the residents of Cancer Alley are largely poor and belong to minority groups. As a result, the EPA had initially attempted to regulate the emissions under a civil rights provision of the Clean Air Act, but that has been bogged down due to lawsuits.

The new regulations simply set limits on permissible levels of release at what’s termed the “fencelines” of the facilities where these chemicals are made, used, or handled. If levels exceed an annual limit, the owners and operators “must find the source of the pollution and make repairs.” This gets rid of previous exemptions for equipment startup, shutdown, and malfunctions; those exemptions had been held to violate the Clean Air Act in a separate lawsuit.

The EPA estimates that the sites subject to regulation will see their collective emissions of these chemicals drop by nearly 80 percent, which works out to be 54 tons of ethylene oxide, 14 tons of chloroprene, and over 6,000 tons of the other pollutants. That in turn will reduce the cancer risk from these toxins by 96 percent among those subjected to elevated exposures. Collectively, the chemicals subject to these regulations also contribute to smog, so these reductions will have an additional health impact by reducing its levels as well.

While the EPA says that “these emission reductions will yield significant reductions in lifetime cancer risk attributable to these air pollutants,” it was unable to come up with an estimate of the financial benefits that will result from that reduction. By contrast, it estimates that the cost of compliance will end up being approximately $150 million annually. “Most of the facilities covered by the final rule are owned by large corporations,” the EPA notes. “The cost of implementing the final rule is less than one percent of their annual national sales.”

This sort of cost-benefit analysis is a required step during the formulation of Clean Air Act regulations, so it’s worth taking a step back and considering what’s at stake here: the EPA is basically saying that companies that work with significant amounts of carcinogens need to take stronger steps to make sure that they don’t use the air people breathe as a dumping ground for them.

Unsurprisingly, The New York Times quotes a neoprene manufacturer that the EPA is currently suing over its chloroprene emissions as claiming the new regulations are “draconian.”

https://arstechnica.com/?p=2015882


Can we drill for hydrogen? New find suggests additional geological source.

Image of apartment buildings with mine tailings behind them, and green hills behind those.
Enlarge / Mining operations start right at the edge of Bulqizë, Albania.

“The search for geologic hydrogen today is where the search for oil was back in the 19th century—we’re just starting to understand how this works,” said Frédéric-Victor Donzé, a geologist at Université Grenoble Alpes. Donzé is part of a team of geoscientists studying a site at Bulqizë in Albania where miners at one of the world’s largest chromite mines may have accidentally drilled into a hydrogen reservoir.

The question Donzé and his team want to tackle is whether hydrogen has a parallel geological system with huge subsurface reservoirs that could be extracted the way we extract oil. “Bulqizë is a reference case. For the first time, we have real data. We have a proof,” Donzé said.

Greenish energy source

Water is the only byproduct of burning hydrogen, which makes it a potential go-to green energy source. The problem is that the vast majority of the 96 million tons of hydrogen we make each year comes from processing methane, and that does release greenhouse gases. Lots of them. “There are green ways to produce hydrogen, but the cost of processing methane is lower. This is why we are looking for alternatives,” Donzé said.

And the key to one of those alternatives may be buried in the Bulqizë mine. Chromite, an ore that contains lots of chromium, has been mined at Bulqizë since the 1980s. The mining operation was going smoothly until 2007, when the miners drilled through a fault, a discontinuity in the rocks. “Then they started to have explosions. In the mine, they had a small electric train, and there were sparks flying, and then… boom,” Donzé said. At first, Bulqizë management thought the cause was methane, the usual culprit of mining accidents. But it wasn’t.

Hydrogen at fault

The mine was bought by a Chinese company in 2017, and the new owners immediately sent their engineering teams to deal with explosions. They did measurements and found the hydrogen concentration in the mine’s galleries was around 1–2 percent. It only needs to be at 0.4–0.5 percent for the atmosphere to become explosive. “They also found the hydrogen was coming from the fault drilled through back in 2007. Unfortunately, one of the explosions happened when the engineering team was down there. Three or four people died,” Donzé said.

It turned out that over 200 tons of hydrogen was released from the Bulqizë mine each year. Donzé’s team went there to figure out where all this hydrogen was coming from.

The rocks did not contain enough hydrogen to reach that sort of flow rate. One possible explanation is the hydrogen being released as a product of an ongoing geological process called serpentinization. “But for this to happen, the temperature in the mine would need to reach 200–300 degrees Celsius, and even then, it would not produce 200 tons per year,” said Donzé. “So the most probable was the third option—that we have a reservoir,” he added.

“Probable,” of course, is far from certain.

https://arstechnica.com/?p=2005627


Google, Environmental Defense Fund will track methane emissions from space

computer-generated image of a satellite highlighting emissions over a small square on the globe.
Enlarge / With color, high resolution.
Google/EDF

When discussing climate change, attention generally focuses on our soaring carbon dioxide emissions. But levels of methane have risen just as dramatically, and it’s a far more potent greenhouse gas. And, unlike carbon dioxide, it’s not the end result of a valuable process; methane largely ends up in the atmosphere as the result of waste, lost during extraction and distribution.

Getting these losses under control would be one of the easiest ways to slow down greenhouse warming. But tracking methane emissions often comes from lots of smaller, individual sources. To help get a handle on all the leaks, the Environmental Defense Fund has been working to put its own methane-monitoring satellite in orbit. On Wednesday, it announced that it was partnering with Google to take the data from the satellite, make it publicly available, and tie it to specific sources.

The case for MethaneSAT

Over the course of 20 years, methane is 84 times more potent than carbon dioxide when it comes to greenhouse warming. And most methane in the atmosphere ultimately reacts with oxygen, producing water vapor and carbon dioxide—both of which are also greenhouse gasses. Those numbers are offset by the fact that methane levels in the atmosphere are very low, currently just under two parts per million (versus over 400 ppm for CO2). Still, levels have gone up considerably since monitoring started.

The primary source of the excess methane is the extraction and distribution of natural gas. In the US, the EPA has developed rules meant to force companies with natural gas infrastructure to find and fix leaks. (Unsurprisingly, Texas plans to sue to block this rule.) But finding leaks has turned out to be a challenge. The US has been using industry-wide estimates that turned out to be much lower than numbers based on monitoring a subset of facilities.

Globally, that sort of detailed surveying simply isn’t possible, and we don’t have the type of satellite-based instruments we need to focus on methane emissions. A researcher behind one global survey said, “We were quite disappointed because we discovered that the sensitivity of our system was pretty low.” (The survey did identify sites that were “ultra emitters” despite the sensitivity issues.)

To help identify the major sources of methane release, the Environmental Defense Fund, a US-based NGO, has spun off a project called MethaneSAT that will monitor the emissions from space. The project is backed by large philanthropic donations and has partnered with the New Zealand Space Agency. The Rocket Lab launch company will build the satellite control center in New Zealand, while SpaceX will carry the 350 kg satellite to orbit in a shared launch, expected in early March.

Once in orbit, the hardware will use methane’s ability to absorb in the infrared—the same property that causes all the problems—to track emissions globally at a resolution down below a square kilometer.

Handling the data

That will generate large volumes of data that countries may struggle to interpret. That’s where the new Google partnership will come in. Google will use the same AI capability it has developed to map features such as roads and sidewalks on satellite images but repurpose it to identify oil and gas infrastructure. Both the MethaneSAT’s emissions data and infrastructure details will be combined and made available via the company’s Google Earth service.

Top image: A view of an area undergoing oil/gas extraction. Left: a close-up of an individual drilling site. Right: Computer-generated color coding of the hardware present at the site.
Google / EDF

The project builds off work Google has done previously by placing methane monitoring hardware on Street View photography vehicles, also in collaboration with the Environmental Defense Fund.

In a press briefing, Google’s Yael Maguire said that the challenge is keeping things up to date, as infrastructure in the oil and gas industry can change fairly rapidly. While he didn’t use it as an example, one illustration of that challenge was the rapid development of liquified natural gas import infrastructure in Europe in the wake of Russia’s invasion of Ukraine.

The key question, however, is one of who’s going to use this information. Extraction companies could use it to identify the sites of leaks and fix them but are unlikely to do that in the absence of a regulatory requirement. Governments could rely on this information to take regulatory actions but will probably want some sort of independent vetting of the data before doing so. At the moment, all EDF is saying is that it’s engaging in discussions with several parties about potentially using the data.

One clear user will be the academic community, which is already using less-targeted satellite data to explore the issue of methane emissions.

Regardless, as everyone involved in the project emphasizes, getting methane under control is probably the easiest and quickest way to eliminate a bit of impending warming. And that could help countries meet emissions targets without immediately starting on some of the slower and more expensive options. So, even if no one has currently committed to using this data, they may ultimately come around—because using it to do something is better than doing nothing.

https://arstechnica.com/?p=2003398


40% of US electricity is now emissions-free

Image of electric power lines with a power plant cooling tower in the background.

Just before the holiday break, the US Energy Information Agency released data on the country’s electrical generation. Because of delays in reporting, the monthly data runs through October, so it doesn’t provide a complete picture of the changes we’ve seen in 2023. But some of the trends now seem locked in for the year: wind and solar are likely to be in a dead heat with coal, and all carbon-emissions-free sources combined will account for roughly 40 percent of US electricity production.

Tracking trends

Having data through October necessarily provides an incomplete picture of 2023. There are several factors that can cause the later months of the year to differ from the earlier ones. Some forms of generation are seasonal—notably solar, which has its highest production over the summer months. Weather can also play a role, as unusually high demand for heating in the winter months could potentially require that older fossil fuel plants be brought online. It also influences production from hydroelectric plants, creating lots of year-to-year variation.

Finally, everything’s taking place against a backdrop of booming construction of solar and natural gas. So, it’s entirely possible that we will have built enough new solar over the course of the year to offset the seasonal decline at the end of the year.

Let’s look at the year-to-date data to get a sense of the trends and where things stand. We’ll then check the monthly data for October to see if any of those trends show indications of reversing.

The most important takeaway is that energy use is largely flat. Overall electricity production year-to-date is down by just over one percent from 2022, though demand was higher this October compared to last year. This is in keeping with a general trend of flat-to-declining electricity use as greater efficiency is offsetting factors like population growth and expanding electrification.

That’s important because it means that any newly added capacity will displace the use of existing facilities. And, at the moment, that displacement is happening to coal.

Can’t hide the decline

At this point last year, coal had produced nearly 20 percent of the electricity in the US. This year, it’s down to 16.2 percent, and only accounts for 15.5 percent of October’s production. Wind and solar combined are presently at 16 percent of year-to-date production, meaning they’re likely to be in a dead heat with coal this year and easily surpass it next year.

Year-to-date, wind is largely unchanged since 2022, accounting for about 10 percent of total generation, and it’s up to over 11 percent in the October data, so that’s unlikely to change much by the end of the year. Solar has seen a significant change, going from five to six percent of the total electricity production (this figure includes both utility-scale generation and the EIA’s estimate of residential production). And it’s largely unchanged in October alone, suggesting that new construction is offsetting some of the seasonal decline.

Coal is being squeezed out by natural gas, with an assist from renewables.
Enlarge / Coal is being squeezed out by natural gas, with an assist from renewables.
Eric Bangeman/Ars Technica

Hydroelectric production has dropped by about six percent since last year, causing it to slip from 6.1 percent to 5.8 percent of the total production. Depending on the next couple of months, that may allow solar to pass hydro on the list of renewables.

Combined, the three major renewables account for about 22 percent of year-to-date electricity generation, up about 0.5 percent since last year. They’re up by even more in the October data, placing them well ahead of both nuclear and coal.

Nuclear itself is largely unchanged, allowing it to pass coal thanks to the latter’s decline. Its output has been boosted by a new, 1.1 Gigawatt reactor that come online this year (a second at the same site, Vogtle in Georgia, is set to start commercial production at any moment). But that’s likely to be the end of new nuclear capacity for this decade; the challenge will be keeping existing plants open despite their age and high costs.

If we combine nuclear and renewables under the umbrella of carbon-free generation, then that’s up by nearly 1 percent since 2022 and is likely to surpass 40 percent for the first time.

The only thing that’s keeping carbon-free power from growing faster is natural gas, which is the fastest-growing source of generation at the moment, going from 40 percent of the year-to-date total in 2022 to 43.3 percent this year. (It’s actually slightly below that level in the October data.) The explosive growth of natural gas in the US has been a big environmental win, since it creates the least particulate pollution of all the fossil fuels, as well as the lowest carbon emissions per unit of electricity. But its use is going to need to start dropping soon if the US is to meet its climate goals, so it will be critical to see whether its growth flat lines over the next few years.

Outside of natural gas, however, all the trends in US generation are good, especially considering that the rise of renewable production would have seemed like an impossibility a decade ago. Unfortunately, the pace is currently too slow for the US to have a net-zero electric grid by the end of the decade.

https://arstechnica.com/?p=1992977


Government makes an app to cut down government’s role in solar permitting

Aerial view of houses with roof-top solar panels.
Enlarge / NREL has taken some of the hassle out of getting permits for projects like these.

Can government agencies develop software to help cut bureaucratic red tape through automation? The answer is “yes,” according to the promising results achieved by the National Renewable Energy Laboratory (NREL), which has saved thousands of hours of labor for local governments by creating a tool called SolarAPP+ (Solar Automated Permit Processing Plus) for residential solar permits.

“We estimate that automatic SolarAPP+ permitting saved around 9,900 hours of… staff time in 2022,” NREL staff wrote in the report, “SolarAPP+ Performance Review (2022 Data). “Based on median timelines, a typical SolarAPP+ project is permitted and inspected 13 business days sooner than traditional projects… SolarAPP+ has eliminated over 134,000 days in permitting-related delays.”

SolarAPP+ automates over 100 compliance checks in the permitting process that are usually the responsibility of city, county, or town employees, according to Jeff Cook, SolarAPP+ program lead at NREL and first author of the report. It can be more accurate, thorough, and efficient than a time-pressured local government employee would be.

Saving time and money

Sometimes, the cost of permitting can be higher than the cost of solar hardware, Cook said. It depends on the specifics of the project.

“We knew that residential rooftop solar volume was increasing across the country,” Cook said. “It took us… 20 years to get to a million PV installations. And I think we got to 2 million PV installations just a few years later. And so there’s a lot of solar volume out there. And the problem is that each one of those systems needs to be reviewed for code compliance. And so if you need a human to review that, you’ve got a million applications.”

“When regulations make it unnecessarily difficult for people to quickly install solar and storage systems, it hurts everyone,” said Senator Scott Wiener (D-Calif.) in a press statement. “It hurts those who want to install solar. And it hurts communities across California, which are being negatively impacted by climate change. We need to make it easier for people to use renewable energy—that’s just a no-brainer. Expediting solar permitting is something we can do to make this a reality.”

A coalition of stakeholders from the solar industry, the US Department of Energy, and the building code-development community requested that NREL develop the software, Cook said. The organizations represented included UL Solutions and the Interstate Renewable Energy Council. (UL Solutions is a company that addresses a broad range of safety issues; initially, it focused on fire and electrical safety.)

“What we identified is the community need for the software and we identified that there was a gap in the private sector,” Cook said. “There was no incentive to do it from any active members of the private sector, but a real potential opportunity or value to the public good if such a software existed and was publicly available and free for a local government to adopt.”

Cook estimates that hundreds of thousands of hours in plan review time would have been required to manually approve all of the residential solar permits in the United States in recent years. Approving a permit for a residential solar project can take local government staff 15 minutes to an hour, and around 30 percent of the applications are later revised.

A flood of applications

“It just inundates the staff with work that they have to do,” Cook said.

“We are seeing about 750 residential requests over the past 12 months, which is about double the number of applications we saw two years ago,” said Kate Gallego, mayor of Phoenix, at the SolarAPP+ Industry Roundtable. “When I ask people in industry what we can do to speed up deployment of solar, they ask, ‘Can you do permitting faster?’ We’re at about 30 days now. We want to get that permitted as fast as possible, but we don’t want to sacrifice safety, and we want to make sure we’re not just doing it quickly, but well. That’s why this partnership was very attractive to me.”

Up to five separate departments may review the permits—the ones that oversee structural, electrical, fire, planning, and zoning decisions, Cook said.

“There’s usually a queue,” Cook said. “Just because it takes the jurisdiction only 15 minutes to review doesn’t mean that you send it to them today—they review it an hour later and get back to you. The average is, across the country, a seven-day turnaround, but it can be 30 days plus. It really varies across the country depending on how much volume of solar is in that space.”

https://arstechnica.com/?p=1992559


A locally grown solution for period poverty

Image of rows of succulents with long spiky leaves and large flower stalks.
Enlarge / Sisal is an invasive species that is also grown agriculturally.

Women and girls across much of the developing world lack access to menstrual products. This means that for at least a week or so every month, many girls don’t go to school, so they fall behind educationally and often never catch up economically. 

Many conventional menstrual products have traditionally been made of hydrogels made from toxic petrochemicals, so there has been a push to make them out of biomaterials. But this usually means cellulose from wood, which is in high demand for other purposes and isn’t readily available in many parts of the globe. So Alex Odundo found a way to solve both of these problems: making maxi pads out of sisal, a drought-tolerant agave plant that grows readily in semi-arid climates like his native Kenya.

Putting an invasive species to work

Sisal is an invasive plant in rural Kenya, where it is often planted as livestock fencing and feedstock. It doesn’t require fertilizer, and its leaves can be harvested all year long over a five- to seven-year span. Odundo and his partners in Manu Prakash’s lab at Stanford University developed a process to generate soft, absorbent material from the sisal leaves. It relies on treatment with dilute peroxyformic acid (1 percent) to increase its porosity, followed by washing in sodium hydroxide (4 percent) and then spinning in a tabletop blender to enhance porosity and make it softer. 

They tested their fibers with a mixture of water mixed with glycerol—to make it thicker, like blood—and found that it is as absorbent as the cotton used in commercially available maxi pads. It was also as absorbent as wood pulp and more absorbent than fibers prepared from other biomaterials, including hemp and flax. Moreover, their process is less energy-intensive than conventional processing procedures, which are typically performed at higher temperatures and pressures. 

In a cradle-to-gate carbon footprint life cycle analysis, including sisal cultivation, harvesting, manufacturing, and transportation, sisal cellulose microfiber production fared roughly the same as production of cellulose microfiber from wood and much better than that from cotton in terms of both carbon footprint and water consumption, possibly because cotton requires so much upstream fertilizer. Much of the footprint comes from transportation, highlighting how useful it can be to make products like this in the same communities that need them.

Science for the greater good

This is not Odundo’s first foray into utilizing sisal; at Olex Techno Enterprises in Kisumu, Kenya, he has been making machines to turn sisal leaves into rope for over 10 years. This benefits local farmers since sisal rope and even sisal fibers sell for ten times as much as sisal leaves. In addition to making maxi pads, Odundo also built a stove that burns sawdust, rice husks, and other biodegradable waste products. 

By reducing wood stoves, he is reducing deforestation and improving the health of the women who breathe in the smoke of the cookfires. Adoption of such stoves have been a goal of environmentalists for years, and although a number of prototypes have been developed by mostly male engineers in developed countries, they have not been widely used because they are not that practical or appealing to the mostly female cooks in developing countries—the people who actually need to cook with them, yet were not consulted in their design.

Manu Prakash’s lab’s website proclaims that “we are dedicated toward inventing and distributing ‘frugal science’ tools to democratize access to science.” Partnering with Alex Odundo to manufacture menstrual products in the low-income rural communities that most need them seems like the apotheosis of that goal.

Communications Engineering, 2023. DOI:  10.1038/s44172-023-00130-y

https://arstechnica.com/?p=1989671


Cold temperatures in Las Vegas were “most difficult,” says Pirelli

A set of used F1 tires in the pit lane in Las Vegas
Roberto Baldwin

LAS VEGAS—It was cold this past weekend at the first Las Vegas Formula 1 Grand Prix. Winters in the desert are notoriously chilly, and it didn’t help that the race organizers decided to start the spectacle at 10 pm local time.

The issue was the tires—they’re not developed to handle frigid weather. Teams were tracking air temperatures and formulating plans to keep their cars on the road instead of sliding into a wall. There was some relief the night of the race, as the weather was warmer than it was during Friday night’s qualifying session. At the start of the race (according to Weather Underground) it was roughly 60° F (15.5° C), and the actual lowest air temperature was still 10° F warmer than the historical average for November 18; turns out climate change is real and happening.

There’s nothing subtle about Formula 1. Big egos, big money, big tracks, and thanks to a certain Netflix show, big-time fan growth in the United States. But at its core, the actual cars themselves, relatively speaking, don’t have that big of an impact on the environment. Sure, they’re loud V6 engines, and the tires get depleted quicker than a pizza at a children’s birthday party; but transporting the cars and pit equipment and tires and team members to each race uses far more energy than the race itself. And of course, if you factor in fans flying in from all over the world for the 23 races per year, you get a larger carbon footprint than, say, your kid’s soccer game.

But that footprint is eclipsed by a season of NFL or NCAA football matches (where annual attendance dwarfs F1, and most of those fans drive to the games), and baseball games seem to happen every five minutes during baseball season. (It’s actually 162 regular season games a year for 30 teams which means, 2,430 games a year. That’s 32,805 hours of baseball based on the average length of a game lasting 162 minutes. The regular season is 185 days long, which equals 4,440 hours. So there’s more baseball than time.)

Still, F1 and its tire supplier, Pirelli, realize they don’t exist in a vacuum, and ignoring things like climate change won’t make it go away—and frankly, every little bit helps. On the powertrain side, in 2026 the hybrid motors in the F1 cars will be more powerful. More energy from electricity versus gasoline is always a good move, and the actual petrol is also being changed up. The goal is synthetic carbon-neutral fuel by 2027. A commendable plan, but like with all things that require a huge change, it’s not without its issues.

Use fewer tires

Then there are the tires. Mario Isola, head of Pirelli F1, told Ars Technica, “During our 13 years, we’ve had many new races. I have to say that Las Vegas is one of the most difficult because the weather expected was colder. Our tires are not designed to work in very cold conditions,” Isola said.

Just ask Lando Norris about this—the low temperature was a factor in causing his McLaren to bottom out on a bump on the track, which sent him violently into a crash barrier and then to a hospital for precautionary checks.

Yet Pirelli is well aware of the climate crisis and is working to reduce its impact on the world. Currently the used race tires are returned to the UK and used as fuel. Pirelli is now working to reuse these tires by breaking them down into plastic that can be used for flooring. There are also schemes to recycle the tires to create new raw materials to be used in other new tires, so the rubber you see racing on track one weekend might end up on the wheels of another vehicle months later.

This is at the same time that Pirelli is having to develop new tires for the smaller, lighter, and more powerful cars due in 2026. The company has already started down the path of sustainability and announced that next year its tires will be FSC-certified (Forest Stewardship Council).

Isola also noted that Pirelli wants to reduce the number of tires that are used on race weekend. This year it’s piloting a system where it supplies 11 sets of slicks instead of 13. It’s a 20 percent reduction in tires, and it means transporting fewer tires around the world. Pirelli hopes to make this the standard for the future.

Pirelli is also working to remove the heating blankets from wet and intermediate tires. Doing that reduces electricity usage and would mean fewer items to ship around the world. All of these plans individually seem like small potatoes, but like the transition to a more sustainable future, it’s the little things that add up to a larger impact on how we affect the world.

https://arstechnica.com/?p=1986065


Radical new forecast shows how rapidly the energy economy is changing

Wind turbines stand above a large field of solar panels in a view backlit by a rising Sun.

Humanity is on the cusp of radical changes in how we produce and consume energy, according to a new evaluation by the International Energy Agency. And that leaves us in a place where small changes can produce huge differences in the energy economy by the end of the decade—even a slight drop in China’s economic growth, for example, could cut coal use by an amount similar to what Europe currently consumes.

Amidst the flux, governments are struggling to set policies that either meet our needs or reflect the changing reality. By 2030, the IEA expects that we’ll have the capacity to manufacture more than double the solar panels needed to meet current policy goals. And those goals will leave us falling well short of keeping warming below 2° C.

In flux

The IEA’s analysis focuses on two different scenarios. One of them, which it terms STEPS, limits the analysis to the policies that governments have already committed to. Those are sufficient to have energy-driven emissions peak in the middle of this decade—meaning within the next few years. But they stay above net zero for long enough to commit us to 2.4° C warming, a level that climate scientists indicate will lead to severe consequences.

A second scenario, NZE, has the world reaching net-zero emissions by the middle of the century, which is a necessary step for limiting warming to 2° C or below. Obviously, that will require policy changes beyond those currently in force.

How sensitive are these analyses to policy changes? The report highlights how its 2021 version, completed before the passage of the US’s Inflation Reduction Act, had predicted 12 percent of the cars sold in the US would be electric by 2030. The passage of the IRA now has that figure rising to 50 percent. Globally, we may reach similar levels based on current trends. Only 4 percent of cars sold were electric in 2020, but that figure has shot up to 25 percent this year.

But it’s not just policy changes that are altering the landscape. Lower prices for renewables, combined with expanding manufacturing capacity to meet expected demand, have also dramatically changed the IEA’s expectations. For example, its estimates of both solar and offshore wind in China have tripled in the two years since its 2021 World Energy Outlook.

During that same period (2020–2023), investments in renewable energy have risen by 40 percent. As a result, this year will see an average of a billion dollars invested in solar power every day, and a half-Terawatt of renewable capacity added overall. All of this change means that the IEA expects fossil fuel use (the combined coal, oil, and gas) to peak before the decade is over.

https://arstechnica.com/?p=1978691


Amazon Expands Eco-friendly Electric Vehicle Fleet

Opinions expressed by Entrepreneur contributors are their own.

This story originally appeared on Readwrite.com

On Tuesday, Amazon.com revealed that it currently operates 10,000 Rivian electric delivery vehicles across the United States and Europe. This information was disclosed during a recent business presentation. The company aims to have a total of 100,000 electric delivery vehicles on the road globally by 2030, making its fleet one of the largest and most eco-friendly in the world. This move aligns with Amazon’s commitment to reduce its carbon footprint and promoting sustainable practices in the e-commerce industry. The development comes from Amazon’s collaboration with electric vehicle (EV) maker Rivian, to incorporate at least 100,000 electric delivery vans into their fleet by 2030. As of July this year, Amazon reported deploying over 5,000 vehicles.

Amazon has committed to fight climate change and reduce its carbon footprint

This initiative aligns with Amazon’s commitment to fighting climate change and reducing its carbon footprint as part of its ambitious Climate Pledge. The transition to electric delivery vans showcases the company’s dedication to sustainability and highlights the electric vehicle market’s continued growth and potential. Rivian, also known for manufacturing the R1T pick-up trucks and R1S sport utility vehicles, raised its production target for the entire year of 2023 to 52,000 vehicles in August.

This ambitious increase in production aims to meet the growing demand for electric vehicles and further establish Rivian’s presence in the automotive market. As a result, the company is making significant investments in expanding its production facilities and workforce to support its long-term vision of sustainable transportation.

Related: Amazon Slashes Dozens of In-House Brands. Did Your Favorite Line Get Cut?

Amazon, which holds a stake in Rivian, has accomplished an impressive 260 million deliveries using the electric vans, according to a report from Reuters. The successful deployment of Rivian’s electric vans has demonstrated the possibilities for reducing the carbon footprint in the delivery sector and reinforced the e-commerce giant’s commitment to sustainability. As Amazon continues to innovate in environmentally friendly practices, further investment in electric vehicles is expected to play a crucial role in meeting the company’s ambitious goal to achieve net-zero carbon emissions by 2040.

Besides its partnership with Rivian, the Seattle-based retail behemoth is joining forces with Volvo to incorporate heavy-duty electric trucks into its middle-mile delivery fleet. These electric trucks will serve as a sustainable transportation option, reducing Amazon’s carbon footprint and aligning with the company’s commitment to be net zero carbon by 2040. The collaboration with Volvo signifies a significant shift in the logistics industry, as companies increasingly prioritize environmentally friendly solutions to meet growing customer demand and adhere to stricter emissions regulations.

https://www.entrepreneur.com/green-entrepreneur/amazon-expands-eco-friendly-electric-vehicle-fleet/463994