

When it comes to tools, we all have our favorites as SEO professionals. Ahrefs, Moz and Semrush aim to accomplish the same things at a high level, but you’d be hard-pressed to find an SEO professional who doesn’t have strong opinions on each tool’s ability to do so.
Any seasoned SEO practitioner knows opinions alone can get you roughly as far as asking Google’s John Mueller about domain authority (hint: not far).
Our SEO team recently put our opinions to the test and biases to the side to compare the keyword size of Google Search Console (GSC), Ahrefs, Semrush and Moz for the clients we manage.
While you can read more in the Methodology and Caveats and considerations sections below, the nod to this data not being definitive in the title is that it isn’t. The data was only pulled for 51 domains, all of which live in the pharmaceutical space. So, it’s a small, non-representative sample. You’ve been warned.
GSC had over 36% more keywords than the other sources combined
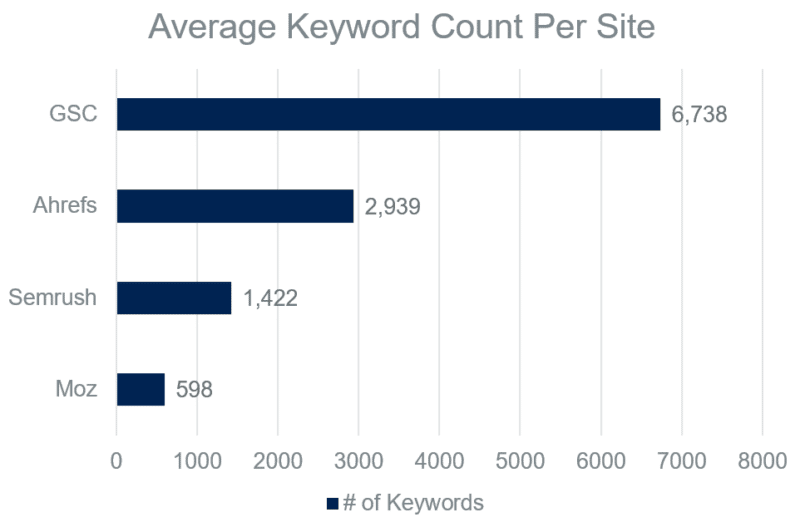
Patrick Stox from Ahrefs published a fantastic study about keywords hidden in Google Search Console. I encourage you to read it, but the gist is while the number varied greatly by site, almost half of the overall clicks were attributed to hidden terms.
Given that Google Search Console hides lower volume keywords, which make up the majority of search queries, this likely means significantly more than half of the keywords are obstructed to the end user.
But here’s the reality. GSC still might be the best we have when it comes to keyword visibility size.
Among the three, Ahrefs had the most keywords for 98% of websites
Relative keyword ranking size by domain
| Source | 1st | 2nd | 3rd |
| Ahrefs | 50 domains | 0 domains | 1 domain |
| Semrush | 0 domains | 50 domains | 1 domain |
| Moz | 1 domain | 1 domain | 49 domains |
In many ways, it’s unfair to compare Ahrefs, Semrush and Moz to Google Search Console. GSC’s metrics and intended use contrast quite a bit from the other three tools.
So, when removing GSC, we ranked the keyword size for each of the 51 sites in our data warehouse. I’ll be honest; I was shocked at the consistency in the results.
Ahrefs nearly had a clean sweep of first-place finishes, with Semrush and Moz continually coming in second and third.
On average, Ahrefs had twice the ranking keywords as Semrush, which had over twice as many as Moz. Ahrefs had nearly five times the amount of ranking keywords for our clients as Moz. That’s an incredible disparity!
You might be wondering, if Ahrefs has such a dominant lead on Semrush and Moz, why not just use Ahrefs?
As strong as Ahrefs was, it missed 87% of keywords
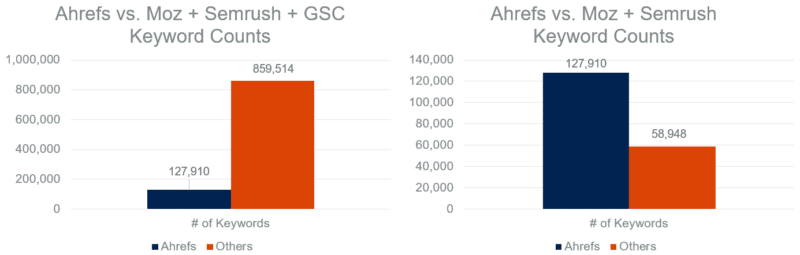
Second chart: The total ranking keywords in Ahrefs compared to the total ranking keywords found in Moz and/or Semrush and not in Ahrefs for 51 domains in May 2022.
First, the fact that Ahrefs is even able to be compared to the other sources stacked together is powerful. This is far from a knock on it. However, if all of our eggs were in the Ahrefs basket, we would be missing out on a consequential amount of keyword data.
Even if you remove Google Search Console, Ahrefs still didn’t contain 32% of keywords.
At the same time, not using Moz (our smallest source), leaves some blindspots.
When compared to Ahrefs and Semrush, 13% of keywords were exclusive to Moz
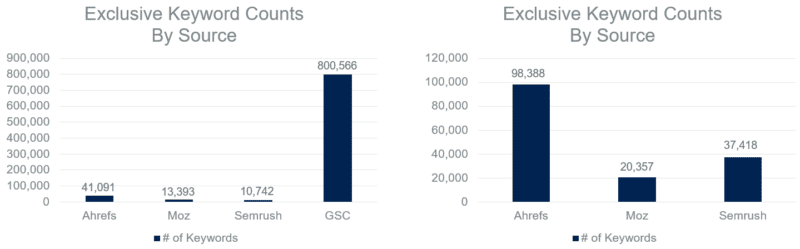
Second chart: Total ranking keywords exclusive to one source comparing Ahrefs, Moz and Semrush for 51 domains in May 2022.
When looking at the chart on the right, missing out on 13% of total keywords is hard to ignore.
Moz’s exclusive numbers dropped drastically when GSC was added to the mix with under 2% of keywords. But as I’ve previously mentioned, these tools aren’t exactly equivalent in what they cover.
Semrush’s exclusivity percentage jumped to 24% when compared to Ahrefs and Moz, but it was also sitting at under 2% when GSC was included.
Let’s look at the opposite end of the spectrum. Instead of exclusivity, where was there complete coverage? If we drew a random keyword out of a hat, how likely would it be found in each of the four sources we analyzed?
Fewer than 1% of keywords were found in all four sources
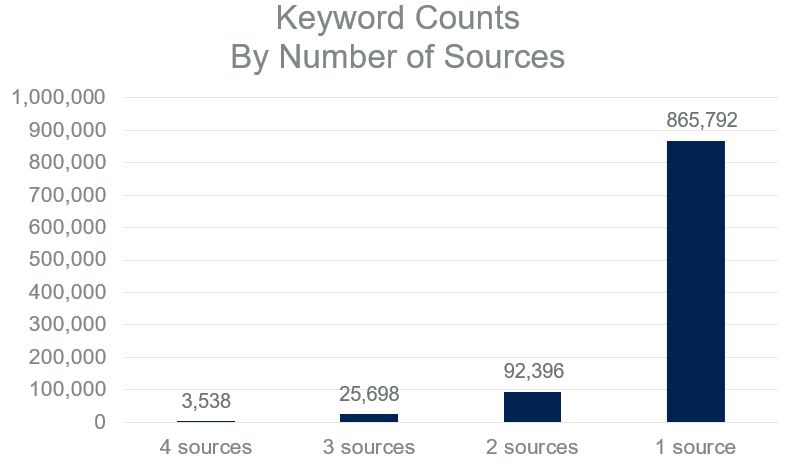
A staggering amount of keywords in our dataset were only found in one source. Conversely, just a select few were represented in all four sources.
The keyword counts increased modestly from 0.4% to 2.6% when moving from four sources to three. Even two sources didn’t cover 10% of the total keywords.
Get the daily newsletter search marketers rely on.
Methodology
Data collection
- Google Search Console: Unfiltered, query-level search data was stored in our data warehouse via Google Search Console’s API each day from May 1 to May 31 for 51 client domains. Keywords were deduplicated by domain and aggregated into a monthly total.
- Semrush: One live API call via Semrush’s Domain Organic Search Keywords report was stored in our data warehouse in May for 51 client domains. The U.S. was the designated region.
- Moz: Organic search keyword rankings were manually exported from the front end of Moz’s Keyword Explorer using the default settings in May for 51 client domains.
- Ahrefs: Organic search keyword rankings were manually exported from the front end of Ahrefs’ Keywords Explorer using the default settings in May for 51 client domains.
Processing and analysis
A query-source matrix was created in order to determine where there was overlap and exclusivity among Ahrefs, Google Search Console, Moz and Semrush per client domain and in aggregate.
Caveats and considerations
Data sample
I mentioned this in the introduction, but it’s worth repeating. Our analysis featured both a small and industry-specific sample of domain rankings. You should not draw any conclusions around overall relative keyword size comparisons of these tools.
So, why publish the results? As also touched on in the key takeaways section below, beyond the data being interesting and potentially sparking beneficial dialogue, I wanted to stress the value of analyzing these tools under the lens of your industry.
Source availability
Ahrefs, Google Search Console, Moz and Semrush are not the only products with unique keyword visibility datasets. Serpstat, seoClarity, Brightedge’s Data Cube and other tools could have been part of this study to make it more comprehensive. If any reps from those tools are reading this, we would be interested in comparing your tool to the rest next time around. Hit me up!
Source comparability
With Ahrefs, Moz and Semrush, these were one-time data pulls within the month of May. However, with Google Search Console, 31 separate API calls were made. This may have inflated GSC’s numbers a bit.
Had we pulled rankings each day in May for the other tools, more unique keywords would have been added either from shifting domain rankings or keyword database updates. For what it’s worth, I don’t believe it would have impacted any overarching trends or takeaways.
Additionally, Google Search Console data included mobile and desktop keywords from all countries, while we only included U.S. desktop rankings from the other sources. This again would inflate GSC’s numbers, but not likely to a degree that would change any of the trends in a meaningful way.
Keyword volume exclusion
Keyword volume was not included in this exercise, which limits its potential value. With all else being equal, I’d be more worried if Moz missed a 25,000 MSV keyword than a 25 MSV keyword.
The next time this analysis is run, we plan on incorporating volume. However, we’ll need to create logic around how to best include GSC impressions as an MSV proxy, as well as how to calculate the volume for keywords found in multiple tools.
Data freshness
Data freshness was not considered in this analysis. Due to the way its metrics work, Google Search Console is inherently fresh. In other words, if we pulled GSC data from May, those keywords were definitely visible in May (even if only for a moment).
However, it’s possible the other sources contained keywords without a refreshed rankings pull since before May. If any of these tools had disproportionately stale data, it could have altered the results.
Key takeaways
1. Challenge your assumptions
Before revealing the results to my team, I asked them to rank the four sources in order of keyword coverage based on their own gut feeling. Around 10 people guessed, including me, but not one of us was correct!
Semrush was routinely ranked lower than we predicted, and GSC was not given nearly enough credit. However, with GSC, that’s more likely due to them being used to pulling the data from the front-end user interface.
We all can be guilty of trusting our gut feelings and hunches a little too much, and this goes far beyond SEO tools. As marketers, we should continually pressure test our positions and be willing to change our minds.
2. Use the GSC API
When pulling data directly from Google Search Console’s user interface, you are limited to 1,000 rows of data. If we had simply downloaded data from GSC with the date range of May 1 to May 31, this tool would no longer have been leading the pack (far from it).
Querying GSC from the API still has its limitations, but it increases the amount of available data by a considerable margin.
3. Use all the tools
Admittedly, this takeaway is a bit of a contradiction coming from me. As stated in the section above, we don’t even use all of the tools, nor do we plan to. However, I have consistently advocated for not using just one SEO tool.
My actual advice is this: invest in one-month subscriptions and/or free trials to gauge the relative performance in your specific category. From there, you can choose the best tool(s) for you based on your particular verticals, budget and goals. Our pharmaceutical client ads often say, “Results may vary,” and the same is true with this. Take the extra time to see what’s best for you.
Also, when testing out tools for your specific industry and needs, don’t just look at keyword sizes. Size, accuracy, user experience, customer support, technology integrations and so much more can also be considered.
4. Repeat and improve your tests
Our first official test is done, but we don’t plan on calling it quits. Semrush recently went public. Moz was acquired just over a year ago. Ahrefs launched a search engine.
This is an arms race, and if we don’t refresh these results periodically, we could be making decisions on outdated and inaccurate data.
Opinions expressed in this article are those of the guest author and not necessarily Search Engine Land. Staff authors are listed here.
New on Search Engine Land
About The Author

https://searchengineland.com/keyword-size-gsc-ahrefs-semrush-moz-387980