We are still in the midst of running a dangerous experiment on Earth’s climate system, and we get to periodically check in on the results—like laboratory rats peering at the graphs on a whiteboard across the room. And it’s that time again.
Every year, global temperature can be compared to the predictions born of the physics of greenhouse gases. A number of groups around the world maintain global surface temperature datasets. Because of their slightly differing methods for calculating the global average and slightly differing sets of temperature measurements fed into that calculation, these datasets don’t always arrive at exactly the same answer. Lean in close enough and you’ll see differences in the data points, which can translate into differences in their respective rankings of the warmest years. The big picture, on the other hand, looks exactly the same across them.
NASA, NOAA, and the Berkeley Earth group each released their end-of-year data for 2021 today, while the Japanese Meteorological Agency (JMA) and European Centre for Medium-Range Weather Forecasts (ECMWF) numbers were already out. They all came up with similar rankings this year. All but ECMWF placed it as the sixth warmest year on record, while ECMWF ranked it in fifth place. It was very close to 2015 and 2018, so fifth through seventh are roughly tied. What is true for all of the datasets is that the last seven years are the warmest seven years on record.
-
NASA’s temperature dataset, with bars showing the average of each decade.
-
The Berkeley Earth temperature dataset.
-
You can see how years rank in the Berkeley Earth dataset, along with the overlaps in the error bars on each year.
-
NASA (GISTEMP), UK Met Office (HadCRUT5), NOAA, Berkeley Earth, and another published dataset compared.
-
Total ocean heat content tracks the accumulation of heat energy in the world’s oceans.
Different datasets use different baselines—a mathematically arbitrary zero point to plot data points against—so comparing them can take a little calculator work. Berkeley Earth notes that 2021 comes in at 1.21° C (2.17° F) warmer than the 1850-1900 average. NASA records it at 0.85° C (1.52° F) warmer than the 1951-1980 baseline they use.
Individual years will fall a little above or below the long-term trend line because of the natural variability of weather. The most common factor that explains why a year ended up where it did is the El Niño Southern Oscillation (ENSO). This sloshing of warm surface water and cold deeper water across the equatorial Pacific—and the way it affects the atmospheric circulation above it—impacts weather patterns around the world. Last year was firmly in the La Niña category, with cooler water pushing across the Pacific. That has the effect of pulling down the global average surface temperature.
In 2020, the Pacific started out close to a (warm water) El Niño state before descending into La Niña conditions. But 2021 generally saw a La Niña throughout. So while 2020 roughly tied 2016 for the warmest year on record, 2021 did not reach that mark. Given that the current outlook for ENSO sees a return to neutral later this spring, 2022 is likely to end up a bit warmer than 2021.
While air temperatures at the surface are variable, estimates of the total heat content of the oceans (which contain far more energy than the atmosphere) are considerably more consistent. The latest update shows 2021 setting a new record high, as heat trapped by a strengthening greenhouse effect inexorably accumulates in Earth’s oceans.
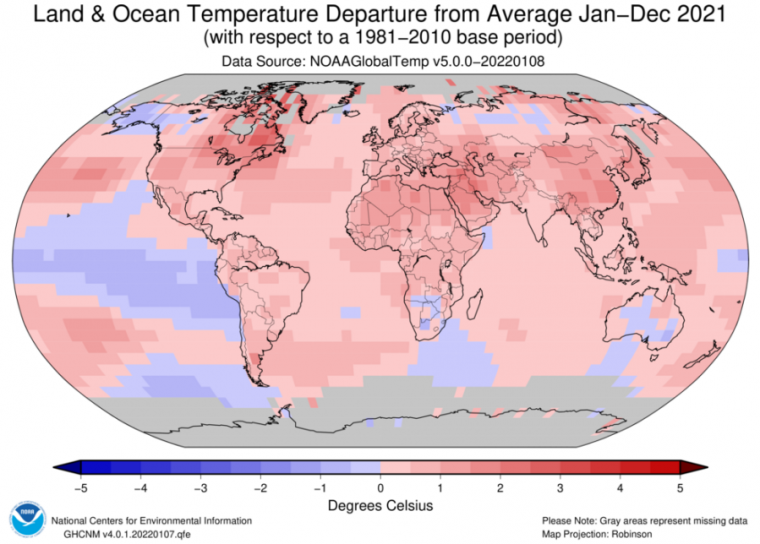
Of course, a lot more goes on in our climate system over a year than can be represented with a single number. Temperatures in Australia and Alaska were closer to the 1951-1980 average, for example, while China experienced its warmest year on record. Europe set a new record for summer heat, boosting dry conditions that led to terrifying wildfires in Greece.
-
Global temperature map from the Berkeley Earth dataset.
-
Areas that stand out for setting a record (or near record) in the Berkeley Earth dataset.
-
US disasters causing more than a billion dollars of damage last year.
It was a similar story in the Western US, with pervasive drought bringing numerous fires. The Pacific Northwest experienced a record-crushing heatwave in June—while an unusual February cold snap in Texas turned deadly as frozen natural gas lines (and other problems) produced prolonged power outages. Overall, it was the fourth warmest year on record for the contiguous US.
NOAA has kept a record of (inflation-adjusted) billion-dollar disasters in the US since 1980, and last year added 20 of them to the tally. The average for this whole time period is about 7.4 per year, but the average of the last five years is just over 17.
Last year, the list included four landfalling hurricanes along the Gulf Coast, tornado outbreaks, storms, and those heat waves, cold snaps, and wildfires. The year got in one final punch on December 30, when Colorado’s Marshall Fire burned more than a thousand homes and businesses. That event was a combination of wild downslope winds and record dry conditions with the second warmest December on record for the state.
https://arstechnica.com/?p=1825722

