While the world’s nations have been in agreement for some time that we should limit global warming to no more than 2°C (or even 1.5°C), action has fallen short of ambition. As such, this week saw the 10th annual UN Emissions Gap Report—an update on the gap between our current greenhouse gas emissions and the cuts that would set us up to meet those goals.
When someone who is trying to lose weight steps on a scale and sees a higher number than yesterday, it’s not very encouraging. That’s where we find ourselves. The report puts 2018 human-caused greenhouse gas emissions at the equivalent of 55.3 billion tons of CO2—our highest yet. (This method combines all greenhouse gases into one number.)
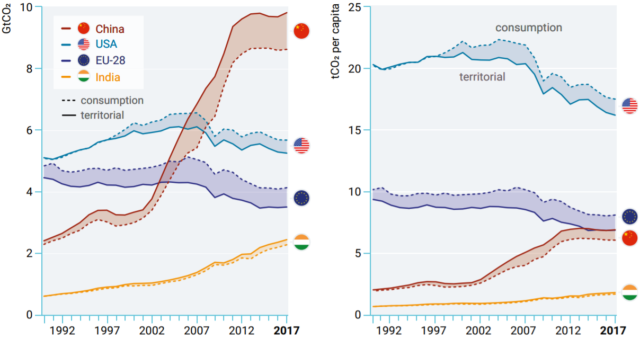
The factors driving a country’s emissions can be described by GDP (Gross Domestic Product), the energy used per unit of GDP, and the greenhouse gas emitted per unit energy. The wealthiest (OECD) nations are averaging about 2% economic growth, while the rest of the world is averaging 4.5%. Those two categories of nations are reducing energy per unit GDP at about the same rate, so energy use barely increased among the wealthiest nations but increased 2.8% among the others. As a result, much of the recent increase in emissions has obviously come from developing economies.

The report checks in on both progress toward national pledges submitted during the 2010 Cancun talks (covering emissions through 2020) and the major 2015 Paris Agreement (which went through 2030). Of the G20 nations, Canada, Indonesia, Mexico, South Korea, South Africa, and the United States will probably fail to hit their 2020 promises. Australia is claiming to have met its goal because it overachieved earlier, but it also won’t truly hit its 2020 promise.
As for Paris goals, the report projects that China, EU nations (UK included for now), India, Mexico, Russia, and Turkey are on track to fulfill their 2030 pledges. Australia, Brazil, Canada, Japan, South Korea, South Africa, and the US are not. Argentina, Indonesia, and Saudi Arabia are questionable.
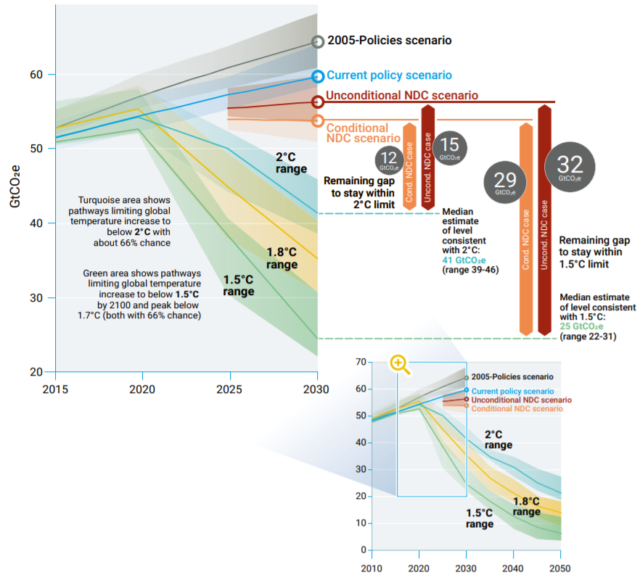
How far does that put us from the road that halts warming at 1.5 or 2°C? Well, even if every nation was on track to hit all its 2030 pledges, we’d end up at around 54 billion tons of CO2 being emitted. To stop at 2°C, that number should be about 15 billion tons lower. To stop at 1.5°C, the gap grows to 32 billion tons. As we knew at the time the Paris Agreement was signed, those initial pledges were only good enough to limit warming to close to 3°C—better than a future of unrestrained emissions growth, but not exactly “mission accomplished.”

https://arstechnica.com/?p=1624657

