It has been eight years since the last major report from the Intergovernmental Panel on Climate Change (IPCC), though it has produced smaller reports since then. But today, the first piece of the 6th Assessment Report is out. Most of it should not surprise you—the basics of climate science have been known for decades. And the general outlines were already obvious: almost all of the warming is due to human activities, and, without immediate action, we’re poised to blow past 1.5º C of warming.
Still, each report is a little more useful than the last, and we’re going to go over what has changed in terms of the science and what has changed in how that information is being shared with the public.
The IPCC is the product of a United Nations organization that coordinates—but does not write—these reports. The writing is done by scientists from around the world who volunteer their time to create these daunting tomes that seek to summarize the entire state of scientific knowledge for all kinds of decision-makers. Each major report is split into three working groups. The first focuses on the physical science of the climate system, the second on the impacts of climate change on humans and other species, and the third on methods for mitigating climate change.
Today’s release is the Working Group I section of the report. It’s massive—a product of 751 scientists that references over 14,000 studies and data sources. The scientists addressed tens of thousands of comments submitted by reviewers, and its Summary for Policymakers underwent a line-by-line approval process. National delegates can ask for clarification of any sentence, with scientists either obliging them or explaining why a requested change would be inaccurate.
Yes, Houston, we are still having that problem
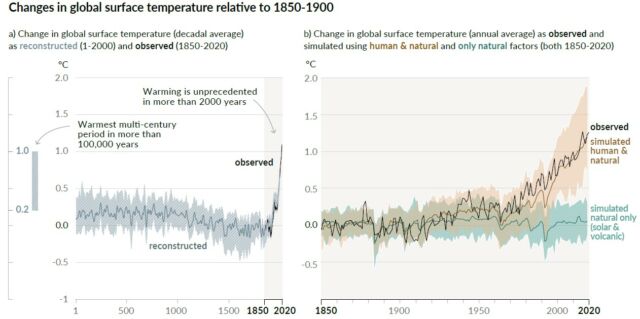
Let’s start with the basics. Using the average of the last decade, the report notes that surface temperatures have warmed about 1.09°C (1.96°F) since the late 1800s. The new summary statement about humanity’s contribution to that warming says, “The likely range of total human-caused global surface temperature increase from 1850–1900 to 2010–2019 is 0.8°C to 1.3°C, with a best estimate of 1.07°C.” That is, humans are responsible for approximately all of it.
Putting this into historical context, the report concludes that the present state of the climate goes beyond anything the Earth has seen in quite some time: “In 2019, atmospheric CO2 concentrations were higher than at any time in at least 2 million years[…] Global surface temperature has increased faster since 1970 than in any other 50-year period over at least the last 2,000 years.”
While the impacts of climate change are primarily the purview of the next working group, this report details changes in dangerous weather extremes, physical conditions that affect ecosystems, and the long timeline of sea level rise that we are now committed to.
Finally, projections of various future greenhouse gas concentrations highlight the futures we can yet choose between. It is still physically possible to limit warming to 1.5° C or 2° C, given the will to act. It is likewise still possible to cross 4° C or 5° C by 2100, given a sufficiently blatant disregard for current and future life on our planet.

News you can use
Among the things that immediately jump out in this latest iteration is a focus on regional trends, particularly trends in extremes. Global trends can mask regions that are going in opposite directions for various reasons—these can be violations of general rules like “wet regions get wetter, dry regions get drier” or unexpected changes in atmospheric circulation patterns. Models aren’t necessarily as good at projecting changes on local scales, though, so it can be challenging to tease out regional trends.
This report seeks to make it easier to view information about a specific area. This is partly a simple matter of better presentation (see the excellent new “interactive atlas” website) and partly progress in what we know—particularly thanks to recent work assessing the role of climate change in specific extreme weather events.
“Human-induced climate change is already affecting many weather and climate extremes in every region across the globe,” the report says. “Evidence of observed changes in extremes such as heatwaves, heavy precipitation, droughts, and tropical cyclones, and, in particular, their attribution to human influence, has strengthened since [the 2013 Assessment Report].”
Version 6.0
Getting into the nuts and bolts a bit more, there are several notable updates. And those updates start with climate sensitivity—a measure of how much warming results from a given amount of greenhouse gas emissions. It’s a huge subject with a long history. Back in 1979, a landmark report estimated that doubling the concentration of CO2 in the atmosphere would result in 1.5-4.5° C warming, with 3° C the likeliest answer. Those numbers have been impressively durable.
The 2007 IPCC report included a significant revision, raising the low end to 2° C. Controversially, a few studies published just before the 2013 IPCC report led to its estimate reverting to the old 1.5-4.5° C of warming. A major study we covered last year undertook an effort to synthesize the current state of research on this important number, and it clearly influenced this new report. “The AR6 assessed best estimate is 3° C with a likely range of 2.5° C to 4° C,” it concludes.
That narrower range is taken into account for projections of future warming and sea level rise, which are done a little differently this time. The latest generation of climate models has some quirks, with efforts to improve the realism of cloud behavior in certain models having raised their simulated climate sensitivity above the rest of the pack. Rather than using the averaged model output directly as the projections, multiple lines of evidence are now being combined—which has the result of moderating outlier models by giving them less weight in the average.
Still, projected warming looks familiar, even though there’s a new set of greenhouse gas emissions scenarios, as well. Total warming by 2100 ranges from about 1.4° C in a lowest emissions scenario to about 4.4° C in the highest emissions scenario.
Sea level rise projections are much less complex than in past reports, where numbers were given for certain contributors to sea level rise while other contributors were described as too uncertain to quantify. Scientific progress has been made since then, and this report gives a straightforward projection for each emissions scenario—from about 0.4 meters (1.4 feet) between the early 2000s to the end of the century at the low end, to about 1.4 meters (4.7 feet) in the high emissions scenario. But it also acknowledges a lower-probability worst-case scenario closer to 2 meters (6.5 ft).
-
These are the basic scenarios for future greenhouse gas emissions.
-
Temperature projections by emissions scenario.
-
Sea level rise projections by emissions scenario, with a “worst-case” scenario explicitly illustrated.
-
The more we emit, the warmer it gets. This chart breaks that relationship down in a simple way, showing how little we can still emit before crossing certain warming milestones.
Select a destination
This piece only scratches the surface of the information presented. It’s worth checking out the report yourself to learn more. But it’s also true that we’ve known enough to act on climate change for decades.
This report summarizes the science of how our climate system works, but fixing these problems is, in large part, a political task. This November, a crucial international conference is taking place in Glasgow. The Paris Agreement that was adopted in 2015 included a “ratchet” mechanism, with meetings held every five years (delayed by the pandemic) for nations to strengthen their pledged emissions reductions. This is the first opportunity for nations to deliver on that promise.
The pledges so far do put us on track for warming in the vicinity of 3º C—lower than the highest emissions scenario, but much higher than we’d like. But this report points out that the human-caused strengthening of the greenhouse effect has grown to about 2.7 watts per square meter of the Earth’s surface, which is 0.3 watts higher than it was a decade ago.
“We can’t undo the mistakes of the past,” said Inger Andersen of the UN Environment Programme during a press conference Monday. “But this generation of political and business leaders, this generation of conscious citizens, can make things right.”
https://arstechnica.com/?p=1785708

