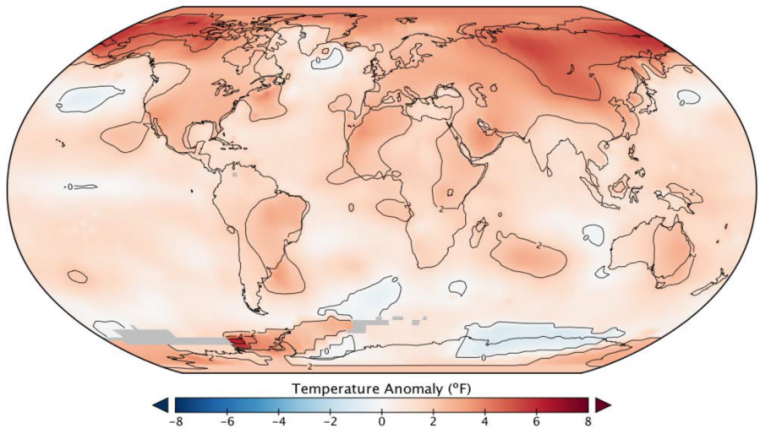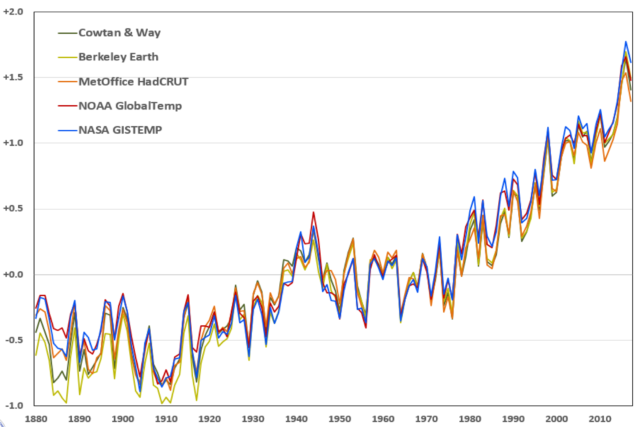
Last year had its fair share of attention-grabbing natural disasters, so you can be forgiven for not keeping an eye on the global average temperature as the months rolled by. But NASA, the National Oceanic and Atmospheric Administration (NOAA), and the UK Met Office all announced their final tally today: 2017 ranks as the second or third warmest year on record, depending on which dataset you ask.
In the NASA dataset, 2017 comes in a few hundredths of a degree Celsius above third-place 2015, while NOAA puts 2015 a touch above 2017. The UK Met Office dataset also ranks 2017 in third. The datasets use slightly different methods, including different approaches to handling the polar regions, where weather stations are sparse.
It turns out that the cold weather in the eastern United States around the holiday season was not indicative of what was happening on the rest of the planet, much less for the rest of the year. President Donald Trump may have been tweeting that “we could use a little bit of that good old Global Warming,” but he was doing so during an exceedingly warm year.
After three consecutive “hottest on record” years in 2014, 2015, and 2016, the dubious trophy was not expected to change hands again this year. In fact, in our coverage of the 2016 numbers last January, we highlighted the UK Met Office prediction that 2017 would probably come in third by a hair, which it did.

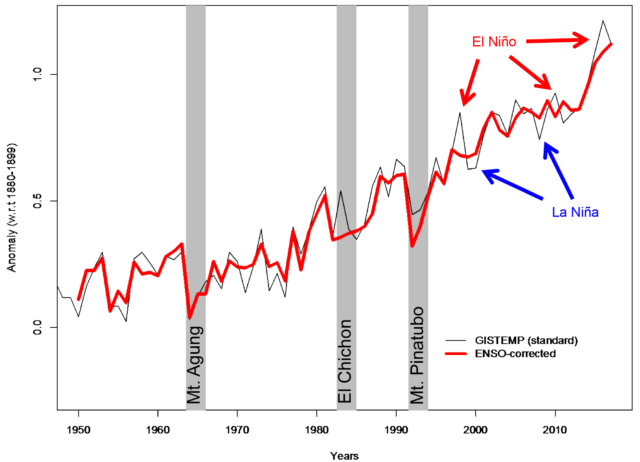
While continued global warming is the reason that we keep breaking records, there is a significant amount of natural variability that determines which years end up being the record breakers. The largest factor is the El Niño Southern Oscillation, a pattern of warm surface water distribution in the Pacific Ocean. El Niño years have slightly elevated global average surface temperatures, while La Niña years tend to drop just below the long-term trend line. After strong El Niño conditions in 2015 faded in 2016, 2017 saw pretty neutral conditions that eventually shifted into a mild La Niña. As a result, 2017 global temperature stayed a tick below 2016.

Satellite records of upper air temperatures looked similar, ranking 2017 the third or fourth warmest since those records began in 1979.
Going back to the start of the industrial revolution, this marks about the third straight year that global warming has passed 1 degree Celsius (1.8 degrees Fahrenheit) beyond that starting point. This milestone serves as a warning that we are rapidly approaching 1.5 and 2.0 degrees Celsius warming—limits that have been the subject of much talk in international climate negotiations, but there has been little associated action. In fact, while global greenhouse gas emissions had approximately flat-lined for several years, it is thought that emissions again rose by about two percent last year.
As for 2018, the current NOAA forecast sees La Niña conditions weakening this spring. The UK Met Office global temperature forecast expects La Niña to do enough that 2018’s average temperature is likely to be about the same and end up the fourth warmest year—behind 2015, 2016, and 2017.
https://arstechnica.com/?p=1246283

