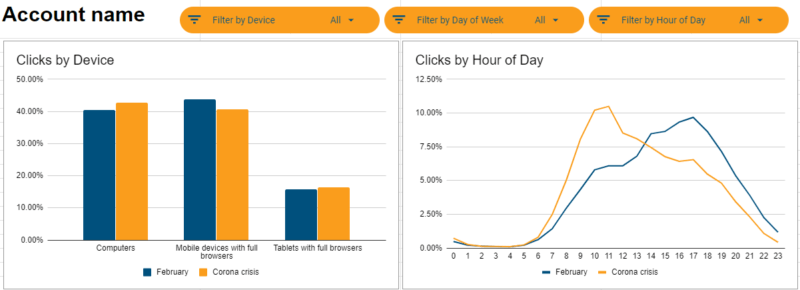
With the economy in turmoil and people staying at home, search behavior is naturally affected. But is there really a substantial shift from mobile to desktop devices? Is night-time search traffic really on the rise? Are the differences between weekdays really blurring? And most importantly: How does this affect my accounts? I found it tedious to analyze these things manually, so I made a script.
The script I’m sharing today helps to answer these questions. It basically just creates a few charts, giving you the ability to spot changes in search behavior easily. It plots the percentages of your clicks and conversions with regard to:
- devices
- weekdays
- hour of the day
By default, it compares February to the last four weeks. The result is a Google Spreadsheet that looks something like this:

The script can be used in a single Google Ads account or in an MCC. If you use the script in an MCC, the resulting spreadsheet contains one sheet per account.
How to use the script
Copy the code from here, add it as a new script to an account and run it (preview mode is enough). It automatically detects whether it runs in an MCC or not. No configuration is needed.
Depending on the number of accounts to analyze, the script can take a few minutes. When it’s done, find the spreadsheet’s URL in the logs below.
Going beyond the crisis: Configuration options
To be clear: The script works without you having to go over any configuration settings. However, you can configure the script to analyze other things as well. All configuration options can be found at the beginning of the script along with their documentation (including examples).
Even though the script was made to analyze the impact of the Corona crisis, it’s basically just a comparison tool for different time periods. Change the periods setting to run other analysis, like
- Christmas vs. Easter
- Spring vs. summer vs. fall vs. winter – compare as many periods as you like.
- It doesn’t have to be a comparison – you can analyze a single period as well.

The adNetworkTypes setting lets you restrict the analysis to certain networks, like Google search or YouTube.
If you don’t want all three charts for device, weekday, or hour of day, change the rowDimensions setting. Besides clicks and conversions, you can also set the script to chart impressions, cost, and conversion value by using the metricNames setting. Using fewer charts speeds up the script.
There are more settings:
- accountLabelName: Use this setting if you want to label accounts to process.
- maxAccounts: Change this to process more or less accounts. The script can handle more than 50, but timeouts may occur when the results are posted (charts are slow).
- spreadsheetName: What to call the spreadsheet.
- viewerEmails and editorEmails: Use these to automatically assign viewer or editor permissions to the spreadsheet.
- anonymizeAccountNames: If this is set, accounts will just be numbered (in case you want to share or present anonymized results).
Conclusion
Analyzing Bloofusion’s clients I found that in most cases, traffic and conversion distribution did not change dramatically. Naturally, smaller accounts had bigger fluctuations but with more traffic, most accounts were rather stable (with a few exceptions). Still, our client base is mostly German and mostly eCommerce, so you should probably look at your own data.
What did change for most clients was volume and sometimes conversion rates. To analyze how these metrics changed when government actions were issued, check out this script that Frederick Vallaeys published last week.
Opinions expressed in this article are those of the guest author and not necessarily Search Engine Land. Staff authors are listed here.
http://feeds.searchengineland.com/~r/searchengineland/~3/iwYRl5uuftk/a-simple-script-to-compare-search-behavior-before-and-during-covid-19-332935


