As digital marketers, we are always looking for the next time saving idea to provide a competitive edge. Due to Covid-19, we are making this one public in the hope it can help your business or clients.
Special thanks to Duane Brown for his input during research, Angelo Caldeira for all things code related, and Richard Kliskey for keeping the PPC lens in focus throughout.
The big idea
The popularity of all retail products bought online through Google Shopping changes weekly. Retailers have to measure this demand and manage their inventory, advertising efforts and commercial KPIs.
Comparing product insights across the online retail industry with your own data is not a cheap or easy thing to do.
DTC brands are in danger of being oblivious to wider category trends. Multi-brand retailers who want insights beyond their own data have to pay for expensive enterprise solutions.
Google Trends for Google Shopping is not yet a thing in 2020. We set out to bootstrap a solution any company can build and use in their own industry.
For smaller brands who typically manage product analysis solely within Shopify, new insights require new habits.
Here are the key PPC benefits of creating product insights using Data Studio.
- Save Time: Automate the manual creation of product insights.
- Save Money: Identify underperforming products faster and adjust your advertising.
- Make Better Decisions: Include industry popularity of products when assessing stock and advertising decisions.
A message to non-technical PPC professionals
Even Batman needed Lucius Fox to help build cool tech. Once you partner up, the only limitation is your imagination and deciding which APIs to plug in. If you want better PPC insights within Data Studio, you need to build a custom database.
For non-technical PPC marketers, the time you invest now in finding a developer to collaborate with, will pay off massively and it is definitely worthwhile.
Technical requirements
To build a custom database for PPC you and/or your developer will need the following:
- Programming skills in Python
- Basic knowledge of SQL
- Access to Google Analytics and Google Ads API
- Ability to set up a Google Service Account
- Understanding of Google BigQuery as a custom database
- Ability to set up code to run in the cloud (e.g. AWS)
- Data Studio dashboard knowledge
Here’s the good news! We are sharing for free, hours of coding already done for you. The links to the resources are in the next sections.
If you’re not comfortable following the technical instructions, we highly recommend partnering with a developer to help action the various scripts and custom database setup.
PPC considerations
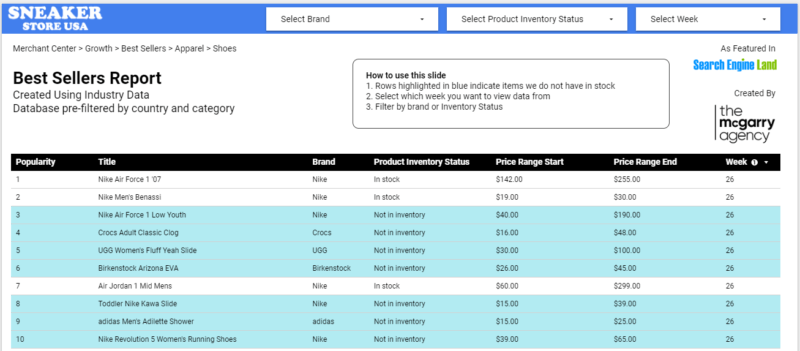
First, choose your industry’s best-seller niche. Decide which industry data you need from Merchant Center. In this example we featured sneakers. You can set this up for many other niches such as electronics or a pet store.
Second, add your own data sources. Combine retail industry popularity rank alongside advertising and commercial KPIs / Google Shopping and Google Analytics KPIs.
Third, define what an insight is for you. Decide which data is the most important to use when automation can provide actionable insights. Examples: up/down trending products, whether you stock a highly popular product, commercial KPIs from Google Shopping alongside retail industry popularity rank.
Again, we want to repeat the fact this solution can be tailored to any product types where bestseller data from Merchant Center is available.
Our Insights Example, ‘Sneaker Store USA’
Free code and technical guidance is available within the github link.
We created an example data model to be accurate to the sneaker industry without the data actually belonging to anyone. The aim here is to use your own data in your own market. Combine best seller industry data with your advertising data to create your own insight trends.
For this particular example, let’s call the client SNEAKER STORE USA.
How to create new Google Shopping Insights reporting
The order of technical actions is as follows:
- Set up your Google service account.
- Make sure you have read-only access in Google ads and Analytics API.
- Set up a BigQuery project.
- Ensure access to your product feed used in Google Shopping.
- Set up a Python virtual environment.
- Get everything authenticated in your environment.
- Download our code with the technical guide [download link].
- Follow all the instructions for the software using the README file contained with the free code.
- Set up the code to run in the cloud and schedule when to run.
- Now you can adjust it to your business.
PPC problems solved
From our PPC team, we asked Richard Kliskey to expand on the challenges and solutions on offer through this reporting insights project.
Richard writes, “SMEs managing Google Shopping need to connect merchandising insights with advertising decisions. The challenge for smaller advertisers is how best to make use of Google’s retail industry data and create actionable insights. The popularity data is there in the Merchant Center but most likely SMEs don’t use it.”
“A company’s growing product catalogue creates an insight automation challenge. SMEs need to identify commercial KPI trends in time to maximise the market opportunity – all while minimizing wasted spend on products with declining demand and/or profitability.”
“One of the key challenges in working with a growing product inventory is accessing actionable insights quickly. E-commerce professionals need to compare client data with industry category data, and then compare that with Google Ads’ multi-touchpoint performance with actual sales performance.”
PPC professionals can use a custom database within Data Studio to achieve actionable improvements.
- Identify opportunities to increase market share
- Identify opportunities with high potential
- Industry specific example, Sneakers.
Identify opportunities to increase market share: Start with the industry best seller report.
Compare your data with Google Shopping’s industry-wide popularity rank. Identify opportunities to increase market share. The objective is to find products in your inventory that have low click volume but are popular selling products according to Google.
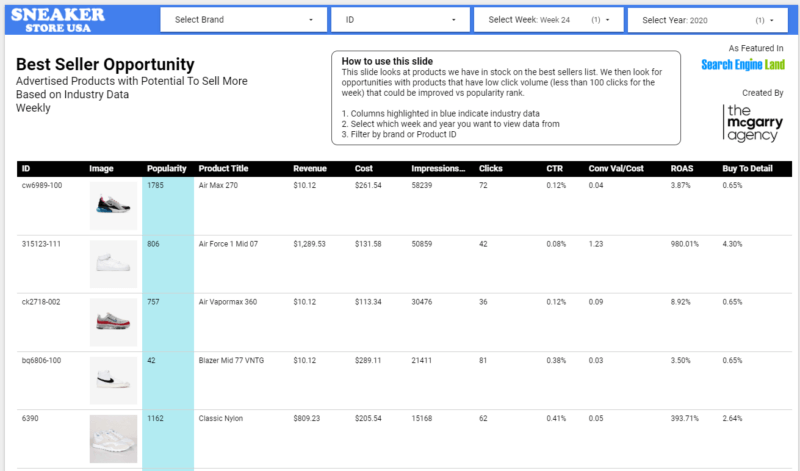
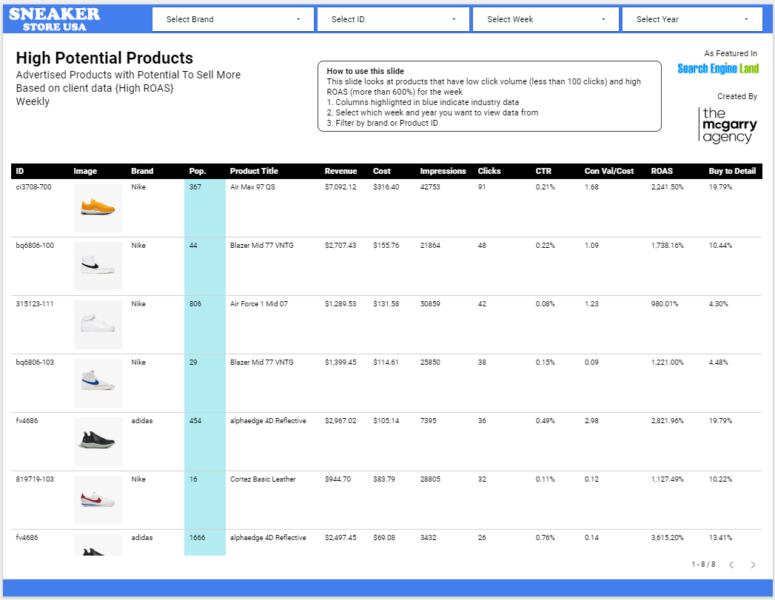
Identify opportunities with high potential: By using a custom database and Data Studio reporting, you can identify products with high potential.
This means products with high profitability but lower click volumes. Being able to use Google Ad data, Analytics data, stock availability, and retail popularity rank all in one place can accelerate PPC decision making.
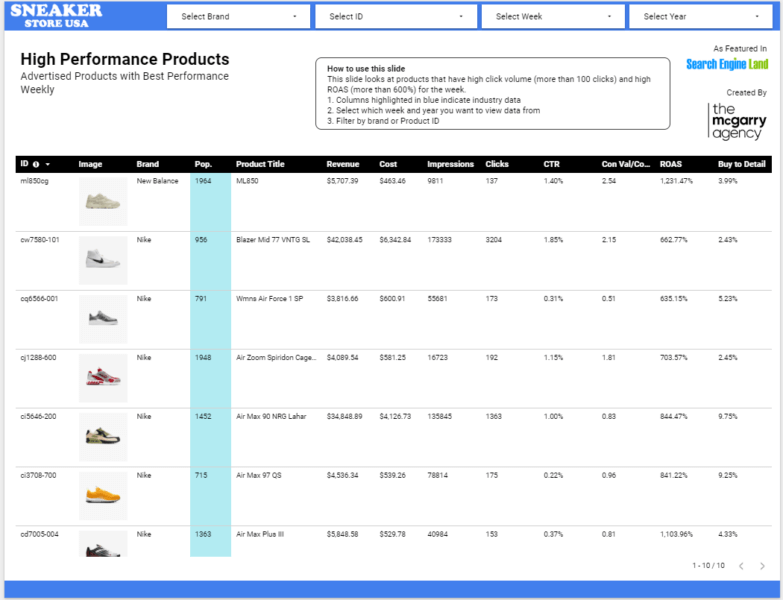
Identifying products by high click volume and low profitability is a simple task to do using the reports function in Google Ads, however, SMEs may struggle to compare this to actual sales data. Many only look at Shopify reporting. This report combines Google Ads and Analytics data together, saving a lot of time in having to jump between browser tabs.
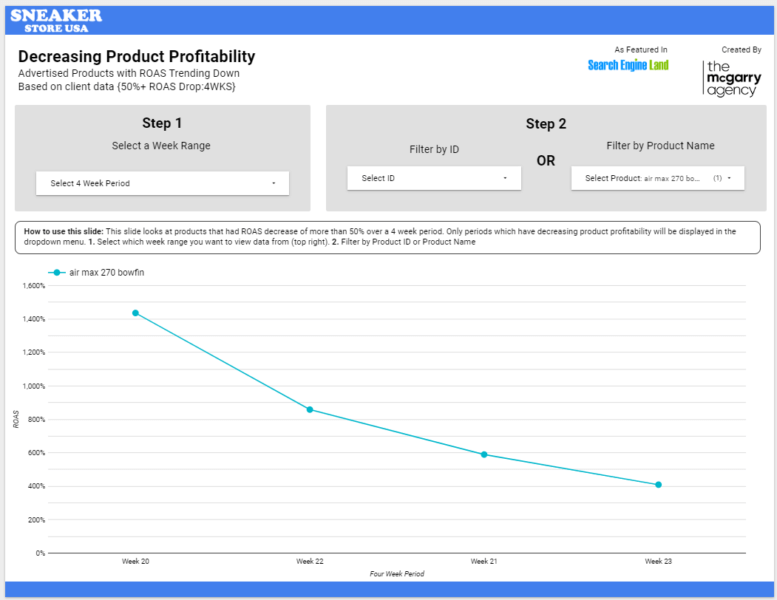
Industry specific example, Sneakers: In the sneaker market, one of the big issues is when popular shoe sizes go out of stock, this usually leads to decreasing profitability in that product.
This Data Studio slide is to help you identify trends in products that have 50% or more decrease in ROAS over a 4 week period. The product itself may appear to have good ROAS overall but the third and fourth week could be very low and need some close attention for optimisation.
Other slide ideas we have shared in the dashboard include a way to produce a graph on sales volume by percentage discount. This provides you, the PPC marketer, with an overview of performance to assess and improve profitability in low margin products.
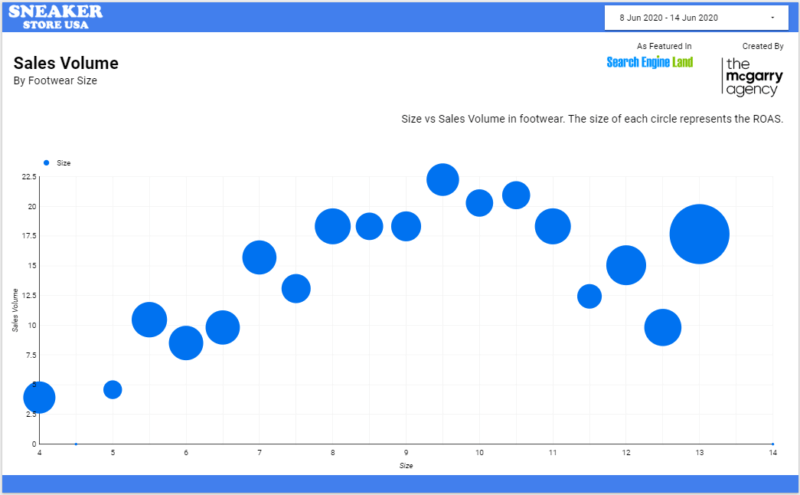
The potential is here to create many more actionable insights based on your own data. This is just the starting point.
Final technical advice
As the developer behind this custom reporting setup, Angelo Caldeira has these feedback points for any developer who is asked to build this custom database and reporting setup.
Angelo writes, “You will need to help non-technical marketers understand the majority of the work is in creating the custom database. Data visualisation is the last part but it’s the only part people will see.”
“It’s important to understand what the PPC individual or team will be gaining from the dashboard, otherwise you may lose focus on what you are trying to achieve.”
“Scan through the code and make sure that the data feed has all the required fields such as gtin, product id, product group ids.”
“If you don’t have access to Google Analytics 360, our code takes this into account because non-360 data is often sampled. If you do have access to 360, then you need to adjust the code slightly. Instructions will be in the README and comments when you download the code.”
To recap, if you advertise in Google Shopping, this custom database and reporting setup can help you see what the best sellers are in your industry alongside your own numbers.
Opportunities for growth and greater profitability become much clearer as a result.
Opinions expressed in this article are those of the guest author and not necessarily Search Engine Land. Staff authors are listed here.
http://feeds.searchengineland.com/~r/searchengineland/~3/S_WtPJv_y98/how-to-create-new-google-shopping-insight-reports-in-data-studio-337101


