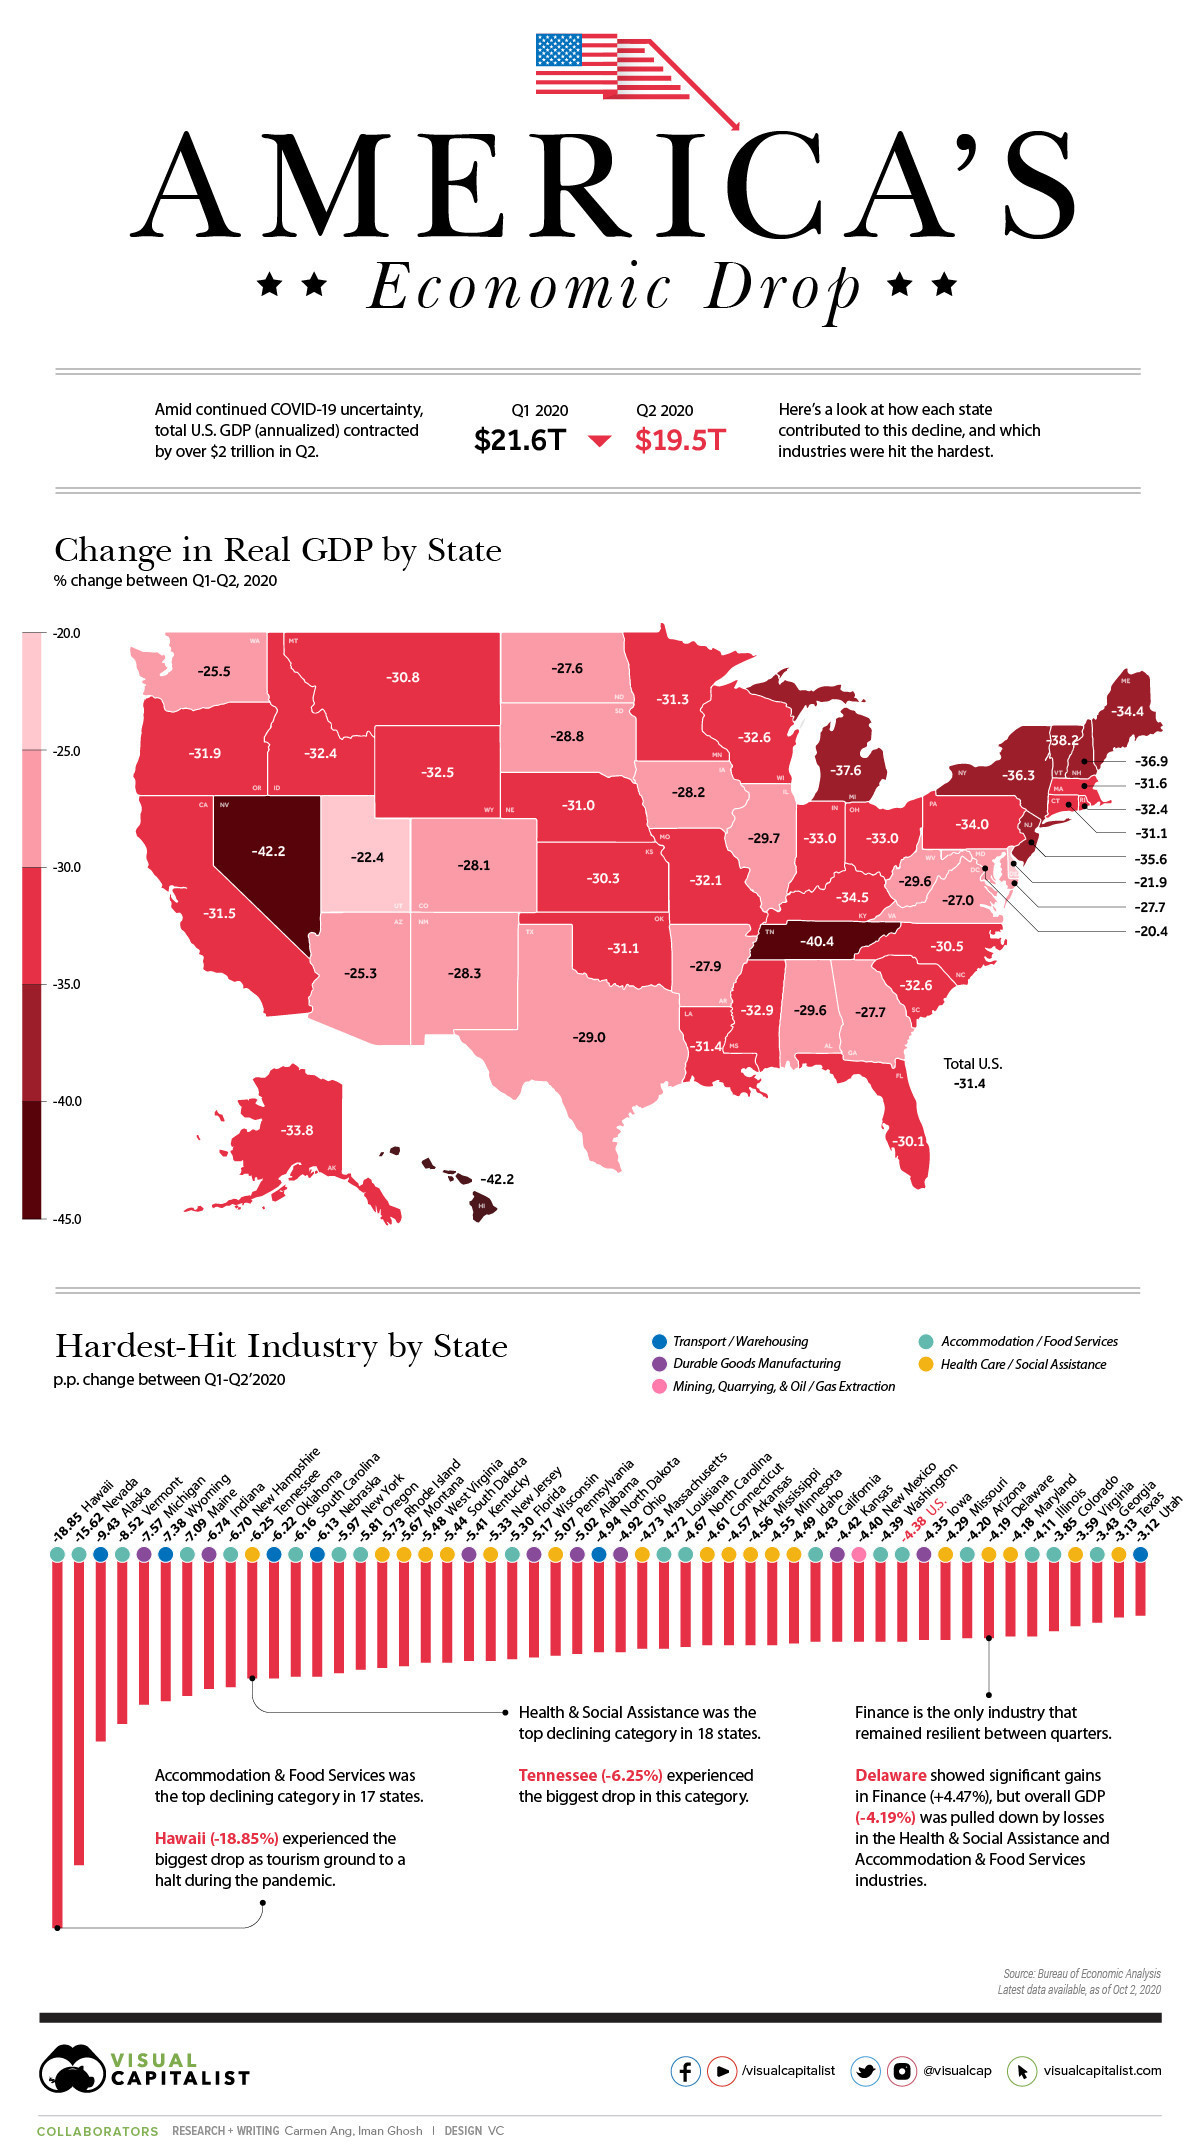
The new data shows that GDP fell from nearly $ 21.6 trillion to $ 19.5 trillion between the first and second quarters.
4 min read
This story originally appeared on Foro Económico Mundial
By Iman Ghosh of Visual Capitalist via FEM in Spanish
- The new data shows that GDP fell from nearly $ 21.6 trillion to $ 19.5 trillion between the first and second quarters in the United States.
- Lodging and food services was the sector that declined the most in 17 states.
- This map shows which states have been the most affected.

Accommodation and food services have been the most affected / Image: Visual Capitalist
The US economic crash of 2 trillion dollars
The US economy took only a handful of months to recover from the effects of COVID-19.
As unemployment rates hit their all-time highs and companies struggled to stay afloat, new data shows that current GDP in dollars plunged from nearly $ 21.6 trillion to $ 19.5 trillion between the first and second quarter of 2020 (seasonally adjusted to annual rates).
Although all states experienced a decline, the effects were not evenly distributed across the nation. This visualization takes a look at the latest data from the Bureau of Economic Analysis , uncovering the biggest declines across all states, and which industries were hit the hardest by the COVID-19-related shutdowns and uncertainty.
Change in GDP by State and Industry
Between March and June 2020, household product orders disrupted consumer activity, health, and the broader economy, causing the United States’ GDP to drop 31.4% from the figures published in the first quarter.
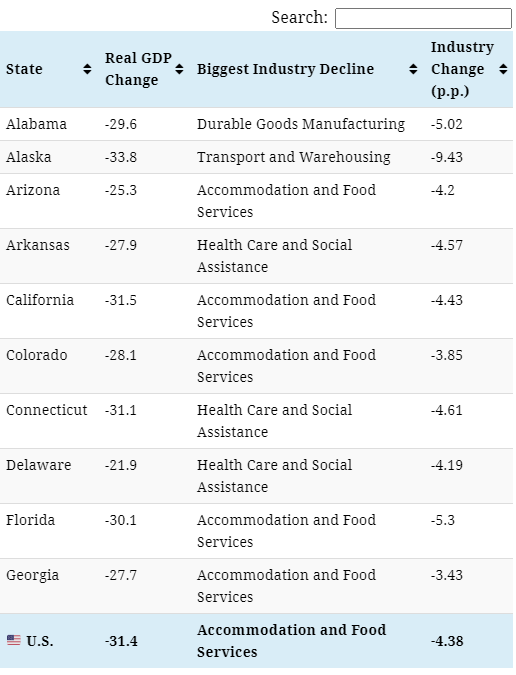
The US economy is the sum of its parts, with each state contributing to total production, making the decline in COVID-19 even more apparent when the change in GDP of each is taken into account. state.

The change in the GDP of the state of Alabama is almost 30% / Image: Visual Capitalist
Note: Changes in industry are reported as percentage points (pp) of total GDP in current dollars between the first and second quarters.
A total of 18 states suffered the greatest impact within the Food and Lodging Services sector, which was also the industry that suffered the most nationally, falling by 4.38%.
Highly dependent on tourism, Hawaii was the most affected by the decline of this industry with a drop of 18.85%. According to the University of Hawaii Economic Research Organization ( UHERO ), a second wave of infections and expired financial aid were behind this contraction.
Next, the health and social care sector was hit the hardest in 17 states between the two quarters, falling the most in Tennessee (-6.25%).
The most resilient industry in the midst of the pandemic was Financial Services. In the state of Delaware, where major banks like JPMorgan Chase and Capital One are located, the sector actually grew 4.47%. However, Delaware’s GDP ultimately still fell due to contractions in other sectors.
The worst performing state in every industry
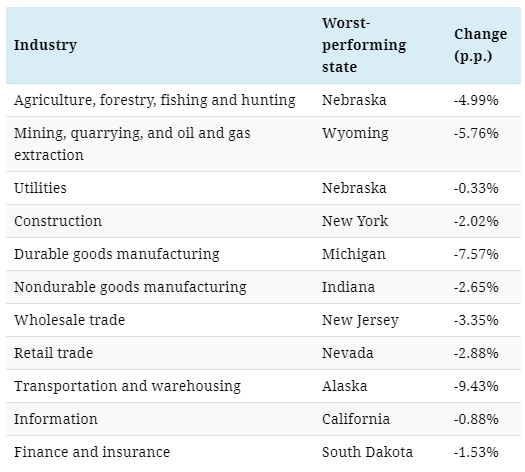
Looking at it another way, the industry’s worst performing state is also evident when measuring the change in percentage points (pp) Contributions to GDP for the first and second quarters of 2020. Of the 21 industries profiled, Nevada appears at the extreme bottom of the spectrum four times.

Transportation and warehousing are down nearly 10% in Alaska / Image: Visual Capitalist
With many American business leaders expecting a second downturn in the economy, will future numbers reflect further declines, or will states rebound?
https://www.entrepreneur.com/article/359815

