Specialty women’s intimate apparel retailer Victoria’s Secret (NYSE: VSCO) stock has cratered (-44%) in this year’s bear market. The Company was spun-off from the Limited Brands in 2021 with 1,400 retail locations under the Victoria’s Secret and PINK brands. The Company beat its EPS estimates handily for its fiscal 2021 managing headwinds including inflationary pressures, supply chain disruptions, weather and market volatility, and rising logistics costs. However, revenues fell (-4.5%) largely due to the reversion from stimulus check spending. Inventory levels ended the quarter up 37% due to longer transit time and strategic assortment decisions to drive future growth. Only 10% of it was carryover inventory. The Company has improved its distribution with the launch of VS&Co. Lab and expects to be a second-half growth story with new product rollouts notably in the bra and beauty lines. Prudent investors that have been waiting for exposure in this iconic intimate wear retailer can watch for opportunistic pullbacks in shares of Victoria’s Secret.
 MarketBeat.com – MarketBeat
 Q1 Fiscal 2022 Earnings Release
On May 31, 2022, Victoria’s Secret released its fiscal first-quarter fiscal 2022 results for the quarter ending April 2022. The Company reported earnings-per-share (EPS) of $1.11 excluding non-recurring items versus consensus analyst estimates for a profit of $0.84, a $0.27 per share beat. Revenues fell (-4.5%) year-over-year (YoY) to $1.48 billion, beating consensus analyst estimates for $1.47 billion. The Company returned $110 million to shareholders through its capital allocation program. Victoria’s Secret CEO Martin Waters stated, “As a result of our deliberate actions, we have stabilized the business and delivered over $1 billion in EBITDA for the trailing twelve-month period. Looking ahead, I believe we have the focused strategy, resilient and expert talent, and customer connection that we need to sustain and grow our dominant position as the market leader in the intimates merchandise category. We are well prepared to continue to address macro challenges through merchandise and marketing that delights our customers, new business initiatives designed to expand our customer base and grow sales, and disciplined financial management.”
In-Line Guidance
Victoria’s Secret issued in-line guidance for fiscal Q2 2022 for EPS between $0.95 to $1.17 versus $1.17 consensus analyst estimates. Revenues are expected to up low single digits to down low single digits. Consensus analyst estimates for revenues is for (-1%) YoY decline.
Conference Call Takeaways
CEO Waters stated the Company generated over $1 billion in EBITDA for the trailing 12-month period. The (-4.5%) sales decline was adjusted for $75 million stimulus to flat sales to last year. Momentum was seen in the bra and beauty business as international recovered from prior COVID-related restrictions. Adjusted operating income came in above the previously expected $80 million to $110 million range at $116 million. He expects the rest of the year to continue to be challenging with volatility attributed to macroeconomic conditions. The Company expects fiscal Q2 2022 operating income to range between $125 million to $155 million. For the full-year 2022 the Company expects sales to be flat to up low single digits. CEO Waters sees a number of opportunities in the latter part of the year including new bras for both PINK and Victoria’s Secret brands. In Beauty, the Company expanded distribution with the launch of VS&Co. Lab as its loyalty program. He feels the business has been stabilized now. He feels the Company can maintain operating income in the low double-digit percentages of sales towards achieving its goal if mid-teens operating income rate.

VSCO Opportunistic Pullback Price Levels
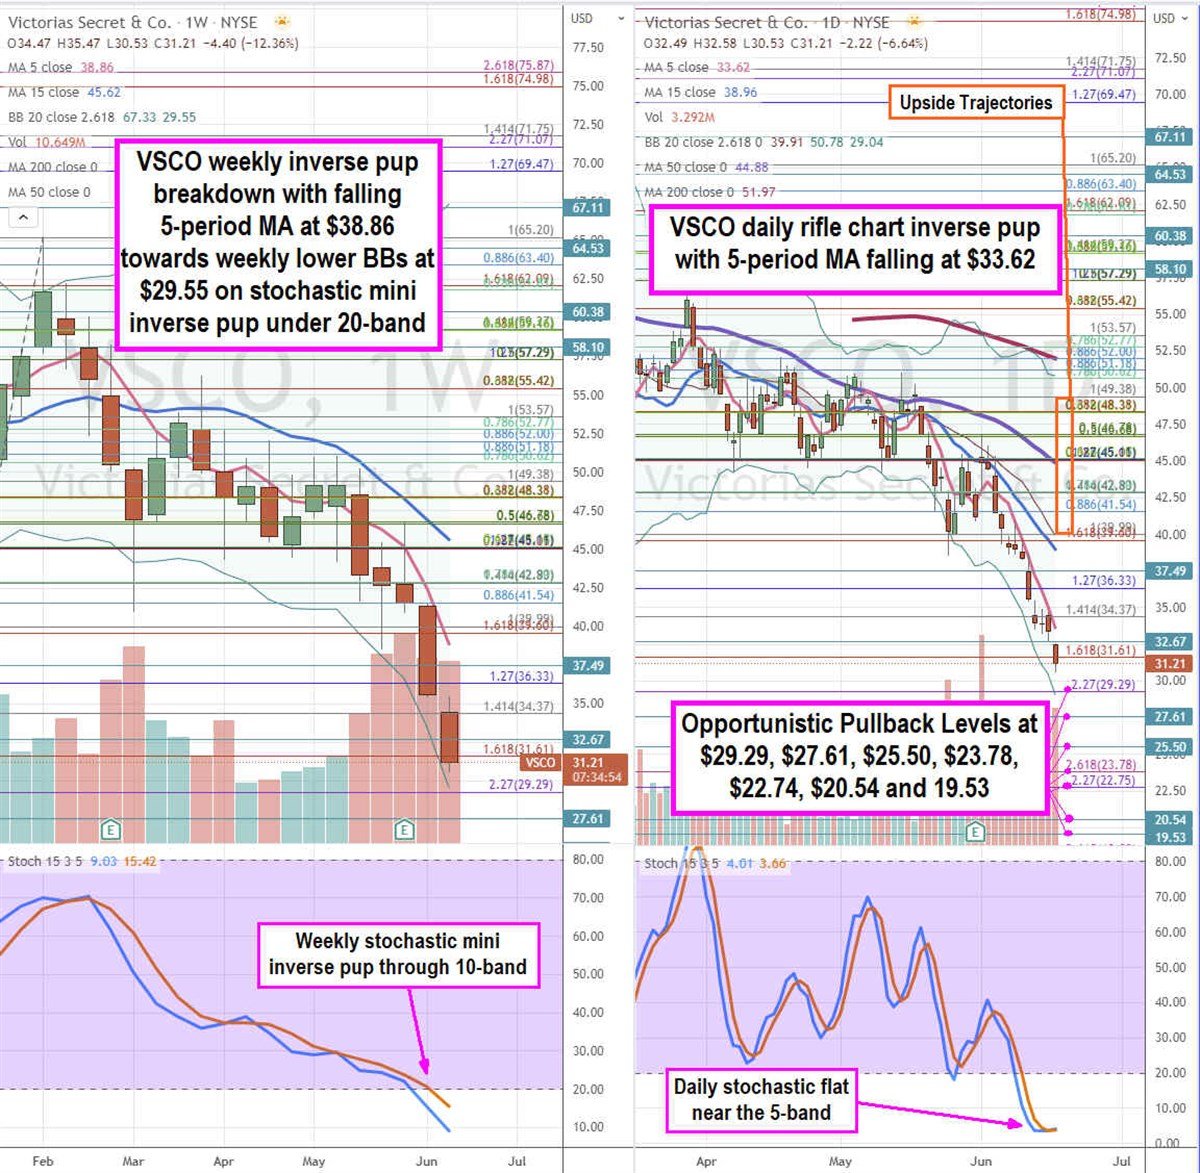
Using the rifle charts on the weekly and daily time frames provides a precision view of the landscape for VSCO stock. The weekly rifle chart triggered an inverse pup breakdown after rejecting off the $46.78 Fibonacci (fib) level. The weekly rifle chart downtrend has a falling 5-period moving average (MA) at $38.86 followed by the 15-period MA at $45.62 and lower weekly Bollinger Bands (BBs) at $29.55. The weekly stochastic mini inverse pup leaned through the 10-band. The weekly market structure low (MSL) buy triggers on a breakout above $52.77. The daily rifle chart also has an inverse pup breakdown with a falling 5-period MA at $33.62 followed by the 15-period MA at $38.96 and lower daily BBs at $29.04. The daily stochastic is stalled near the 5-band. The daily 50-period MA sits at $44.88 and daily 200-period MA at $51.97. Opportunistic pullback levels sit at the $29.29 fib, $27.61, $25.50, $23.78 fib, $22.75 fib, $20.54, and the $19.53 level. Upside trajectories range from the $39.99 fib up to the $49.38 fib level.
https://www.entrepreneur.com/article/430093

